XRP Price Move Below $1: Analyst Warns That Another Crash Is Coming

bitcoinistPublicado a 2026-04-02Actualizado a 2026-04-02

Resumen

Technical analysis by CasiTrades indicates that XRP, after holding above $1 for over a year, is at risk of a significant decline. The analyst warns of a multi-stage bearish structure based on Elliott Wave Theory. Recent weak bounces, consistently rejected at the 0.382 Fibonacci level, signal strong seller control and lack of buyer momentum. XRP is currently in a Wave 3 decline, projected to drop to around $1.09–$1.06. A brief Wave 4 relief bounce may push the price to $1.22–$1.31, but the bearish trend is expected to continue. The final Wave 5 could drive XRP down to a major support zone near $0.87, based on a larger Fibonacci retracement. Despite this bearish outlook, the analyst suggests that a larger Wave 3 recovery could eventually push the price back above $2.

XRP’s price action has managed to hold above $1 for over a year, but technical analysis shows this could be over soon. Notably, technical analysis from crypto analyst CasiTrades warned about a bearish outlook on the token, with the outlook that there’s still a multi-stage decline in play, which could cause the price of XRP to fall to as low as $0.87.

Weak Bounces Signal Sellers Still In Control

CasiTrades flagged the character of recent relief moves as a bearish signal. According to the analysis, XRP’s recent price behavior is showing clear signs of exhaustion on the upside. This is because every bounce has been cut short around the 0.382 Fibonacci retracement level, which is a clear indication that sellers are still in control of the price action.

This repeated rejection at shallow retracement levels is a reflection of another broader issue the XRP price is currently facing: buyers are not stepping in with enough strength to change momentum. Instead, each bounce is being sold into quickly, keeping the altcoin locked in a downward structure.

The structure outlined in the analysis follows a clear Elliott Wave breakdown, with XRP playing out a Wave 3 move to the downside. In the context of Elliot Waves, Wave 3 is the most intense part of both bullish and bearish wave cycles.
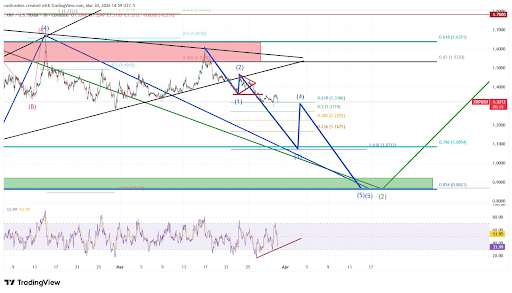
Source: Chart from CasiTrades on X

Based on this count, XRP is projected to drop to as low as $1.09 during Wave 3, with intermediate subwave targets around $1.06. These levels are based on previous liquidity zones and Fibonacci retracements at 0.786 on a larger cycle and 1.618 on a lower cycle.

A temporary relief bounce is expected afterward, which would create the next impulse Wave 4. Wave 4 is expected to push the XRP price back into the $1.22 to $1.31 range. However, this move is going to be a brief correction against Wave 3, and the broader bearish trend will still be in place.

Sub-$1 Scenario Comes Into Focus

After Wave 4 comes Wave 5, which is a continuation impulse wave in Elliott Wave theory. The most notable part of the forecast lies in how XRP ends up in Wave 5, which is the final leg of the structure. After the projected relief bounce, the analyst predicted a continuation lower toward a major macro support zone around $0.87. This price target is based on the 0.854 Fib retracement on the larger cycle.

Interestingly, the chart above shows that these five impulse wave counts are subwaves of a larger Wave 2 (labeled in green in the chart above), which is also a corrective wave in the Elliott Waves Theory. A bottom around $0.87 is not the end, as the next move would be the larger Wave 3, which is predicted to take the XRP price back above $2.

XRP trading at $1.34 on the 1D chart | Source: XRPUSDT on Tradingview.com

Criptos en tendencia

Preguntas relacionadas

QAccording to the analyst CasiTrades, what is the primary reason the recent price bounces of XRP are considered bearish signals?

AThe recent price bounces are considered bearish because they have been repeatedly cut short around the 0.382 Fibonacci retracement level, indicating that sellers are still in control and that buyers lack the strength to change the momentum.

QWhat is the projected lowest price target for XRP during the Wave 3 decline as per the Elliott Wave analysis?

AThe projected lowest price target for XRP during the Wave 3 decline is $1.09, with intermediate subwave targets around $1.06.

QWhat price range is the temporary relief bounce (Wave 4) expected to push XRP into?

AThe temporary relief bounce (Wave 4) is expected to push the XRP price back into the range of $1.22 to $1.31.

QWhat is the final price target for the larger Wave 5 decline, and what technical level is this target based on?

AThe final price target for the larger Wave 5 decline is around $0.87, which is based on the 0.854 Fibonacci retracement level on the larger cycle.

QDespite the bearish short-term forecast, what is the predicted long-term price target for XRP after the completion of the larger Wave 2 correction?

AAfter the completion of the larger Wave 2 correction, the subsequent Wave 3 is predicted to take the XRP price back above $2.

Lecturas Relacionadas

Will the Fed Definitely Raise Interest Rates in September? How Will Crypto and U.S. Stocks Withstand the Pressure?

The market's expectation for a September Fed rate hike surged dramatically in early August, jumping from under 50% to over 80% within a week. This shift followed a contentious July FOMC meeting, where a 9-3 vote to hold rates revealed growing dissent from hawkish members advocating for an immediate hike to combat persistent inflation. The primary catalyst for this repricing is rising oil prices, driven by renewed geopolitical tensions around the Strait of Hormuz, which threaten global supply. Energy costs directly influence inflation metrics, making the upcoming July CPI report (due August 12th) a critical data point. If it shows inflation reaccelerating, the probability of a September hike will solidify. For Bitcoin and crypto assets, this is typically bearish news. Bitcoin continues to behave as a high-beta, liquidity-sensitive risk asset. A rate hike raises the opportunity cost of holding non-yielding assets and could drive capital toward money markets, pressuring crypto prices in the short term. However, historical patterns suggest that if a hike is perceived as the end of a tightening cycle rather than the start, any negative price impact may be brief. U.S. stocks, particularly crypto-linked equities like Coinbase and growth-oriented tech stocks, are also vulnerable. Higher rates increase discount rates in valuation models, putting pressure on high-multiple companies. This coincides with a pivotal tech earnings season where investor focus has shifted from massive AI capital expenditure to tangible revenue and cash flow generation. Companies with negative cash flow and weak growth narratives could face heightened volatility if borrowing costs rise in September. In summary, a September Fed hike has evolved into a mainstream market scenario. Key factors to watch are oil prices, the July CPI report, and Fed communications, which will determine the final decision and its impact on volatile crypto and equity markets.

marsbitHace 2 min(s)

Will the Fed Definitely Raise Interest Rates in September? How Will Crypto and U.S. Stocks Withstand the Pressure?

marsbitHace 2 min(s)

A 'Overlooked' Market Event: Joint US-Japan-South Korea Intervention, Rare US Treasury Involvement, and Bessent's Quiet 'Market Rescue'?

Summary: The United States, Japan, and South Korea executed their largest coordinated foreign exchange intervention in nearly 30 years. The action targeted depreciation pressure on the Japanese yen and South Korean won. This move is seen as a significant effort by the US to stabilize the financial markets of its key allies and prevent the spillover of risks. Key details: * Japan reportedly intervened on July 30 using approximately 8.45 trillion yen (about $52.8 billion). South Korean authorities also intervened that day, selling dollars to support the won. * Notably, the US Treasury Department intervened directly in yen markets for the first time in roughly 30 years. The New York Fed, reportedly acting on behalf of the Treasury, sold euros to buy yen via Goldman Sachs and Morgan Stanley on July 31. Analysts view the use of the euro-yen pair as a way to alleviate yen pressure without adding selling pressure to the US dollar. * Prior to the action, the New York Fed conducted "rate checks" on both USD/JPY and EUR/JPY, a newer signaling tool that falls between verbal and physical intervention. The intervention is interpreted as going beyond traditional currency stabilization. Analysts, such as Michael Hartnett of Bank of America, suggest it resembles a "Price Keeping Operation" for the AI era. The core US objectives are perceived to be: 1. Preventing rapid yen depreciation from triggering a sharp rise in Japanese government bond yields. 2. Containing financial stress from spreading across Asian markets like South Korea and Japan. 3. Reducing the risk of disorderly capital flows impacting the US bond market. This coordinated action underscores the importance of Japan and South Korea as critical partners in the US semiconductor and AI supply chain. Stabilizing their financial markets is seen as vital to mitigating risks to the broader tech industry and the US market itself. The intervention coincides with market pressures, including the KOSDAQ index hitting a low since October 2022. While seen as a move to control volatility, some analysts caution it may not fundamentally reverse existing market trends.

marsbitHace 5 min(s)

A 'Overlooked' Market Event: Joint US-Japan-South Korea Intervention, Rare US Treasury Involvement, and Bessent's Quiet 'Market Rescue'?

marsbitHace 5 min(s)

Will the Federal Reserve Definitely Raise Interest Rates in September? How Will Cryptocurrencies and US Stocks Bear the Pressure?

In early August 2024, market expectations for a September Federal Reserve rate hike surged dramatically, from below 50% to over 80%, driven by renewed inflation concerns. This shift followed a contentious July FOMC meeting where a 9-3 vote to hold rates revealed a growing hawkish faction advocating for an immediate hike, citing prolonged above-target inflation. The key catalyst is escalating conflict near the Strait of Hormuz, which has pushed oil prices up approximately 20% in July, threatening to reignite inflation. The next critical data point is the July CPI report on August 12th; a hot reading could solidify hike expectations. For crypto assets, particularly Bitcoin, this represents near-term pressure. Bitcoin continues to exhibit high-beta, risk-on characteristics, making it sensitive to tightening liquidity and higher opportunity costs. However, historical precedent suggests that if a hike is perceived as the cycle's end rather than its start, the negative impact may be brief, with markets quickly pivoting to anticipate future rate cuts. U.S. stocks, especially crypto-linked equities like Coinbase and high-valuation tech stocks, face amplified volatility. Higher rates increase discount rates in valuation models, pressuring growth stocks. This coincides with a pivotal tech earnings season where investor focus has shifted from massive AI capital expenditures to demonstrable revenue and cash flow generation. Companies with negative cash flows and weak growth narratives could see severe pressure if a September hike materializes, as financing costs would rise. Key indicators to watch include oil prices, upcoming inflation data, and Fed commentary at events like the Jackson Hole symposium.

Odaily星球日报Hace 5 min(s)

Will the Federal Reserve Definitely Raise Interest Rates in September? How Will Cryptocurrencies and US Stocks Bear the Pressure?

Odaily星球日报Hace 5 min(s)

Trading

Spot

Artículos destacados

Cómo comprar MOVE

¡Bienvenido a HTX.com! Hemos hecho que comprar Movement (MOVE) sea simple y conveniente. Sigue nuestra guía paso a paso para iniciar tu viaje de criptos.Paso 1: crea tu cuenta HTXUtiliza tu correo electrónico o número de teléfono para registrarte y obtener una cuenta gratuita en HTX. Experimenta un proceso de registro sin complicaciones y desbloquea todas las funciones.Obtener mi cuentaPaso 2: ve a Comprar cripto y elige tu método de pagoTarjeta de crédito/débito: usa tu Visa o Mastercard para comprar Movement (MOVE) al instante.Saldo: utiliza fondos del saldo de tu cuenta HTX para tradear sin problemas.Terceros: hemos agregado métodos de pago populares como Google Pay y Apple Pay para mejorar la comodidad.P2P: tradear directamente con otros usuarios en HTX.Over-the-Counter (OTC): ofrecemos servicios personalizados y tipos de cambio competitivos para los traders.Paso 3: guarda tu Movement (MOVE)Después de comprar tu Movement (MOVE), guárdalo en tu cuenta HTX. Alternativamente, puedes enviarlo a otro lugar mediante transferencia blockchain o utilizarlo para tradear otras criptomonedas.Paso 4: tradear Movement (MOVE)Tradear fácilmente con Movement (MOVE) en HTX's mercado spot. Simplemente accede a tu cuenta, selecciona tu par de trading, ejecuta tus trades y monitorea en tiempo real. Ofrecemos una experiencia fácil de usar tanto para principiantes como para traders experimentados.

324 Vistas totalesPublicado en 2024.12.13Actualizado en 2026.06.02

Cómo comprar MOVE

Discusiones

Bienvenido a la comunidad de HTX. Aquí puedes mantenerte informado sobre los últimos desarrollos de la plataforma y acceder a análisis profesionales del mercado. A continuación se presentan las opiniones de los usuarios sobre el precio de MOVE (MOVE).

活动图片