XRP at a Critical Juncture: Stagnating Before Strong Resistance - Will It Break Through or Plummet?

金色财经Publicado a 2025-12-12Actualizado a 2025-12-12

Resumen

XRP price has initiated a fresh decline after falling below the $2.080 and $2.050 support levels. It is currently trading below $2.050 and the 100-hour Simple Moving Average, showing signs of weakness near the $2.040 resistance area. A descending trend line is forming with resistance near $2.040 on the hourly chart. Key support levels are identified at $2.00 and $1.9850. A break below $2.00 could lead to further declines toward $1.920 and possibly $1.880. On the upside, immediate resistance is near $2.040, followed by major hurdles at $2.080 and $2.150. A close above $2.080 might initiate a move toward $2.1850 and $2.220. Technical indicators show the hourly MACD is losing momentum in the bearish zone, while the RSI is above 50. The market remains at a critical juncture, with the potential for either an upward breakout or further downside movement.

Article Source: WeChat Official Account Miao Jie Trading Diary

XRP price started a new decline after breaking below $2.080. The current price action is weak, facing resistance near the $2.040 level.

  • XRP price started a new decline after breaking below the $2.050 zone.

  • The price is currently below $2.050 and the 100-hour Simple Moving Average.

  • A descending trend line is forming on the XRP/USD hourly chart with resistance near $2.040 (data source: Kraken).

  • The pair could extend its decline if it breaks below $2.00.

XRP Price Hovers Near Resistance

XRP price attempted a recovery wave above $2.150 but failed to continue higher, unlike Bitcoin and Ethereum. Subsequently, the price started a new decline, breaking below $2.080 and $2.050.

The price broke below the $2.00 support and formed a low near $1.993 before starting a recovery correction. There was a move above the 23.6% Fib retracement level of the downward move from the $2.177 high to the $1.993 low.

However, bears were active near $2.040 and $2.050. A descending trend line is also forming with resistance near $2.040 on the hourly chart of XRP/USD. The price is now below $2.050 and the 100-hour Simple Moving Average.

If there is another increase, the price might face resistance near $2.040. The first major resistance is near $2.080 or the 50% Fib retracement level of the downward move from the $2.177 high to the $1.993 low.
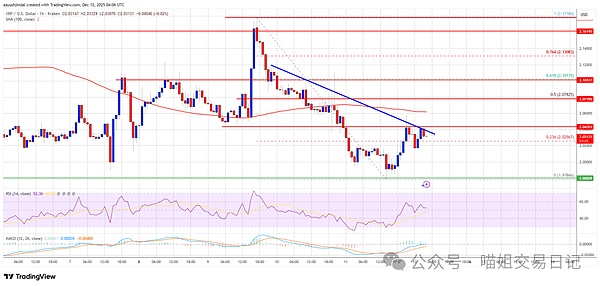
A close above $2.080 could push the price toward $2.012. The next resistance sits at $2.150. A clear move above the $2.150 resistance might send the price toward the $2.1850 resistance. Further gains could lead the price toward the $2.220 resistance. The next major resistance for the bulls could be near $2.250.

Another Decline?

If XRP fails to clear the $2.040 resistance, it could start another decline. Initial support on the downside is near $2.00. The next major support is near $1.9880.

If the price breaks below the $1.9880 level and closes below it, it could continue to move down toward $1.920. The next major support is near $1.880, below which the price might test $1.820.

Technical Indicators

Hourly MACD – The MACD for XRP/USD is now losing pace in the bearish zone.

Hourly RSI (Relative Strength Index) – The RSI for XRP/USD is now above the 50 level.

Major Support Levels – $2.00 and $1.9850.

Major Resistance Levels – $2.040 and $2.080.

Criptos en tendencia

Preguntas relacionadas

QWhat is the current resistance level that XRP is struggling to break above?

AXRP is currently facing resistance near the $2.040 level, where a descending trend line is forming on the hourly chart.

QWhat key support level could trigger another decline if broken?

AA break below the $2.00 support level could trigger another decline, with the next major support located near $1.9850.

QWhat was the high point from which the recent decline to $1.993 began?

AThe recent decline began from a high of $2.177 before dropping to the $1.993 low.

QWhat are the two major technical indicators mentioned and what are their current signals?

AThe hourly MACD is accelerating in the bearish zone, while the hourly RSI is currently above the 50 level.

QWhat price must XRP close above to start a potential rally towards $2.120?

AA close above the $2.080 resistance level is needed for XRP to start a potential rally towards $2.120 and higher.

Lecturas Relacionadas

Bitcoin Is Ready for "Parabolic Growth". Is Altseason Upon Us?

Amid a general market uptrend, experts are discussing the potential start of an 'altcoin season', where major cryptocurrencies could outpace Bitcoin's growth. This follows Bitcoin surpassing $81,000, predictions of a new bull market, and a capital shift from AI stocks toward Bitcoin and gold. Since August 17th, the crypto market has risen over 22%, primarily driven by Bitcoin (BTC) and Ethereum (ETH), which gained 25% and 30% respectively, reaching highs last seen in May. Analysts suggest the Bitcoin bear cycle has ended, anticipating a historically strong rally, with renewed institutional demand for cryptocurrency ETFs. BitMEX founder Arthur Hayes, in a recent interview, declared the start of a new bull market, predicting Bitcoin could quickly reach "hundreds of thousands" of dollars. Market observers interpret this as an expectation for 'parabolic growth.' Signs of a bull market revival include Bitcoin ETFs re-entering the top 10 most-traded ETFs, displacing some AI-focused funds. Analysts at CryptoQuant note capital is flowing from Bitcoin into riskier altcoins, with their bull market indicators showing the most optimistic signals since October 2025. However, the reality is more nuanced. The current surge is a rebound from yearly lows; Bitcoin's price is still down nearly 40% from its October peak. The Altcoin Season Index has dropped to 39 from 67 in early August, and Bitcoin's dominance remains around 60%, indicating investor focus is still on Bitcoin rather than altcoins. Experts predict the market is entering a phase where project fundamentals and real revenue, rather than speculation, will increasingly determine asset value.

cryptonews.ruHace 1 hora(s)

Bitcoin Is Ready for "Parabolic Growth". Is Altseason Upon Us?

cryptonews.ruHace 1 hora(s)

Trading

Spot

Artículos destacados

Cómo comprar PURR

¡Bienvenido a HTX.com! Hemos hecho que comprar Hyperliquid Strategies Inc. (PURR) sea simple y conveniente. Sigue nuestra guía paso a paso para iniciar tu viaje de criptos.Paso 1: crea tu cuenta HTXUtiliza tu correo electrónico o número de teléfono para registrarte y obtener una cuenta gratuita en HTX. Experimenta un proceso de registro sin complicaciones y desbloquea todas las funciones.Obtener mi cuentaPaso 2: ve a Comprar cripto y elige tu método de pagoTarjeta de crédito/débito: usa tu Visa o Mastercard para comprar Hyperliquid Strategies Inc. (PURR) al instante.Saldo: utiliza fondos del saldo de tu cuenta HTX para tradear sin problemas.Terceros: hemos agregado métodos de pago populares como Google Pay y Apple Pay para mejorar la comodidad.P2P: tradear directamente con otros usuarios en HTX.Over-the-Counter (OTC): ofrecemos servicios personalizados y tipos de cambio competitivos para los traders.Paso 3: guarda tu Hyperliquid Strategies Inc. (PURR)Después de comprar tu Hyperliquid Strategies Inc. (PURR), guárdalo en tu cuenta HTX. Alternativamente, puedes enviarlo a otro lugar mediante transferencia blockchain o utilizarlo para tradear otras criptomonedas.Paso 4: tradear Hyperliquid Strategies Inc. (PURR)Tradear fácilmente con Hyperliquid Strategies Inc. (PURR) en HTX's mercado spot. Simplemente accede a tu cuenta, selecciona tu par de trading, ejecuta tus trades y monitorea en tiempo real. Ofrecemos una experiencia fácil de usar tanto para principiantes como para traders experimentados.

153 Vistas totalesPublicado en 2026.08.21Actualizado en 2026.08.21

Cómo comprar PURR

Cómo comprar PDD

¡Bienvenido a HTX.com! Hemos hecho que comprar PDD Holdings, Inc. (PDD) sea simple y conveniente. Sigue nuestra guía paso a paso para iniciar tu viaje de criptos.Paso 1: crea tu cuenta HTXUtiliza tu correo electrónico o número de teléfono para registrarte y obtener una cuenta gratuita en HTX. Experimenta un proceso de registro sin complicaciones y desbloquea todas las funciones.Obtener mi cuentaPaso 2: ve a Comprar cripto y elige tu método de pagoTarjeta de crédito/débito: usa tu Visa o Mastercard para comprar PDD Holdings, Inc. (PDD) al instante.Saldo: utiliza fondos del saldo de tu cuenta HTX para tradear sin problemas.Terceros: hemos agregado métodos de pago populares como Google Pay y Apple Pay para mejorar la comodidad.P2P: tradear directamente con otros usuarios en HTX.Over-the-Counter (OTC): ofrecemos servicios personalizados y tipos de cambio competitivos para los traders.Paso 3: guarda tu PDD Holdings, Inc. (PDD)Después de comprar tu PDD Holdings, Inc. (PDD), guárdalo en tu cuenta HTX. Alternativamente, puedes enviarlo a otro lugar mediante transferencia blockchain o utilizarlo para tradear otras criptomonedas.Paso 4: tradear PDD Holdings, Inc. (PDD)Tradear fácilmente con PDD Holdings, Inc. (PDD) en HTX's mercado spot. Simplemente accede a tu cuenta, selecciona tu par de trading, ejecuta tus trades y monitorea en tiempo real. Ofrecemos una experiencia fácil de usar tanto para principiantes como para traders experimentados.

79 Vistas totalesPublicado en 2026.08.24Actualizado en 2026.08.24

Cómo comprar PDD

Qué es JP225

El índice bursátil más representativo de Japón, compuesto por 225 acciones de primera línea que cotizan en la Bolsa de Tokio, abarca industrias principales como la manufactura, la tecnología y las finanzas. Se ha publicado de manera continua desde 1950 y sirve como un referente fundamental para medir el rendimiento general del mercado de valores japonés.

27 Vistas totalesPublicado en 2026.08.25Actualizado en 2026.08.25

Qué es JP225

Discusiones

Bienvenido a la comunidad de HTX. Aquí puedes mantenerte informado sobre los últimos desarrollos de la plataforma y acceder a análisis profesionales del mercado. A continuación se presentan las opiniones de los usuarios sobre el precio de A (A).

活动图片