Will Bittensor [TAO] hold $193 or sink to $186? Watch out for 2 signs!

ambcryptoPublicado a 2026-07-15Actualizado a 2026-07-15

Resumen

Despite a slight broader crypto market recovery, Bittensor (TAO) maintained its bearish trend, falling below the $200 support to a monthly low of $193. As of writing, TAO traded around $197 with declining volume. Key reasons for the drop include derivatives traders reducing exposure, evidenced by higher Futures Outflows ($90.81M) than Inflows ($78.64M), pushing Netflow negative and Open Interest lower. This indicates reduced speculative activity and short-term selling pressure. However, spot market data presents a contrasting signal. Spot Taker CVD remained positive for five days, suggesting buyer dominance, and persistent negative Spot Netflow implies more TAO is leaving exchanges than entering, potentially indicating accumulation, possibly by whales. Technically, the Directional Movement Index shows bearish momentum strengthening, with the RSI at 37. If selling continues, TAO could test support at $186. Conversely, stronger spot demand could help it reclaim $200, potentially targeting $216. The price is currently caught between bearish derivatives trends and signs of underlying spot accumulation.

Although the broader crypto market rebounded slightly, Bittensor [TAO] maintained its bearish structure. The altcoin breached the $200 support and dropped to a monthly low of $193.

As of writing, TAO traded at $197 after declining 2.13% over 24 hours. Trading volume also fell 16%, indicating weaker market participation.

Why is Bittensor declining?

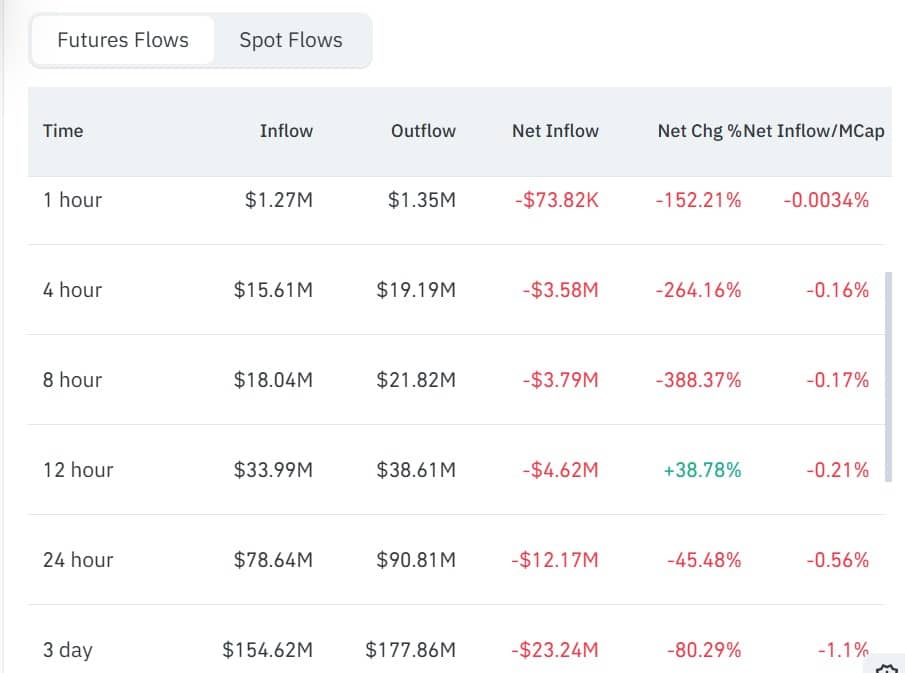
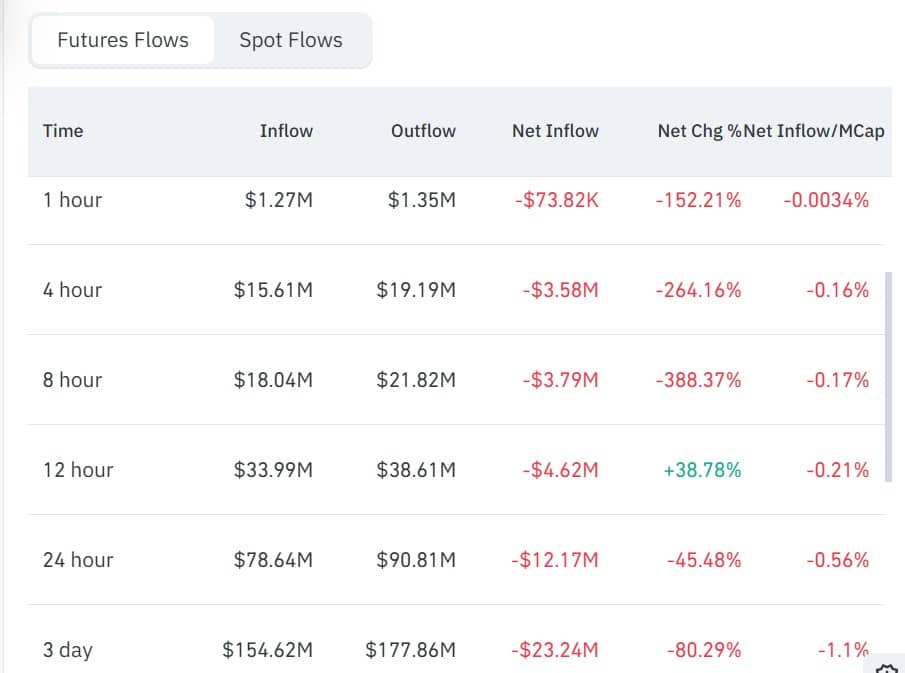
After TAO declined, derivatives traders reduced their exposure. Consequently, Futures Outflows exceeded Futures Inflows over the past 24 hours.

The altcoin recorded $90.81 million in Futures Outflows and $78.64 million in Futures Inflows.
Source: CoinGlass

This pushed Futures Netflow down 45% to negative $12.17 million. The decline extended a three-day trend. At the same time, Open Interest fell 1.26% to $229 million.

Together, these readings suggested that traders closed positions as TAO weakened. Reduced speculative activity could keep short-term pressure on its price.

Are whales buying the dip?

Even as TAO declined, Spot market data suggested that whales remained active.

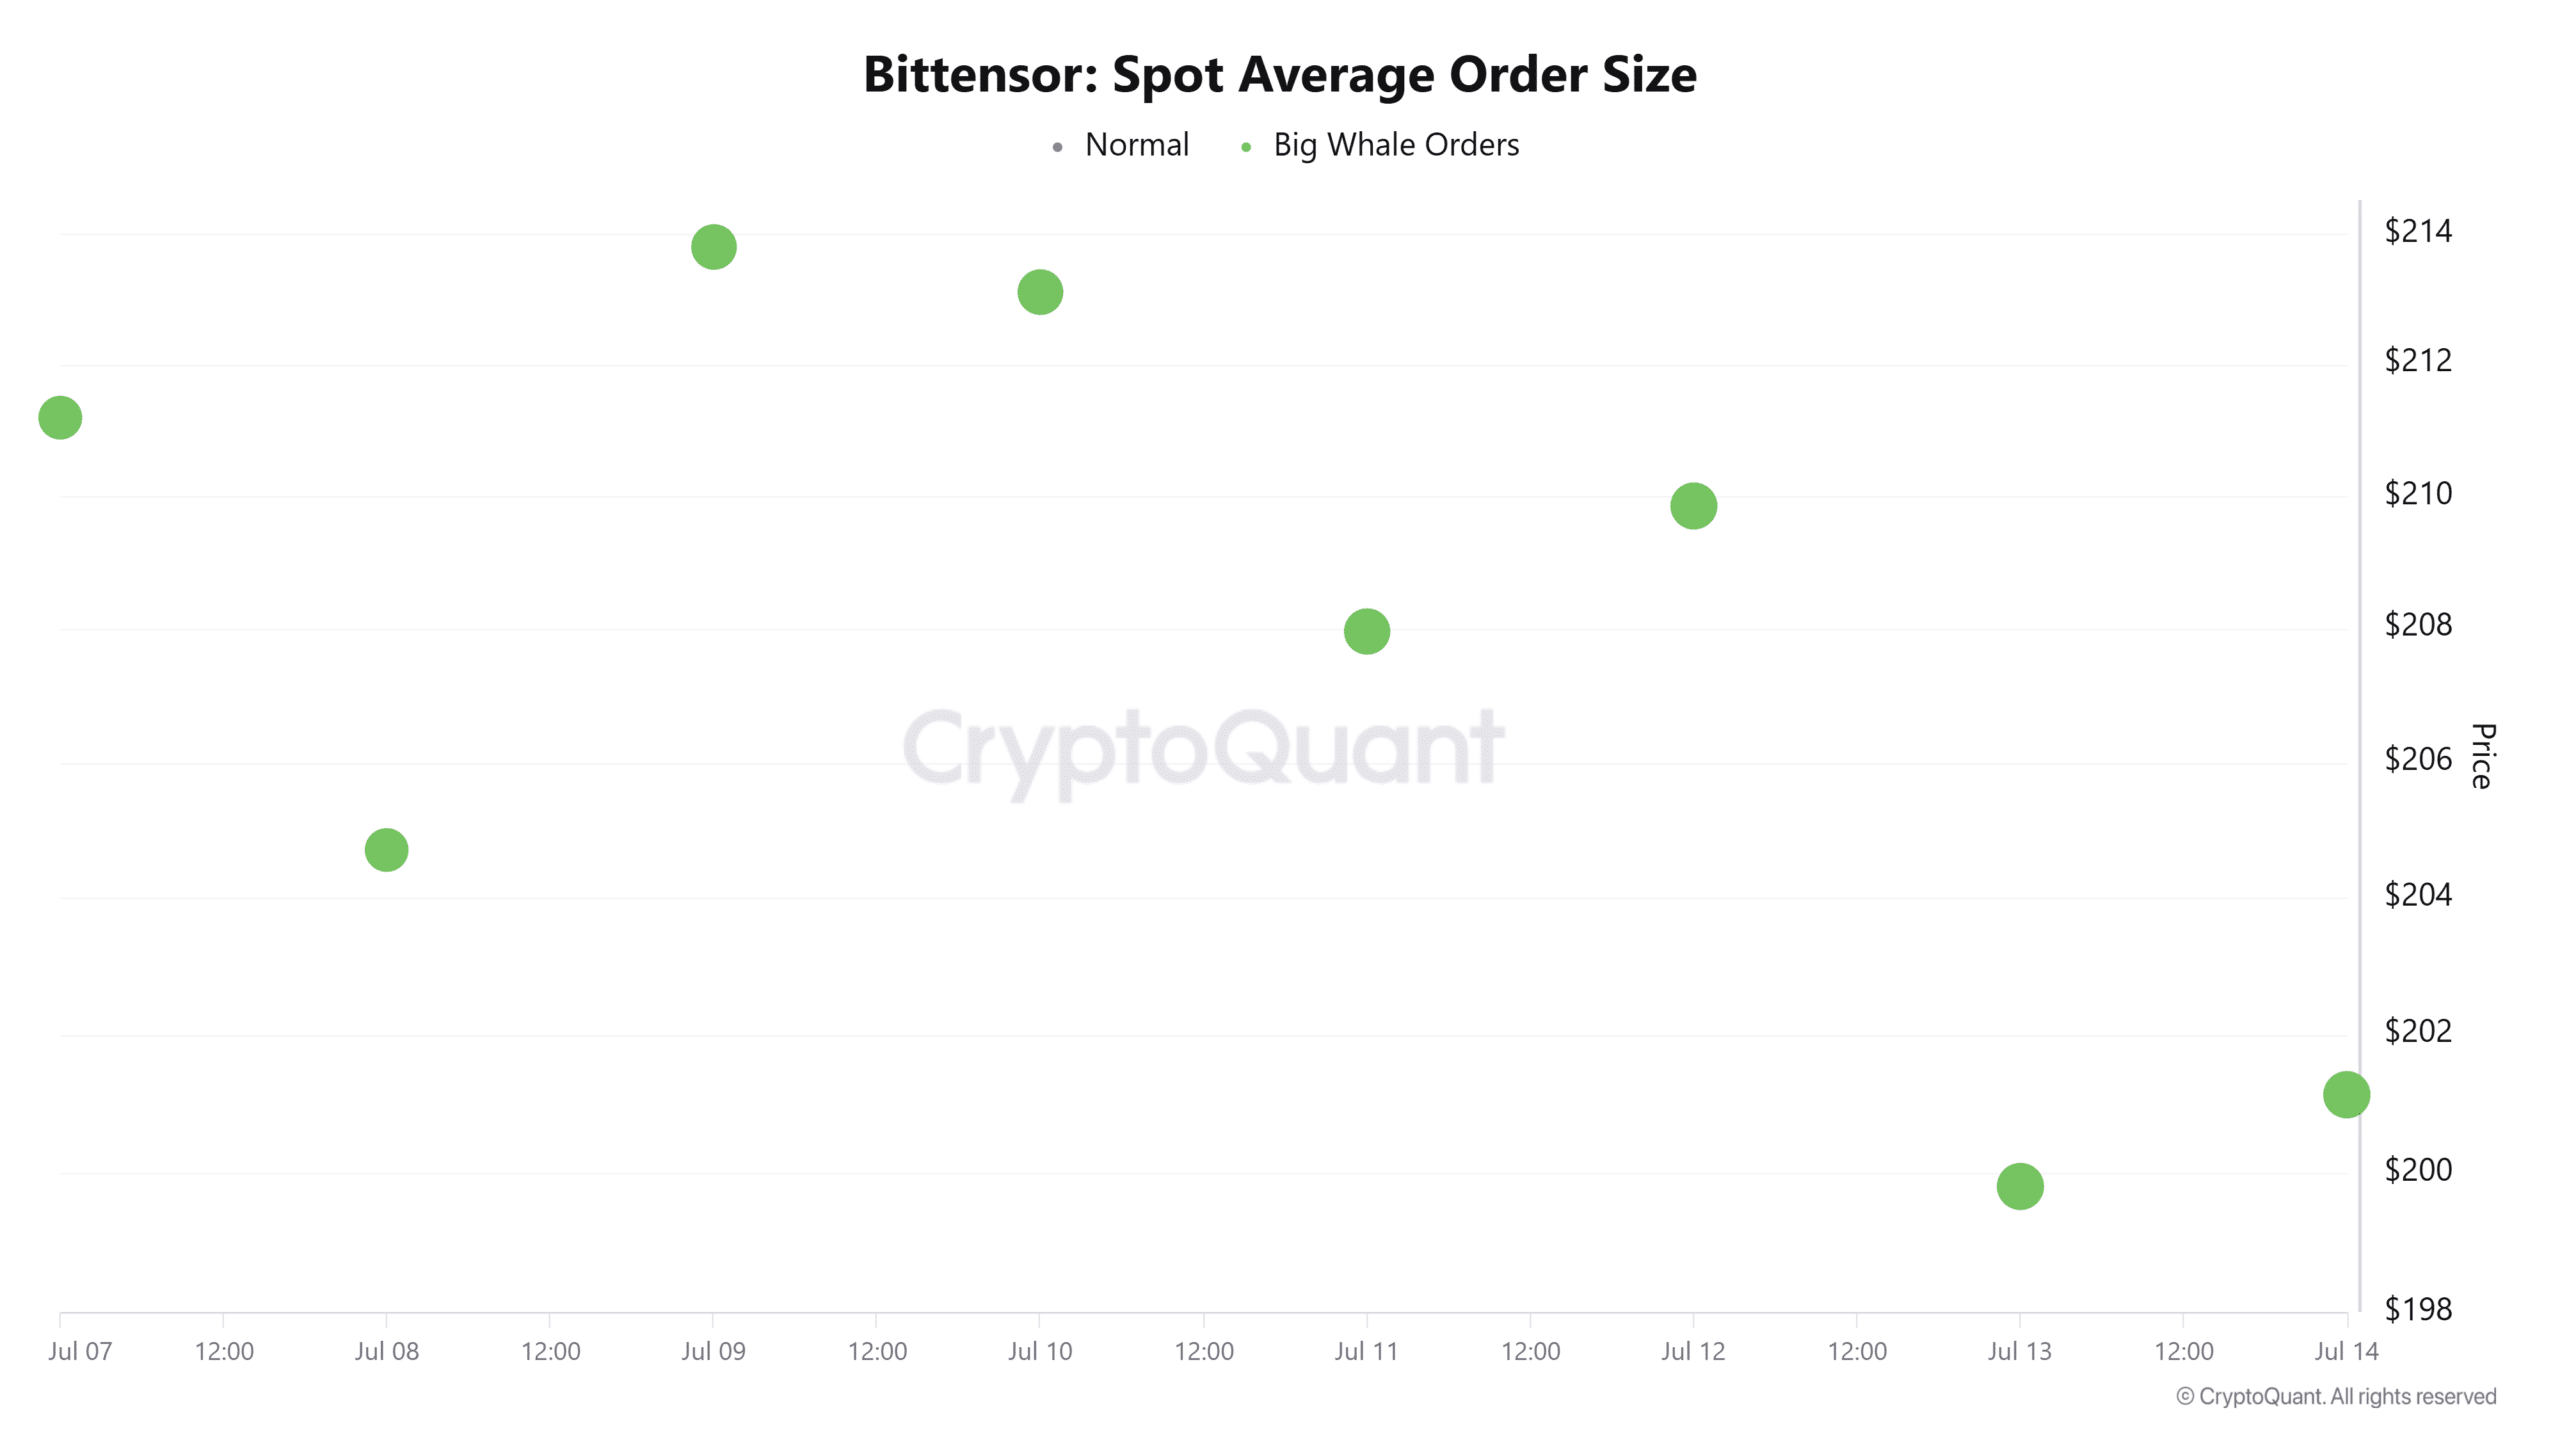
CryptoQuant’s Spot Average Order Size recorded large whale orders below $200. However, this metric alone could not confirm their direction.
Source: CryptoQuant

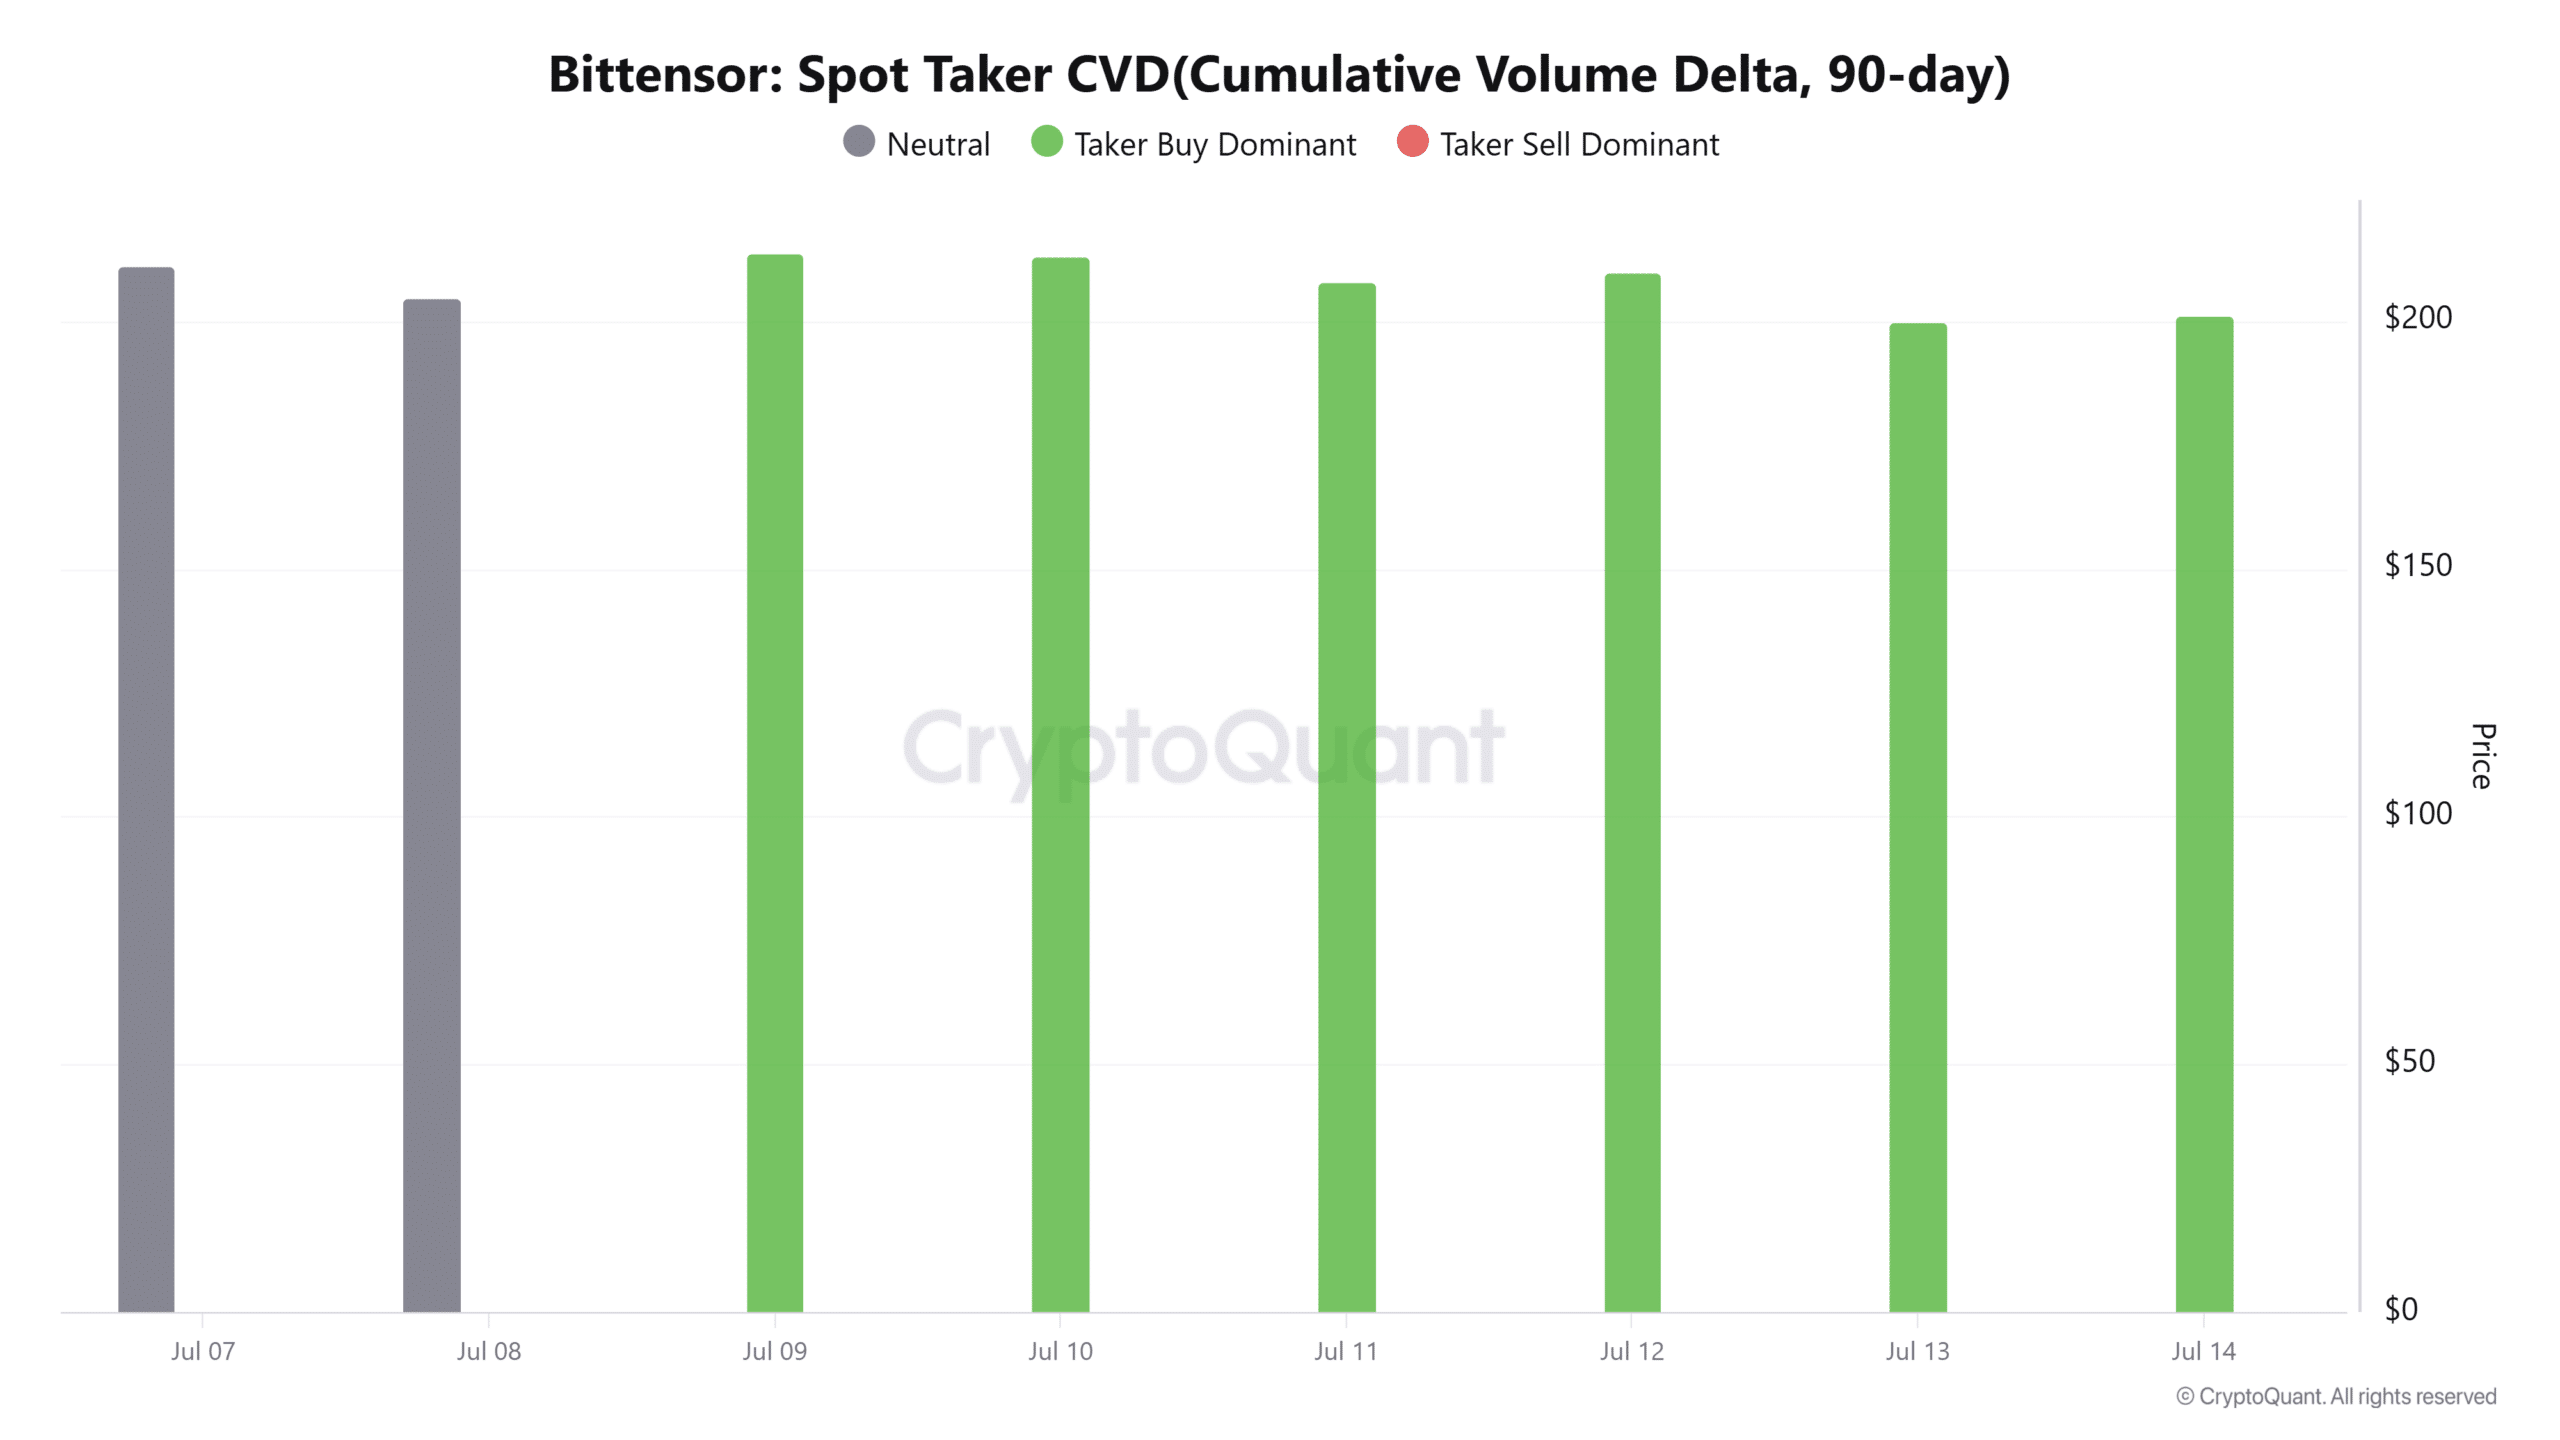
Spot Taker CVD provided clearer evidence. The metric remained positive for five days, suggesting that market buyers held the advantage.

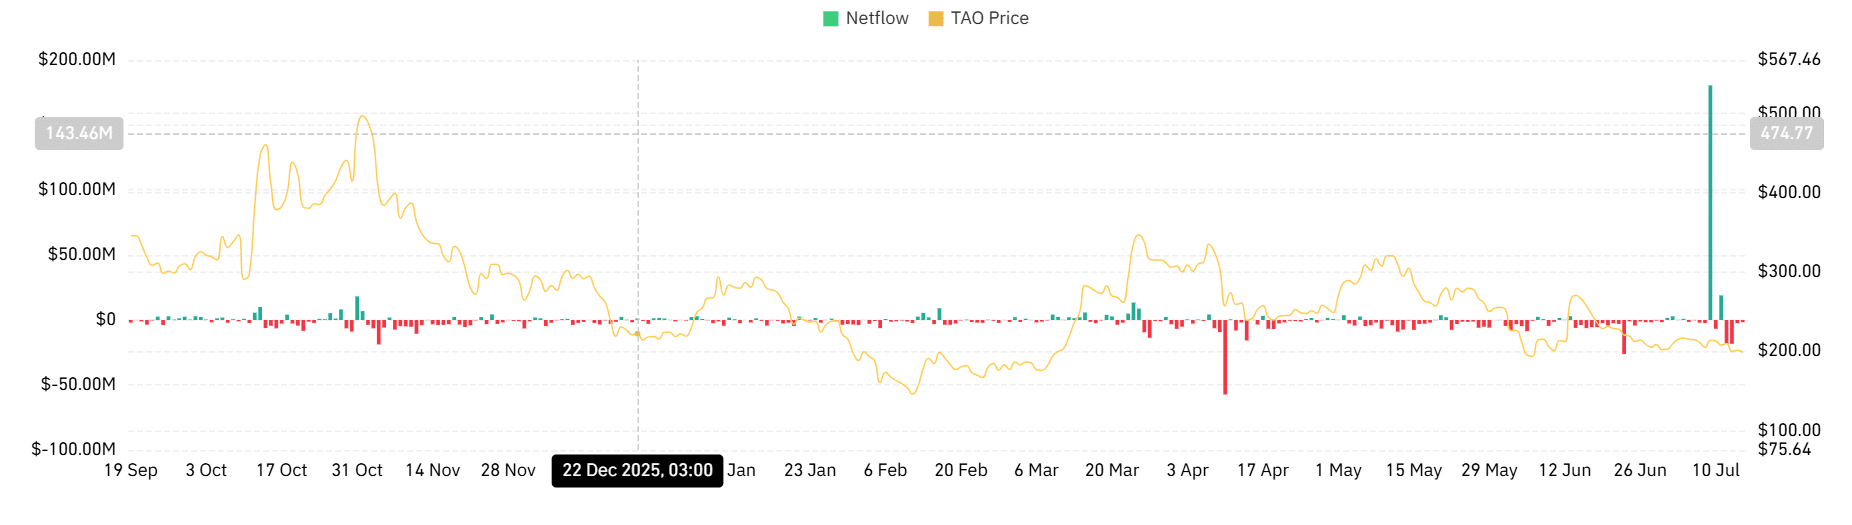
On top of that, Bittensor’s Spot Netflow remained negative for four consecutive days. Spot Netflow stood at negative $1.68 million, compared with negative $2.5 million one day earlier.
Source: CryptoQuant

Persistent negative Spot Netflow indicated that more TAO left exchanges than entered them. This trend could reflect accumulation or transfers into private custody.

Combined with positive Spot Taker CVD, the data strengthened the accumulation argument. However, it did not prove that whales caused every outflow.

Historically, stronger demand during market weakness has sometimes preceded price recoveries.
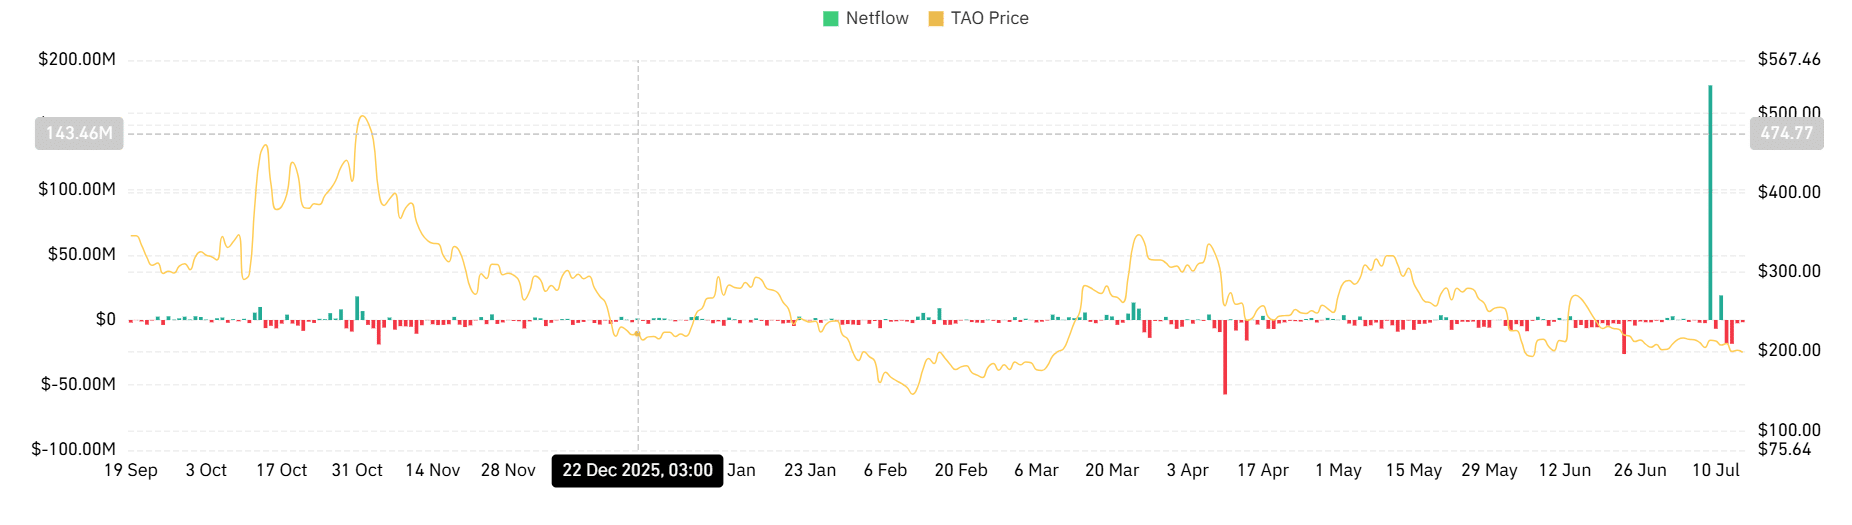
Source: CoinGlass

Can TAO reclaim $200?

Bittensor remained caught between bearish momentum and renewed Spot demand. For now, sellers appeared to retain control.

The Directional Movement Index [DMI] supported this view. The Positive Directional Indicator fell to 9.

Meanwhile, the Negative Directional Indicator rose to 22, while the Average Directional Index reached 23.
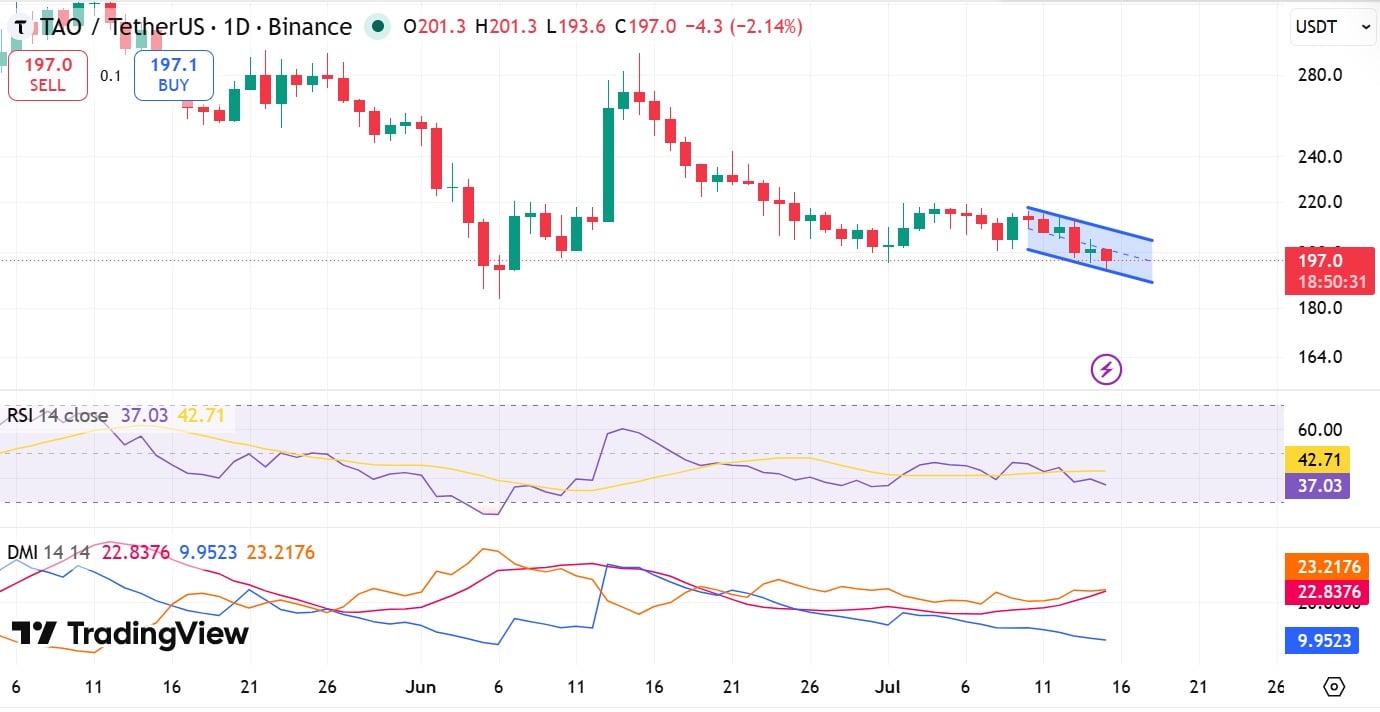
Source: TradingView

This setup suggested that bearish momentum was gaining strength. The Relative Strength Index also dropped to 37.

If selling continues, TAO could fall below $190 and test the $186 support. However, stronger Spot demand could help TAO reclaim $200. A sustained recovery may then place $216 back in focus.


Final Summary

  • TAO fell below $200 because Futures Outflows exceeded Inflows as Open Interest declined, suggesting that derivatives traders reduced exposure during the sell-off.
  • Positive Spot Taker CVD and exchange outflows suggested accumulation.

Preguntas relacionadas

QWhat is the current trading price of Bittensor (TAO) according to the article, and what was the 24-hour change?

AAs of the writing of the article, TAO traded at $197 after declining 2.13% over the past 24 hours.

QWhat are the two key pieces of data from the Spot market that suggest potential accumulation of TAO by whales or buyers?

AThe two key pieces of data are: 1) A positive Spot Taker CVD for five consecutive days, indicating market buyers had an advantage. 2) A negative Spot Netflow for four consecutive days, meaning more TAO was leaving exchanges than entering, which can suggest accumulation or transfer to private custody.

QWhat does the negative Futures Netflow figure indicate about derivatives trader behavior?

AThe negative Futures Netflow of $12.17 million indicates that Futures Outflows ($90.81M) exceeded Futures Inflows ($78.64M) over the past 24 hours. This suggests derivatives traders were closing their positions and reducing their exposure as TAO's price weakened.

QBased on the technical indicators mentioned, what are the two possible price levels TAO could test next?

AThe article states that if selling continues, TAO could fall to test the $186 support level. Conversely, if stronger Spot demand emerges, it could help TAO reclaim the $200 level, with a potential further recovery target of $216.

QHow do the DMI (Directional Movement Index) readings support the author's view on market control?

AThe DMI readings show the Positive Directional Indicator falling to 9 and the Negative Directional Indicator rising to 22, with the Average Directional Index at 23. This setup suggests bearish momentum is gaining strength, leading the author to conclude that sellers appear to retain control of the market for now.

Lecturas Relacionadas

Bernstein Bullish on Robinhood: Two Months to Top the Public Chain Ranks, 90% of Fees Go to HOOD

Bernstein is bullish on Robinhood's new blockchain, which has surged to become a top chain by transaction count within two months of its July 2026 launch. The Robinhood Chain, an Arbitrum-based Ethereum-compatible Layer 2 network, facilitates tokenized trading of stocks, ETFs, and other real-world assets. It has quickly amassed over $1.5B in TVL and generated $39M in net fees, with roughly 90% of that revenue accruing to HOOD. For a recent 15-day period, its fees even ranked first among all blockchains. Growth is primarily driven by a unique flywheel: meme coin trading attracts initial liquidity and users, which in turn fuels activity for tokenized stocks. The value of these on-chain stocks and ETFs grew 14x in two months to $140M, and they show a high turnover rate, being actively used in DeFi protocols. While fees have spiked recently—partly tied to meme coin speculation—the chain is building a more diversified ecosystem with significant capital in lending and yield products. Bernstein maintains an "Outperform" rating and a $160 price target for HOOD, highlighting the chain's potential to transform Robinhood from a retail broker into a high-margin, 24/7 global financial infrastructure platform. Key future challenges include sustaining growth beyond speculative trading and navigating the regulatory landscape for tokenized real-world assets.

marsbitHace 9 min(s)

Bernstein Bullish on Robinhood: Two Months to Top the Public Chain Ranks, 90% of Fees Go to HOOD

marsbitHace 9 min(s)

Brent Crude Breaks Above $100! PPI and CPI Data Flood In This Week, Fed Rate Hike Uncertainty Lingers

Brent Crude Oil Surpasses $100 Per Barrel! PPI and CPI Data Arrive Amid Lingering Fed Rate Hike Uncertainty Key inflation reports, the August Producer Price Index (PPI) and Consumer Price Index (CPI), are scheduled for release this week. This comes as Brent crude oil prices briefly broke above $100 per barrel, signaling potential upward pressure on production costs that could feed into future PPI readings. However, recent data on consumer spending shows a notable cooling. U.S. Bank Institute and NRF/CNBC retail metrics indicate a significant slowdown in card spending and retail sales growth in July. This suggests that any near-term inflation increase may stem more from supply-side shocks (like rising oil prices) rather than overheating demand, complicating the Federal Reserve's rate decision path. Market expectations for the data are mixed. While overall CPI is expected to hold at 3.4% year-over-year, core CPI is forecast to dip slightly to 2.4%, partly due to upcoming statistical methodology changes for core PCE. PPI readings face upside risks from elevated oil prices. The Fed's policy outlook appears in flux. Recent comments from officials have been divergent, with some leaning hawkish and others favoring patience. This has shifted market narrative from "no more hikes in 2024" to "further tightening remains possible." Notably, UBS revised its forecast, now predicting two 25-basis-point rate hikes in September and December, arguing this would be a "growth-driven" tightening cycle supportive for risk assets like equities, particularly in AI and resource themes, rather than a stagflationary scenario.

marsbitHace 9 min(s)

Brent Crude Breaks Above $100! PPI and CPI Data Flood In This Week, Fed Rate Hike Uncertainty Lingers

marsbitHace 9 min(s)

Trading

Spot
活动图片