Why Do Memes Only Cut You? An Article That Explains Their True Growth Mechanism

比推Publicado a 2026-01-21Actualizado a 2026-01-21

Resumen

The article "Why Do Meme Coins Only 'Cut' You? Clarifying Their True Growth Mechanism" offers a fresh, analytical perspective on meme coin dynamics, framing their growth not as irrational speculation but as a mathematically explainable phenomenon. The core argument is that a meme coin’s market capitalization isn't just driven by price increases (Z-axis), but is fundamentally supported and "propped up" by two underlying factors: narrative density (X-axis) and the network of传播 nodes (Y-axis). Together, these form the base radius of a "Wealth Cone." A meme with only height (price) but no base (narrative and community) is like a thin needle—easily toppled. A strong, expanding base is necessary to support sustainable, exponential growth. The proposed XYZ three-dimensional growth spiral model explains the interaction: * **X-axis (Narrative Density):** The meme's core idea, cultural resonance, originality, and the richness of community-created content. * **Y-axis (Propagation Network):** The transmission pipelines, from major influencers (e.g., Elon Musk) to KOLs and finally to retail investors. * **Z-axis (Capital Flow):** The monetization of attention, measured by market cap, trading volume, and crucially, liquidity depth. The lifecycle of a successful meme is a reflexive, spiral ascent through stages: **Ignition** (a Y-axis spike from a KOL callout lifts the Z-axis), **Spin** (price growth attracts more discussion, enriching the narrative), and **Ascension** (an expande...

Author: danny

Original Title:

Why Do the Memes You Buy Only Fall? — Deconstructing the Growth Spiral and Volume of Memes Using First Principles


In the eyes of most people, Meme coins are irrational狂欢, a fool's赌场. But from a mathematical perspective, the birth of every ten-thousand-fold myth is not accidental; it is actually a middle school spatial geometry evolution word problem.

This article proposes a颠覆性的 perspective: The market value of Meme coins is not "grown" but "propped up." The value of Memes can be calculated!

We are accustomed to focusing on the fluctuations of the Z-axis (price height), but we overlook that what determines life and death is the base radius constructed by the X (narrative density) and Y (propagation nodes) axes. A Meme with only height and no base is just a very thin "needle" that topples with the wind; only by continuously expanding the consensus radius can it support a stable, geometrically growing wealth cone under the gravity of capital.

Note: This article is a popular science article on "financial physics," not a rigorous econometric paper, and is only intended to provide a new perspective for viewing Memes.

1. The Beginning of the Theory: The Three-Dimensional Coordinate System of Memes

In the current cryptocurrency market, Meme coins are often seen as irrational狂欢. But is that really the case?

If we strip away the noise of emotions, KOL shilling, and community bandwagoning, we will find that the birth and death of every phenomenal Meme follows a strict mathematical logic.

The essence of Meme coins is the tokenization of the attention economy. Their market value is not determined by traditional discounted cash flow (DCF) but is jointly constructed by the breadth of the narrative, community resonance, and the explosive power of funds.

For better discussion, we define these factors as the XYZ three-dimensional growth spiral model.

These three axes are not just independent variables; there is a strong reflexivity between them—that is, a change in one variable reinforces another, forming a positive feedback loop.

Let's explain these parameters:

X-axis: Narrative Density and Cultural Memes

Definition: The "genes" of a Meme. Includes the core梗 (e.g., Doge), origin story (e.g., CZ's pet name), cultural symbols (e.g., Pepe the Frog), and the richness of community二次创作.

Key metrics: Narrative originality, replicability, emotional resonance.

Y-axis: Propagation Potential and Node Network

Definition: The transmission pipeline of information. From top-tier nodes (CZ, Elon Musk) to secondary nodes (Alpha Callers, KOLs), and then to end nodes (ordinary retail investors).

Key metrics: Node weight, propagation coverage, shilling frequency.

Z-axis: Fund Flow and Liquidity Carrier

Definition: The monetization result of attention. Includes on-chain fund inflows, liquidity depth—i.e., the沉淀的价值 or the total amount of sell orders that can be承接.

Key metrics: Market capitalization, trading volume, turnover rate, and liquidity (the most important metric).

2. Diagram of the Growth Curve of XYZ Axis Interaction

If we plot these three axes in three-dimensional space, the growth trajectory of a successful Meme will generally show a spiral upward trend: (as shown in the figure below)
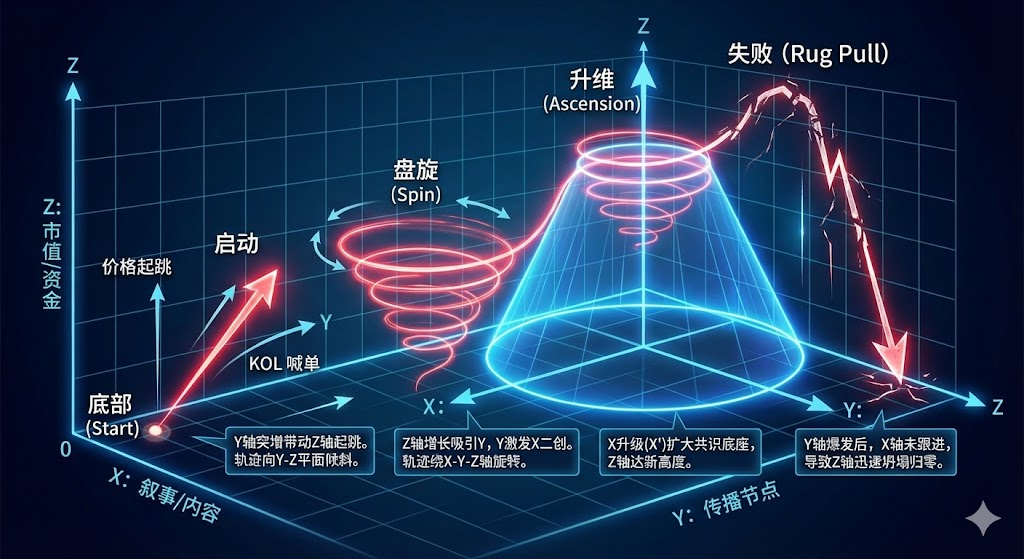
Bottom (Start): X, Y, Z are all close to zero.

Ignition: The Y-axis surges (KOL shilling), driving the Z-axis (price) to jump. The trajectory line tilts toward the Y-Z plane.

Spin: The growth of the Z-axis attracts more Y (more people discussing), and Y stimulates X's二次创作 (enriching content). The trajectory line begins to rotate around the X-Y-Z axes.

Ascension: As X is upgraded (X'), the base area of the cone expands (broader consensus range), and the Z-axis (market capitalization) reaches a new height.

Failed Meme (Rug Pull): Usually表现为 the Y-axis爆发后, the Z-axis briefly rises, but the X-axis fails to follow up with an upgrade (narrative scarcity), causing the Z-axis to quickly collapse to zero. The trajectory line shows an inverted V-shaped fall.

3. Evolution of the Growth Curve: The Spiral Ascension of Four Stages

From the previous section, we know that the lifecycle of a Meme is not linear but a vortex that continuously expands around the Z-axis (fund flow). In this section, we will analyze it based on the four development stages of Memes.

The figure below shows its standard evolution path: (I was also shocked at how cool AI drew it?!)


Original link:https://www.bitpush.news/articles/7604686

Preguntas relacionadas

QWhat is the core perspective proposed in the article regarding the growth of Meme coins?

AThe article proposes that Meme coin market capitalization is not simply 'rising' but is 'propped up' by a mathematical model involving narrative density (X-axis) and propagation nodes (Y-axis), which together form the base supporting the value (Z-axis).

QHow does the article define the X-axis in its Meme growth model?

AThe X-axis is defined as 'Narrative Density and Cultural Memes,' which includes the core meme, origin story, cultural symbols, and the richness of community-created content.

QAccording to the article, what is the role of the Y-axis in the Meme coin growth spiral?

AThe Y-axis represents 'Propagation Potential and Node Network,' which refers to the information transmission pipelines, from top nodes like influencers to secondary and end nodes like ordinary retail investors.

QWhat does the Z-axis represent in the XYZ model for Meme coins?

AThe Z-axis represents 'Capital Flow and Liquidity Carrier,' which is the monetization result of attention, including on-chain capital inflow, liquidity depth, and the total value that can absorb selling pressure.

QWhat is the key difference between a successful Meme and a failed one (Rug Pull) according to the model?

AA successful Meme undergoes a spiral ascent where narrative (X) and propagation (Y) expand to support the value (Z). A failed Meme (Rug Pull) sees a brief spike in Y and Z, but a lack of narrative development (X) causes the value to collapse back to zero.

Lecturas Relacionadas

From Gold to Bitcoin: Fixed Supply + Institutional Frenzy, Might It Repeat the 'Explosive' Price Trend?

"From Gold to Bitcoin: Fixed Supply and Institutional Frenzy May Lead to 'Explosive' Price Rally Analysts suggest Bitcoin's price action could mirror gold's over the past two decades, following the launch of spot Bitcoin ETFs. Gold ETFs, introduced in 2004, drove gold's price surge to a current market cap near $28 trillion. Both gold and Bitcoin are non-yielding stores of value, with prices driven purely by investor sentiment rather than cash flows or credit. Gold ETFs experienced dramatic cycles: explosive growth, painful drawdowns, and slow recoveries, with each cycle reaching higher peaks. Bitcoin ETFs, approved in early 2024, saw rapid institutional adoption but are now facing similar volatility. Recent warnings highlight the risk of significant ETF outflows disrupting the current rebound. BlackRock's IBIT, a leading Bitcoin ETF, has sold nearly 100,000 BTC to meet redemptions while still holding over 733,000. The core parallel is fixed supply: when demand surges, prices explode, but demand is often volatile and wave-like, not steady. Institutional interest, through ETFs and corporate adoption, remains a key support pillar, helping to cushion sell-offs. If Bitcoin captures even a fraction of gold's role as a store of value, its upside potential is immense, though the path will be marked by high volatility. For investors, focusing on long-term trends and managing risk is crucial as this 'price explosion' narrative unfolds."

Foresight NewsHace 6 min(s)

From Gold to Bitcoin: Fixed Supply + Institutional Frenzy, Might It Repeat the 'Explosive' Price Trend?

Foresight NewsHace 6 min(s)

Why Is AI Agent Shopping Hard to Popularize?

The article argues that the popular narrative of "AI agent shopping" – equipping AI with a wallet to autonomously handle purchases – is fundamentally flawed and oversimplifies the complexity of shopping. It deconstructs shopping into two core actions: **information retrieval** (standardized, easily automated) and **value judgment** (deeply subjective and human-centric). The narrative mistakenly assumes AI can fully handle both. Value judgment itself has two layers: **evaluation** (assessing options against criteria) and **demand definition** (setting the criteria, weights, and values). The latter is inherently human and dynamic, as preferences are not fixed but constructed during the decision-making process ("constructive preferences"). The real dividing line for automation is not product standardization, but whether the **act of choosing** itself holds experiential value. For mundane purchases (e.g., printer paper), full AI delegation works. For experiential goods (e.g., wine, furniture), the joy of selection is core to consumption, so AI should act as an assistant that narrows options, leaving the final choice to humans. The "AI wallet" concept confuses three separate elements: decision-making, execution, and fund custody. Current payment industry solutions (e.g., from Stripe, Mastercard, Google, Visa) show that limited, scoped payment authorization tokens are sufficient for most consumer scenarios, not full fund custody. The true use case for autonomous AI wallets is in **B2B procurement** and **machine-to-machine (M2M) settlements** for standardized, high-frequency, low-value transactions. The real bottlenecks for AI shopping are not payment technology, but **1) the lack of trusted data sources** (e.g., fake reviews, counterfeit goods) and **2) the impossibility of automating human demand definition**. The conclusion is that the focus should be on safely automating the assessment and filtering process while reserving for humans the rights to define their criteria and enjoy the final act of choice. For experiential goods, the platform's competitive advantage shifts to providing a superior selection experience.

Foresight NewsHace 1 hora(s)

Why Is AI Agent Shopping Hard to Popularize?

Foresight NewsHace 1 hora(s)

After Nine Months of Shorting, a Full Turn to Long: Renowned Trader Opens Bitcoin Positions Around 64K, Crypto Market Long-Short Divergence Intensifies

After nine months of being short, prominent crypto trader Doctor Profit has closed all his bearish positions and started buying Bitcoin near $64,000, signaling a complete bullish reversal. He argues that structural market changes—such as impending U.S. regulation (CLARITY Act) and institutional adoption via securities tokenization—are rewriting the traditional four-year cycle script, potentially bringing the market bottom forward from the widely expected September/October timeframe. This view finds some technical support from on-chain analyst gumsays, who notes a bullish divergence on Bitcoin's weekly chart has persisted for 147 days, nearing the 161-day duration seen before the 2022 cycle low. However, cycle researcher Jake Pahor presents a counter-argument based on historical data. Analyzing patterns since 2014, he identifies three common features of past bear market bottoms: a ~12-month duration from peak to trough, a sustained period of extreme fear (with a proprietary risk score below 20), and the price falling below Bitcoin's realized price (~$53,000 currently). The current cycle, only nine months from its October 2025 peak, meets none of these conditions. The debate highlights a market torn between "front-running" a potential early bottom driven by new fundamentals and waiting for confirmation through traditional on-chain and sentiment metrics. While Doctor Profit opts for aggressive buying, Pahor maintains a disciplined, tiered accumulation strategy, continuing weekly buys at current risk levels but reserving larger orders for if more extreme fear emerges.

marsbitHace 1 hora(s)

After Nine Months of Shorting, a Full Turn to Long: Renowned Trader Opens Bitcoin Positions Around 64K, Crypto Market Long-Short Divergence Intensifies

marsbitHace 1 hora(s)

Senior Trader's Confession: How to Trade Market's False Expectations?

Veteran trader's case study: trading the market's "wrong expectations". This trade centered on a textbook "expectation error" after a weak CPI report. While the market initially priced in broad monetary easing (sending Nasdaq to 30,060), the crucial 30-year real yield hit a 20-year high. This signaled a fractured transmission mechanism: short-term rates eased, but long-term funding costs (vital for tech valuations) refused to fall. The trader executed five short positions on the Nasdaq (NQ) as it fell from 30,060 to 28,768. The core methodology: don't just trade the data, but analyze the market's implied causal chain and identify where it breaks. In this case, the chain was: Weak CPI → Policy Easing → Lower Long-Term Funding Costs → NQ Valuation Expansion. The break occurred between policy easing and long-term rates. The "veto variable" – long-term real yields – refused to confirm the bullish narrative. Trades were structured around "fast variables" (price) temporarily repairing while "slow variables" (funding conditions) remained broken. The article outlines a repeatable framework: 1) Map the market's implied causal chain. 2) Identify the veto variable. 3) Observe if it rejects the narrative. 4) Enter when price still follows the old script. 5) Choose the cleanest asset expression (e.g., short NQ, not broad S&P). 6) Define both invalidation and fulfillment exit conditions. The key insight: Alpha often comes not from an information edge, but from a "reaction function edge" – recognizing when the market is applying an outdated causal logic to new data. The critical question: What causal chain is the market's first reaction relying on, and is that chain still valid today?

marsbitHace 1 hora(s)

Senior Trader's Confession: How to Trade Market's False Expectations?

marsbitHace 1 hora(s)

Trading

Spot
活动图片