Why can’t Ethereum hold $3K? ETH recovery in doubt as data tilts bearish

cointelegraphPublicado a 2025-12-16Actualizado a 2025-12-16

Resumen

Ether (ETH) has been struggling to hold above the $3,000 level, facing resistance and declining momentum. Key factors contributing to this bearish pressure include a lack of demand in futures markets, aggressive selling by long-term holders, and reduced on-chain activity. The 50-day EMA at $3,260 is acting as a major resistance level, while support lies around $2,800. If this support breaks, technical analysis suggests a potential drop to $2,300 or lower. Additionally, Ethereum network fees have decreased significantly, reflecting weaker demand. Without a strong break above key resistance levels, ETH’s recovery remains uncertain, with further downside risk.

Ether (ETH) has oscillated around $3,000 for the past three weeks, a consolidation period following its flash crash to $2,620 on Nov. 21. Ether traders are now questioning the likelihood of a further correction if support at $2,800 is lost.

Key takeaways:

  • Ether slid below $3,000 again due to a lack of futures demand and aggressive selling by long-term holders.

  • Declining Ethereum network fees and activity suggest lower onchain demand.

  • Weak technical setups warned of a drop to $2,300 if the next support is lost.
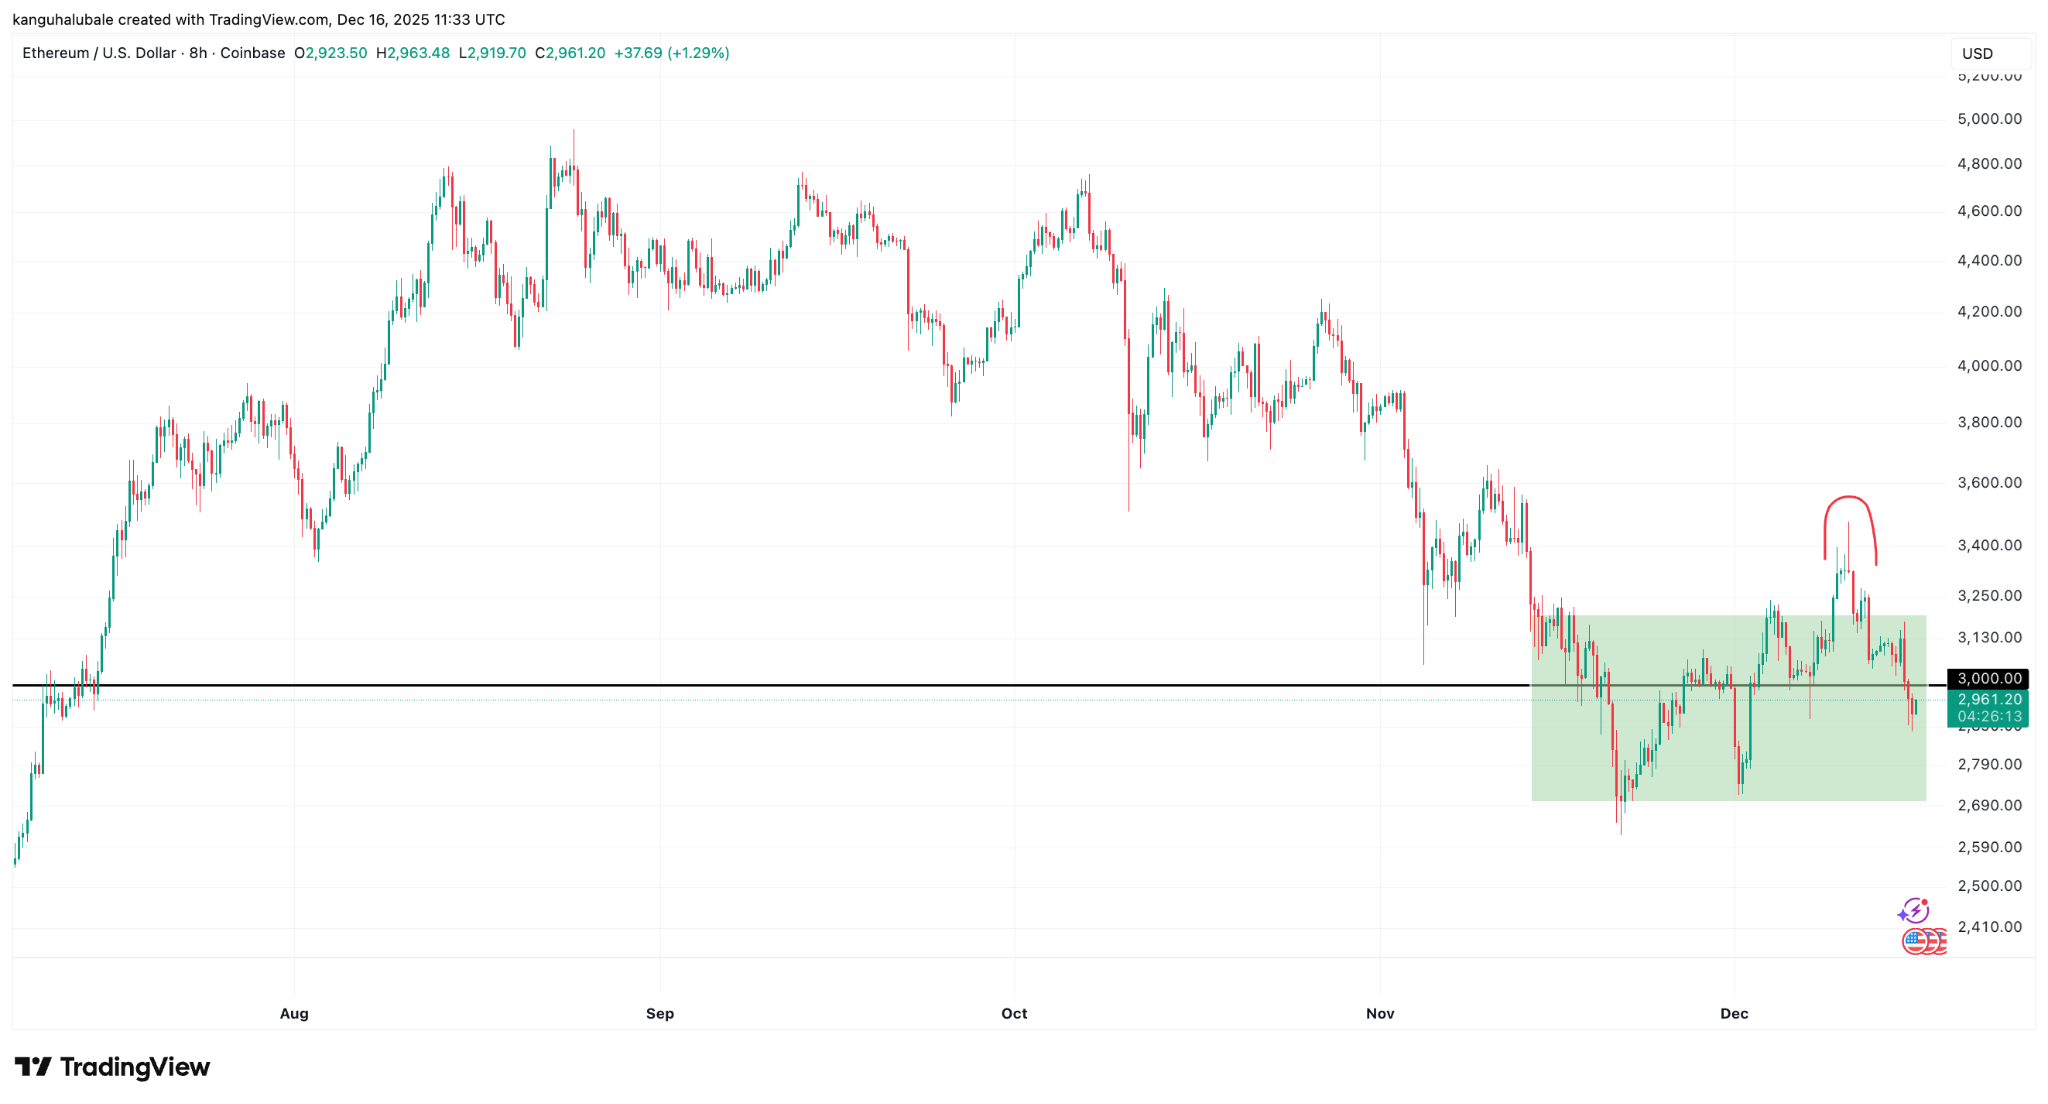
ETH/USD price chart. Source: Cointelegraph/TradingView


ETH price stuck between two trendlines

Ether’s recent recovery was rejected by resistance from the 50-day exponential moving average (EMA), which currently sits at $3,260, as shown on the daily chart below.

Related: Ether price trend forecasts triple-digit rally as ETH ETF inflows resume

This move, however, saw ETH/USD find support from the $2,800-$2,600 demand zone. The 200-week EMA is currently within this zone.
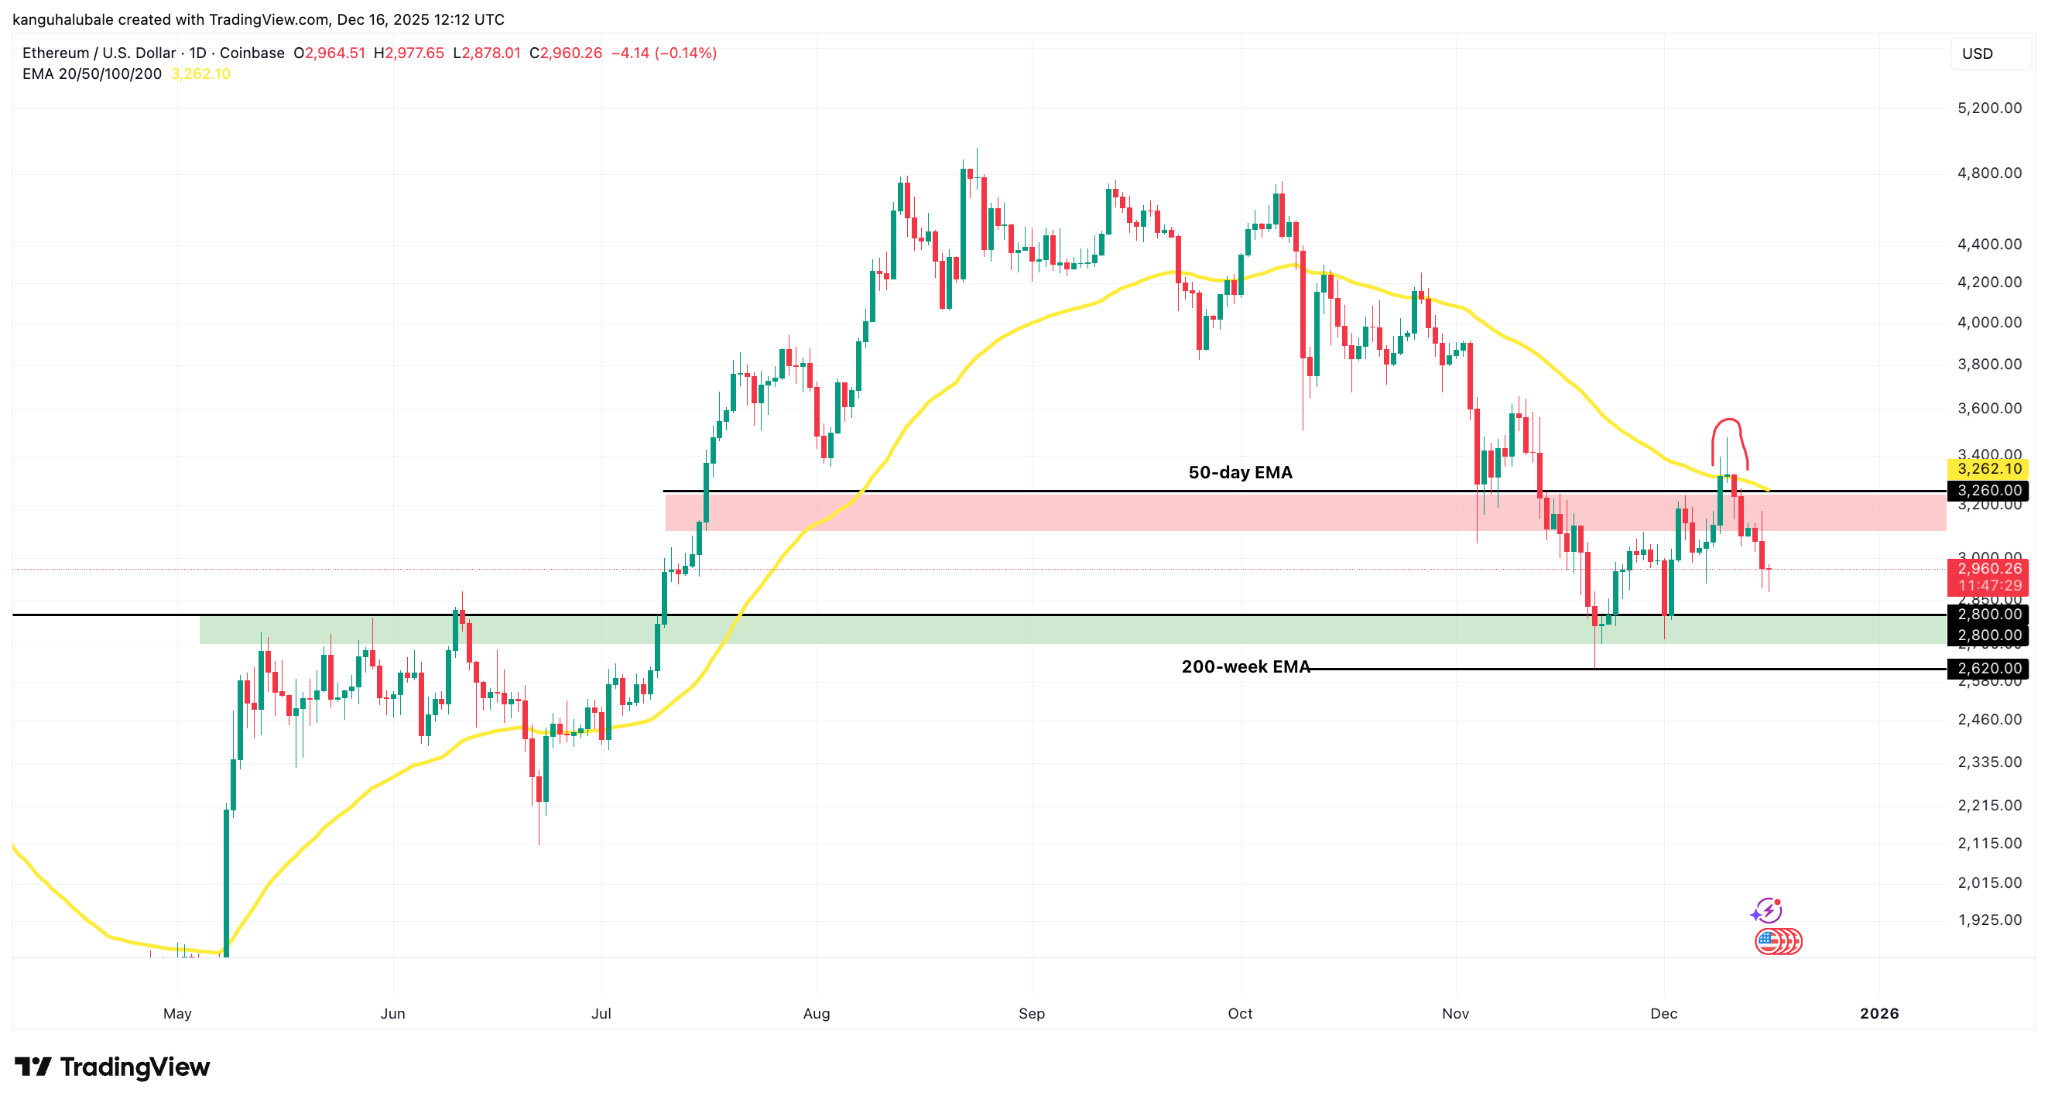
ETH/USD daily chart. Source: Cointelegraph/TradingView

ETH must rise above the resistance at $3,000 and surpass the 50-day EMA to break out of consolidation for a sustained recovery toward $4,000.

The Glassnode cost basis distribution heatmap showed resistance between $3,100 and $3,250, where investors acquired roughly 5.9 million ETH.

Ethereum: Cost basis distribution heatmap. Source: Glassnode

On the downside, the key support area is around $2,800, where 5.8 million ETH were previously purchased.

Ether price lacks bullish momentum

Ether futures are currently trading at a 3% premium relative to bearish ETH spot markets, reflecting declining demand from buyers using leverage.

In bearish market conditions, futures premiums typically stay below 5%, signaling weak demand for leveraged long positions and less optimism among traders.

More concerningly, even last week’s recovery to $3,750 did not restore sustained bullish sentiment among traders.

Ether annualized futures, three-month rolling basis. Source: Glassnode

The bearish trend in Ether futures coincided with a decline in long-term holder supply, which has decreased by 847,222 coins over the past 30 days, the largest drop since January 2021. This adds to the sell-side pressure that keeps ETH from staying above $3,000.
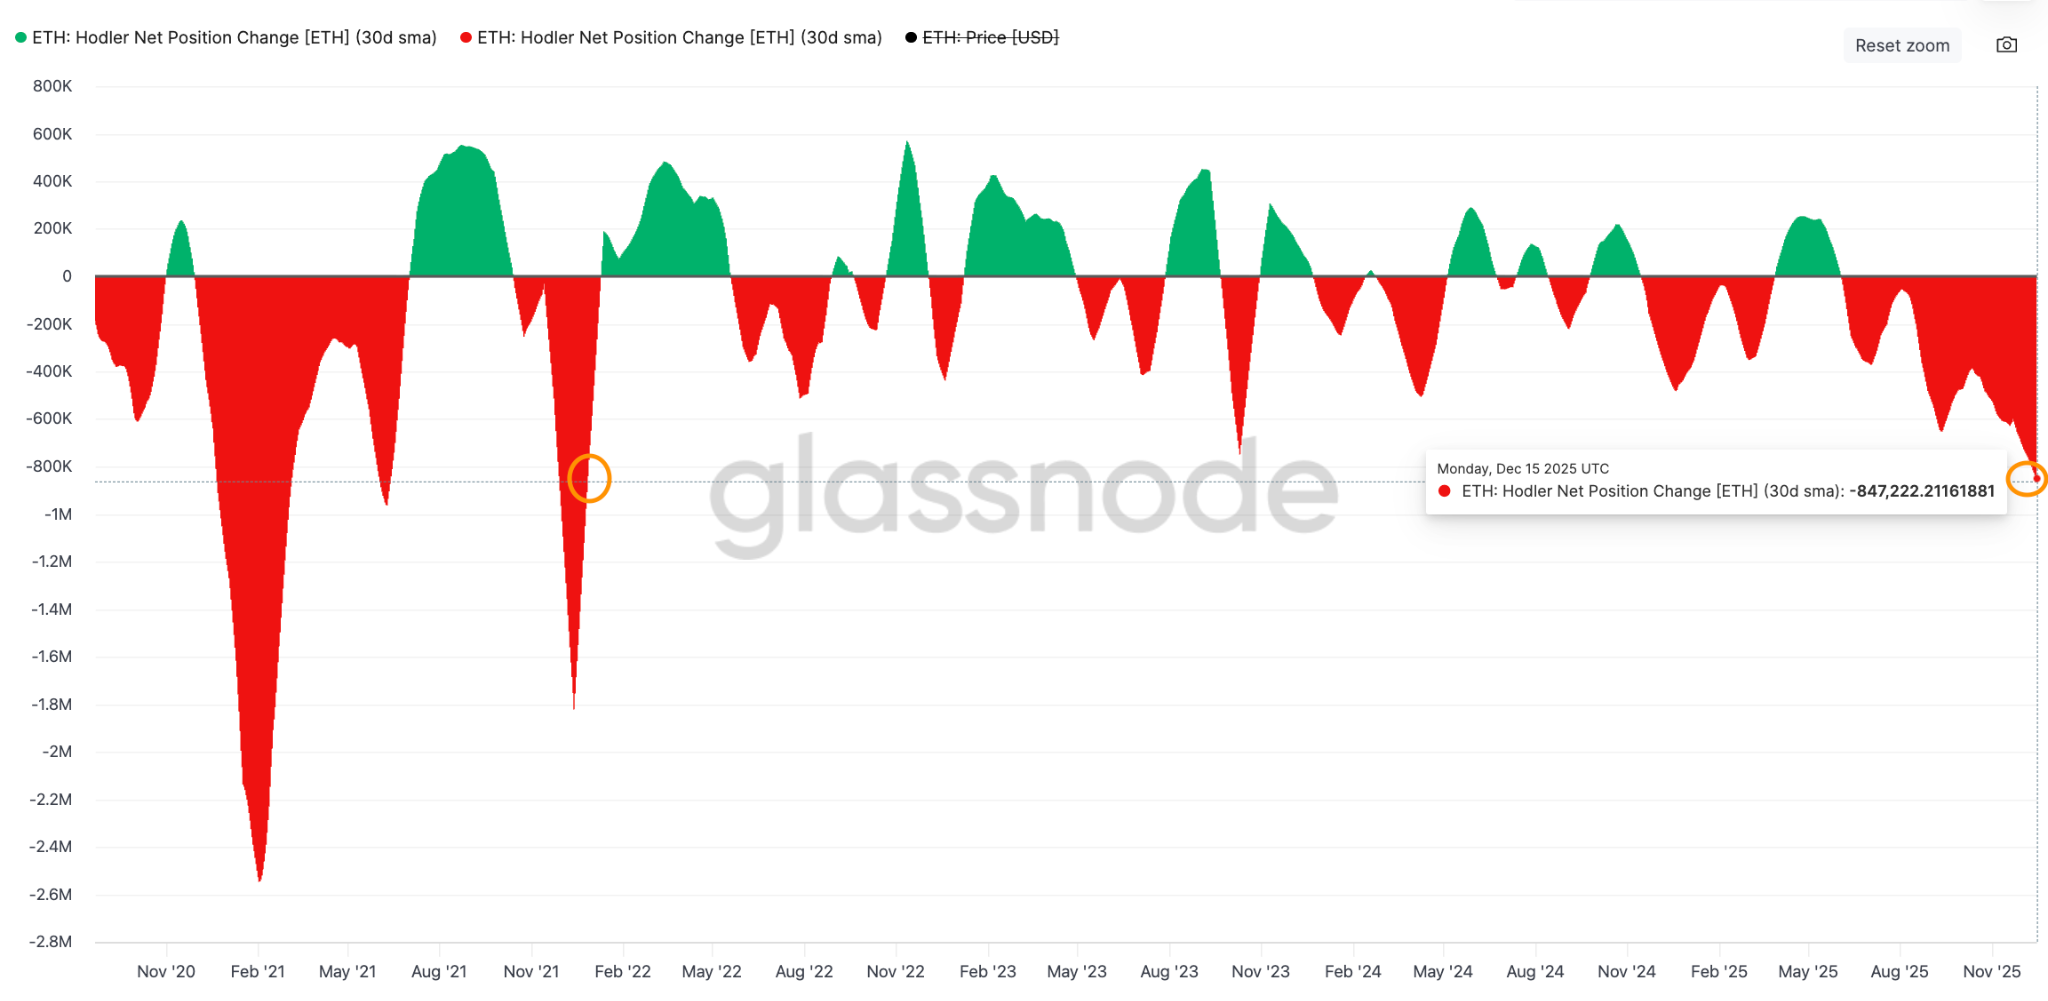
Ethereum 30-day rolling LTH supply change. Source: Glassnode

Ether’s inability to stay above $3,000 can also be attributed to the decline in Ethereum network fees, although this issue has affected the entire cryptocurrency market.
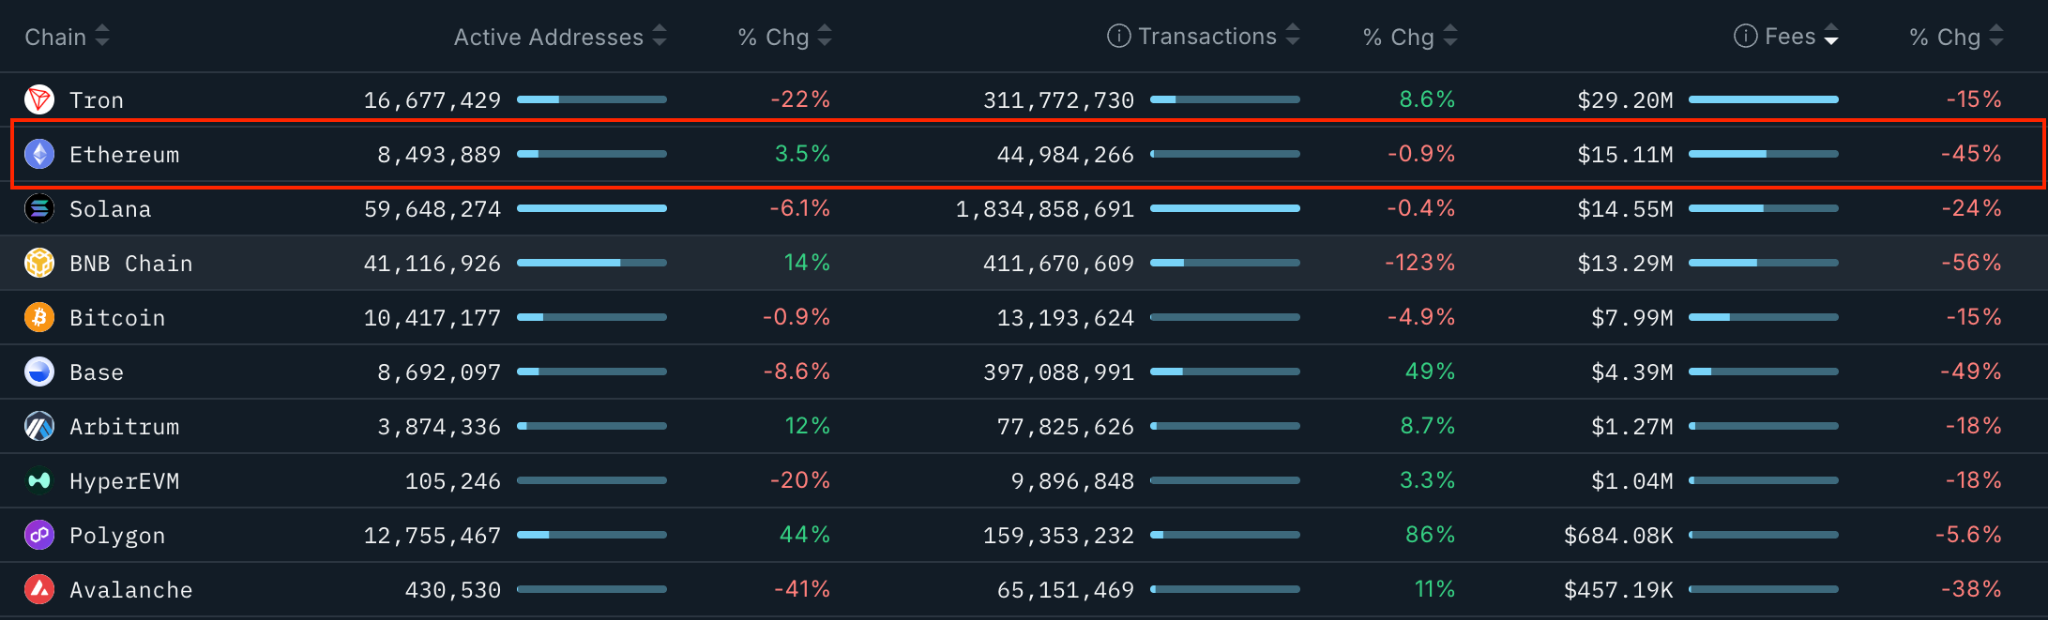
Blockchains ranked by 30-day fees, USD. Source: Nansen

Ethereum chain fees totaled $15.1 million over the past 30 days, representing a 45% decrease from the previous month. By comparison, fees on BNB Chain dropped 56%, and Tron experienced a 15% decline.

Although the number of active addresses on Ethereum’s base layer increased by 3.5% over the same period, it has decreased by 14% over the last seven days. The number of transactions is down by 11% over a seven-day period.

Ethereum bears target $2,300 ETH price

The ETH/USD pair has validated a bear flag on the daily chart after dropping below its lower boundary at $3,200, as shown below.

“Ethereum is consolidating after a sharp sell-off, forming a bear flag beneath prior support near the 3,173 to 3,250 zone,” said analyst Danny Naz in an X post on Sunday, adding:

“That area has flipped to resistance.”

The measured target of the flag is $2,300, representing a 22% drop from the current price.

ETH/USD daily chart. Source: Cointelegraph/TradingView

Zooming into the 12-hour time frame, a break and a close below the lower trendline of a megaphone pattern at $2,800 would open the way for a deeper correction toward the measured target of the pattern at $2,376.

Such a move would represent an 18% drop from the current price.
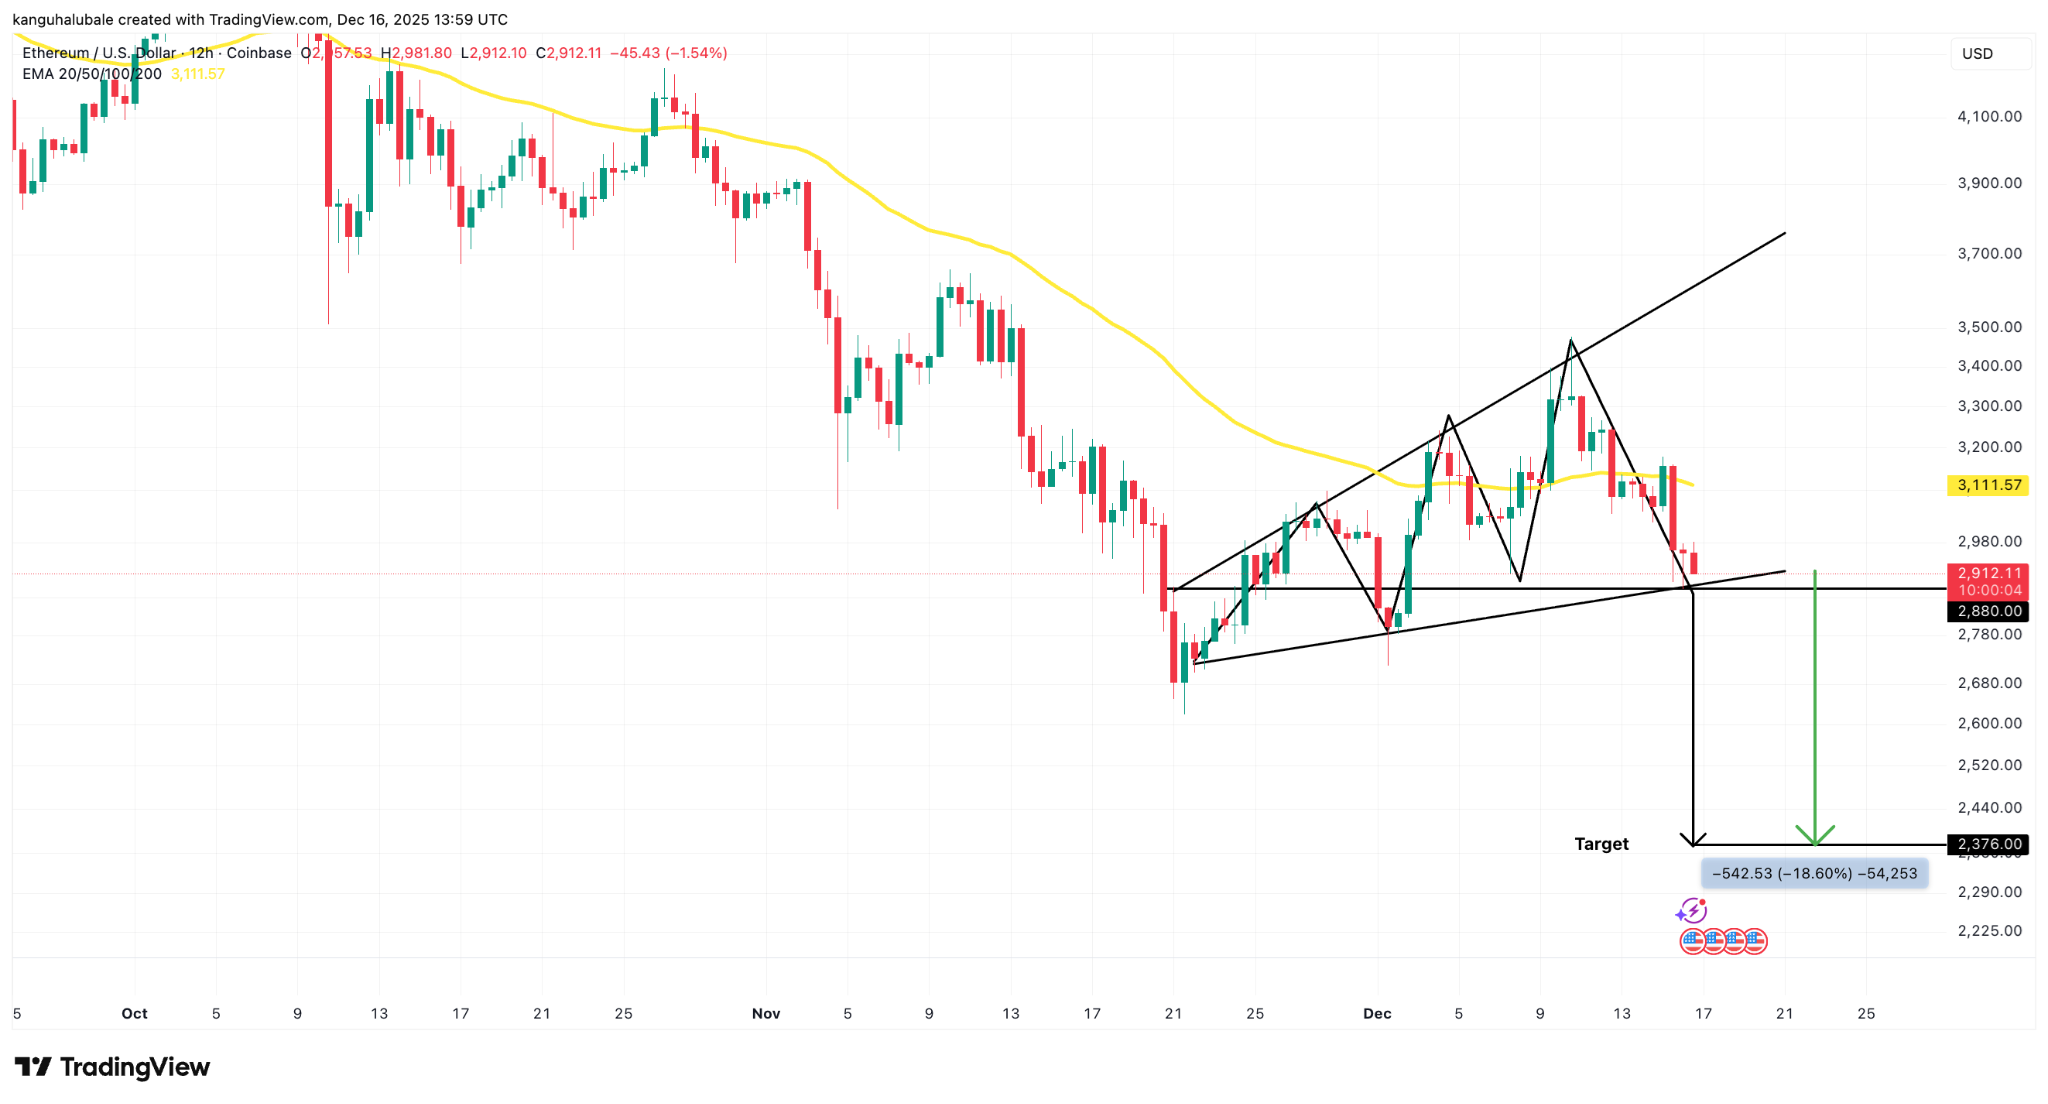
ETH/USD 12-hour chart. Source: Cointelegraph/TradingView

If this support fails and the bears manage to pull the price below $2,800, ETH price could descend to the next $2,716 to $2,623 support zone.

This article does not contain investment advice or recommendations. Every investment and trading move involves risk, and readers should conduct their own research when making a decision. While we strive to provide accurate and timely information, Cointelegraph does not guarantee the accuracy, completeness, or reliability of any information in this article. This article may contain forward-looking statements that are subject to risks and uncertainties. Cointelegraph will not be liable for any loss or damage arising from your reliance on this information.



Criptos en tendencia

Lecturas Relacionadas

Why Bitcoin Holds Above $64,000 After Fed's Hard Pause

**Bitcoin Stabilizes Near $64,000 Following Hawkish Fed Pause** The cryptocurrency market, led by Bitcoin, remained stable around $64,000 despite a volatile reaction to the latest U.S. Federal Reserve meeting. The Fed paused interest rates but signaled a hawkish stance, with three committee members voting for an increase—the highest dissent since 2016. This limits risk appetite but hasn't triggered panic selling. Key market highlights include Bitcoin ETFs seeing a net inflow of $32.1 million, breaking a streak of outflows, while Ethereum ETFs experienced outflows of $18.65 million. Liquidations affected about 90,000 traders. Technically, Bitcoin finds support around $63,000-$63,500, with major resistance near $66,000. While its price is about 49% below its all-time high, institutional demand via ETFs and the absence of mass capitulation support a potential recovery scenario in the second half of the year. Major altcoins showed mixed movements, with Solana attracting capital while Ethereum faced selling pressure despite strong on-chain metrics like a growing staking queue. Regulatory news took a pause as the U.S. Senate delayed the CLARITY Act vote until at least autumn. For the final trading day of July, U.S. inflation and consumer spending data will be crucial. Bitcoin's key levels to watch are $63,000 support and $66,000 resistance. Sustained ETF inflows and Bitcoin holding above $63,000 are seen as positive signs for a potential market recovery later in the year.

cryptonews.ruHace 13 min(s)

Why Bitcoin Holds Above $64,000 After Fed's Hard Pause

cryptonews.ruHace 13 min(s)

Participants in XRP Fraud Scheme That Stole $9 Million from 71 Investors Arrested

South Korean police have arrested three individuals accused of operating a fraudulent investment platform that stole approximately 3.4 million XRP (worth about $9 million) from 71 investors between October 16 and 23. The suspects promoted the site Fxrpntwork.com through blogs, online articles, and YouTube videos, promising guaranteed principal and monthly returns of 1.5% to 1.8%. Investors were instructed to transfer XRP from Korean exchanges to overseas platforms and then to wallets controlled by the group before the site was shut down. The scammers copied the branding of legitimate projects Flare Network and FXRP to appear credible. Authorities warn that such impersonation frauds, which use familiar branding and urgent promises of guaranteed profits, are a common red flag. Legitimate companies do not solicit cryptocurrency transfers through unsolicited promotions. Seoul police have issued an Interpol Red Notice for a fourth suspect abroad and are investigating others involved in creating and promoting the fraudulent website. While investigators froze 17.3 billion won in assets, approximately 10 billion won was moved during the probe, with wallet analysis revealing transfers totaling 27.3 billion won, suggesting there may be additional unidentified victims and accomplices. The case underscores the organized, cross-border nature of crypto investment fraud.

cryptonews.ruHace 15 min(s)

Participants in XRP Fraud Scheme That Stole $9 Million from 71 Investors Arrested

cryptonews.ruHace 15 min(s)

Trading

Spot

Artículos destacados

Cómo comprar T

¡Bienvenido a HTX.com! Hemos hecho que comprar Threshold Network Token (T) sea simple y conveniente. Sigue nuestra guía paso a paso para iniciar tu viaje de criptos.Paso 1: crea tu cuenta HTXUtiliza tu correo electrónico o número de teléfono para registrarte y obtener una cuenta gratuita en HTX. Experimenta un proceso de registro sin complicaciones y desbloquea todas las funciones.Obtener mi cuentaPaso 2: ve a Comprar cripto y elige tu método de pagoTarjeta de crédito/débito: usa tu Visa o Mastercard para comprar Threshold Network Token (T) al instante.Saldo: utiliza fondos del saldo de tu cuenta HTX para tradear sin problemas.Terceros: hemos agregado métodos de pago populares como Google Pay y Apple Pay para mejorar la comodidad.P2P: tradear directamente con otros usuarios en HTX.Over-the-Counter (OTC): ofrecemos servicios personalizados y tipos de cambio competitivos para los traders.Paso 3: guarda tu Threshold Network Token (T)Después de comprar tu Threshold Network Token (T), guárdalo en tu cuenta HTX. Alternativamente, puedes enviarlo a otro lugar mediante transferencia blockchain o utilizarlo para tradear otras criptomonedas.Paso 4: tradear Threshold Network Token (T)Tradear fácilmente con Threshold Network Token (T) en HTX's mercado spot. Simplemente accede a tu cuenta, selecciona tu par de trading, ejecuta tus trades y monitorea en tiempo real. Ofrecemos una experiencia fácil de usar tanto para principiantes como para traders experimentados.

742 Vistas totalesPublicado en 2024.12.10Actualizado en 2026.06.02

Cómo comprar T

Discusiones

Bienvenido a la comunidad de HTX. Aquí puedes mantenerte informado sobre los últimos desarrollos de la plataforma y acceder a análisis profesionales del mercado. A continuación se presentan las opiniones de los usuarios sobre el precio de T (T).

活动图片