Why Bitcoin's Rally Halted: Glassnode's Analysis of the Liquidity Trap

cryptonews.ruPublicado a 2026-09-03Actualizado a 2026-09-03

Resumen

Bitcoin's rally, sparked by a major short squeeze on August 19, stalled at the $83,000–$86,000 resistance zone before pulling back to $76,000. This halt occurred alongside a renewed rise in U.S. Treasury yields, as reported by Glassnode. The market cleared significant short leverage during the squeeze, but the upward momentum encountered heavy selling pressure above $80,000. Price is now caught between key levels: substantial long liquidation clusters below ($60k–$63k) and untouched short liquidation clusters above ($83k–$86k). Furthermore, the supply in profit has increased since May, creating a larger pool of potential sellers near previous highs. Despite continued capital inflows into U.S. spot Bitcoin ETFs, secondary trading volume remains subdued. The macro backdrop tightened rapidly as 10-year Treasury yields rebounded to 4.8%, reasserting downward pressure. Options market activity shows short-term excitement cooling post-squeeze, though structural demand for longer-term options persists. A significant quarter-end options expiration worth ~$14 billion is due on September 25. Notably, the Fed's policy decision on September 16, just days before this expiration, could sharply shift bond yield trajectories. The convergence of these two volatility catalysts within one week presents a rare challenge for market positioning.

The bitcoin rally triggered by the August 19 short squeeze halted at the $83,000–86,000 resistance zone, after which the price pulled back to $76,000 against the backdrop of renewed strength in US Treasury yields, according to the latest report from Glassnode.
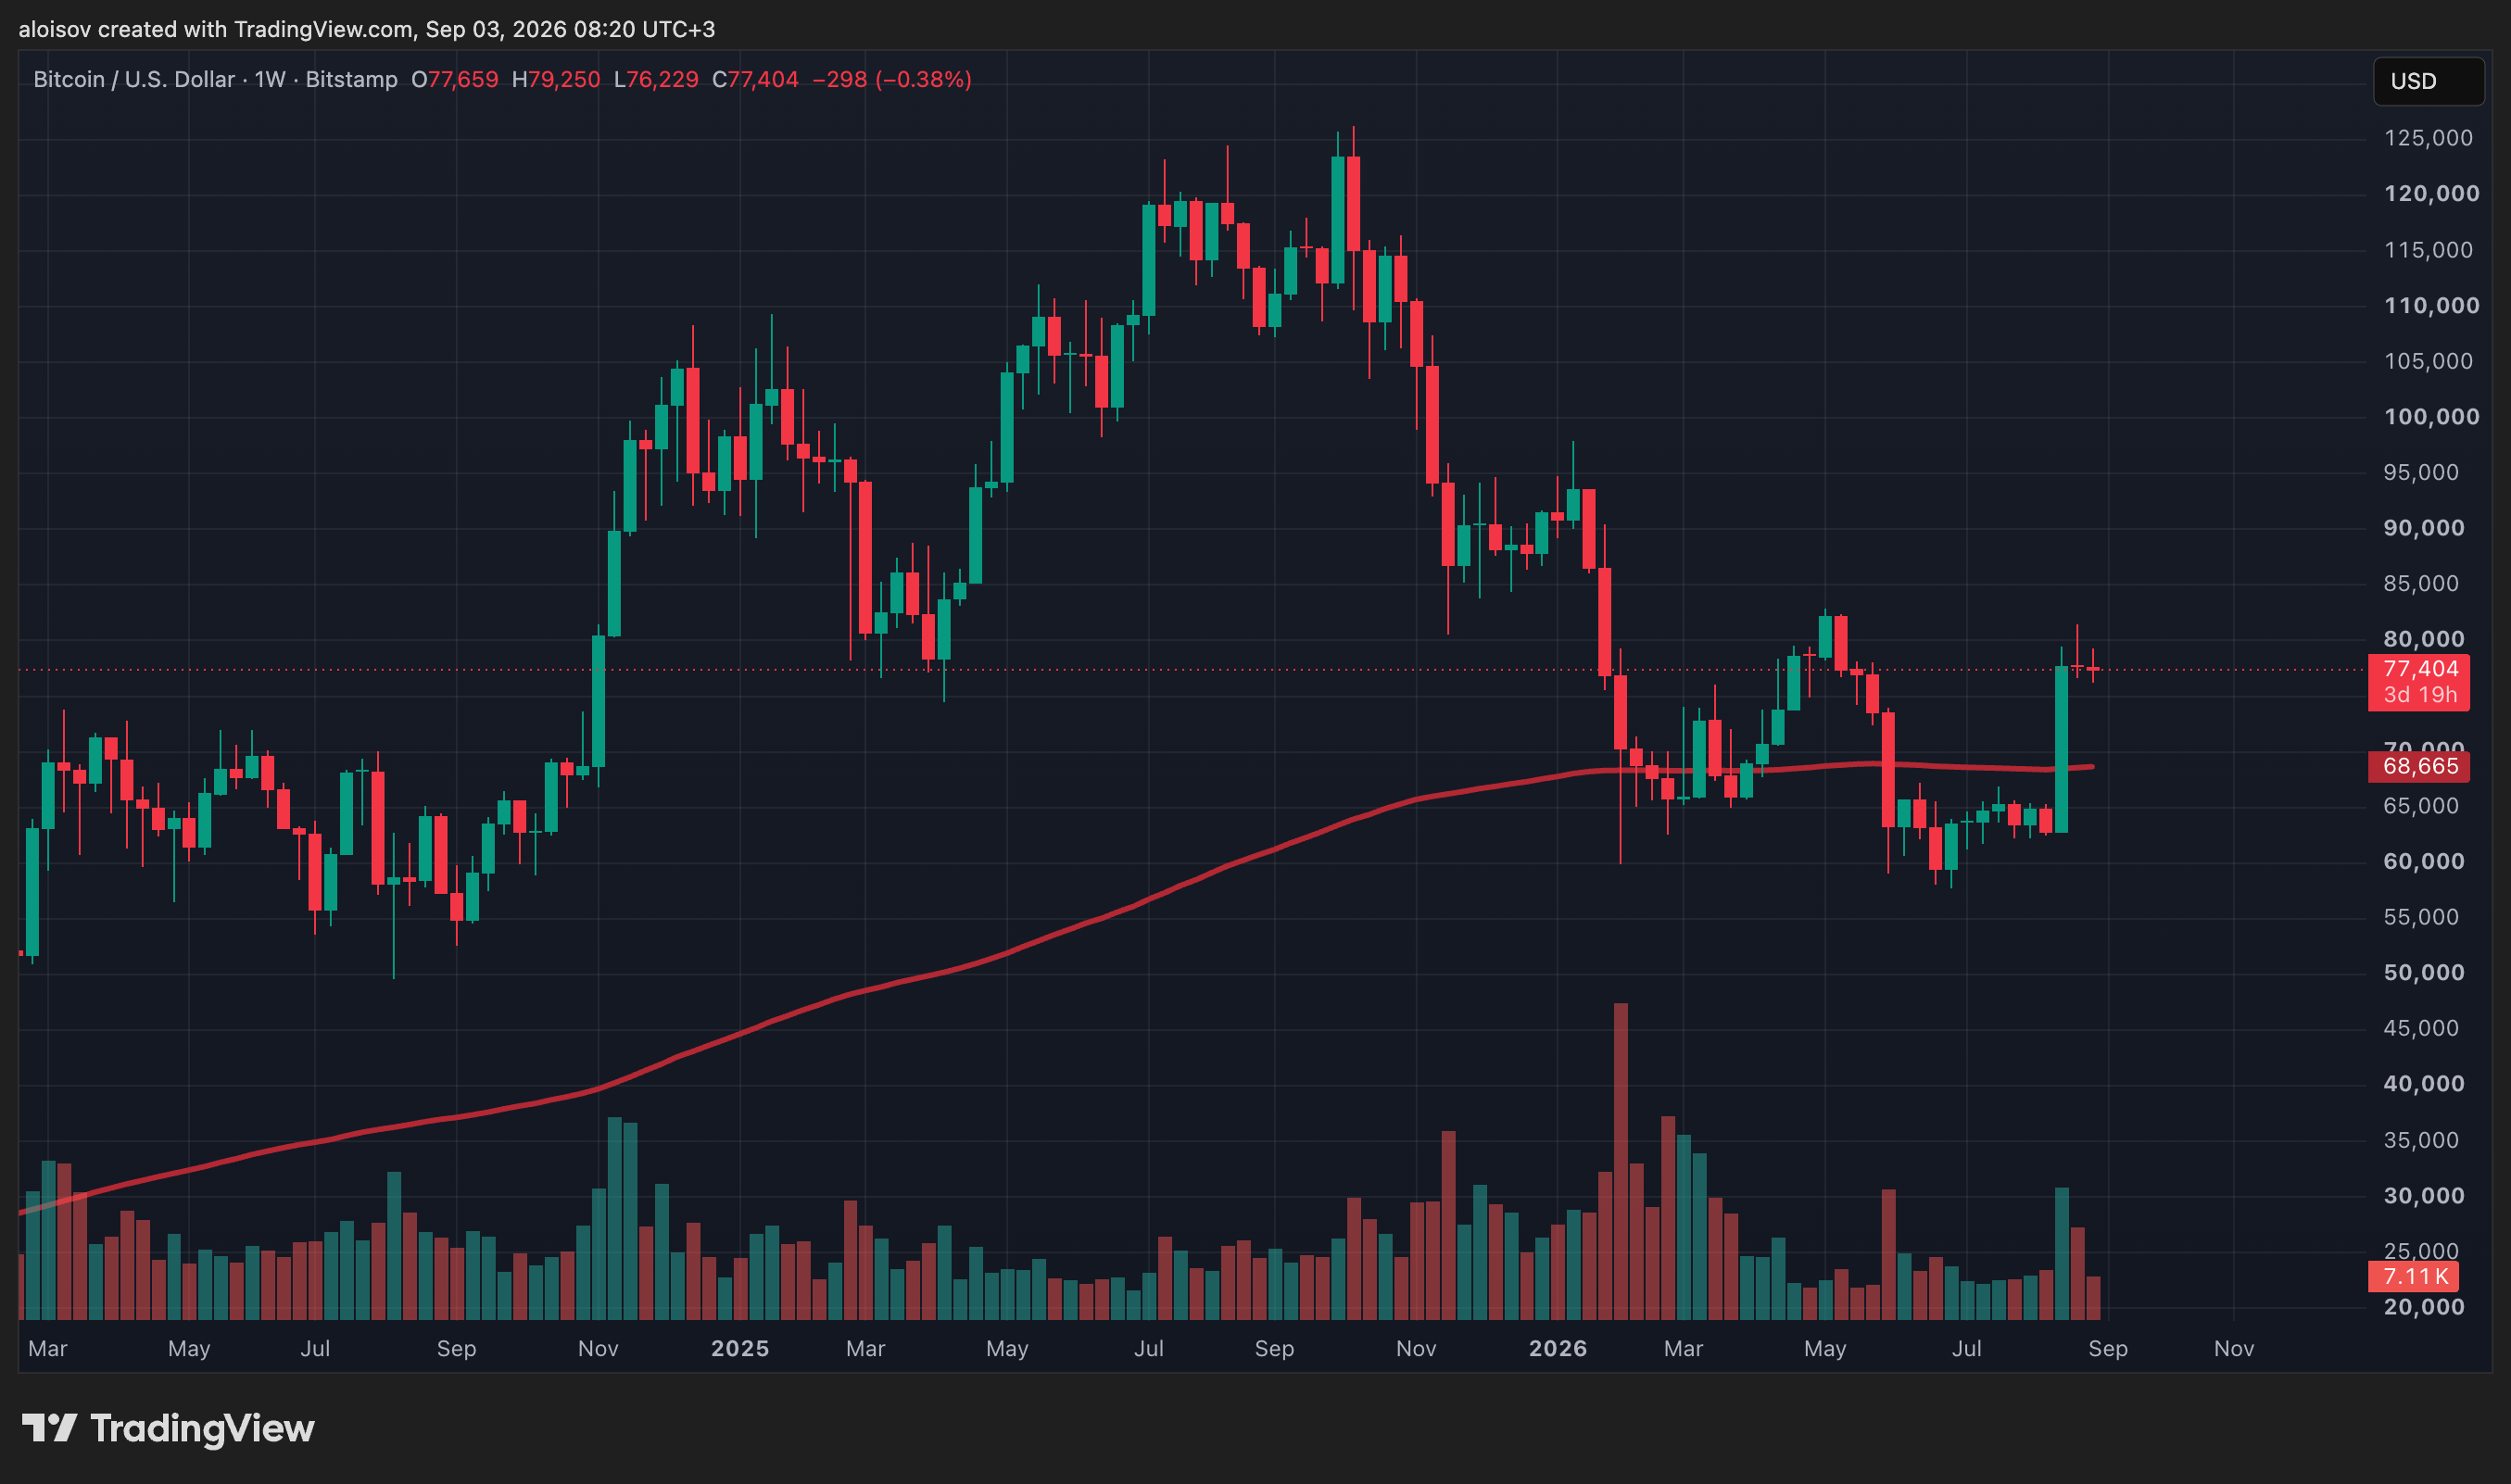
1-week chart of BTC/USD and 200EMA. Source: Bitstamp

The Rebound Hit a Dense Supply Zone

On August 19, the market experienced its largest wave of short position liquidations since 2019, which cleared a significant portion of leverage. The momentum pushed the price above $80,000 by August 27. However, above that level, bitcoin encountered dense selling pressure and reversed downwards to $76,000, triggering a series of long position liquidations.

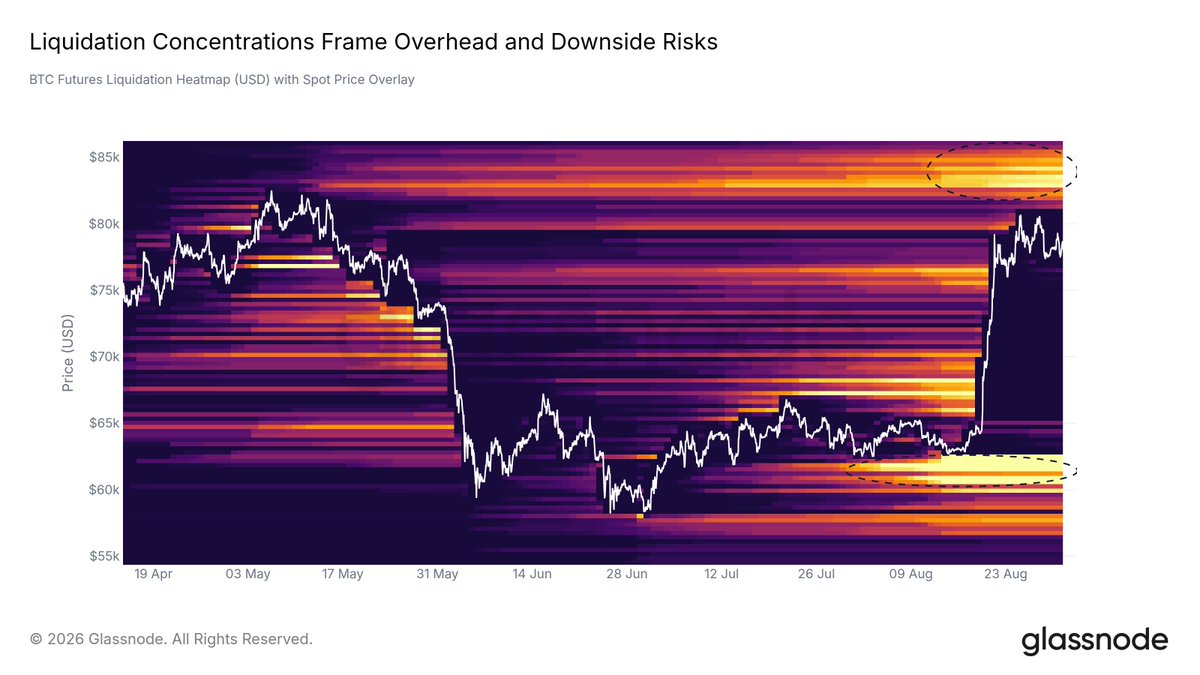
The futures market liquidation heatmap shows a symmetrical structure around the current price:

  • The upward impulse liquidated short positions but did not reach the dense cluster of short liquidations between $83,000 and $86,000;

  • Below spot, a volume of long liquidations between $60,000 and $63,000 remains untouched.

The price is currently trading within this corridor.
The Overhang of Profitability Has Increased

Additional pressure on the recovery is created by the distribution of on-chain profitability. In May, when bitcoin traded around $78,000, approximately 65% of the supply was in profit. When the price returned to the same level in late August, the share had increased to 68%.

This shift is related to the summer accumulation of coins, which raised the cost basis of short-term holders to around $71,000. At the same nominal price, a larger volume of coins is now in profit—meaning that upon retesting previous highs, a larger reserve of potential selling supply forms.

Range Boundaries

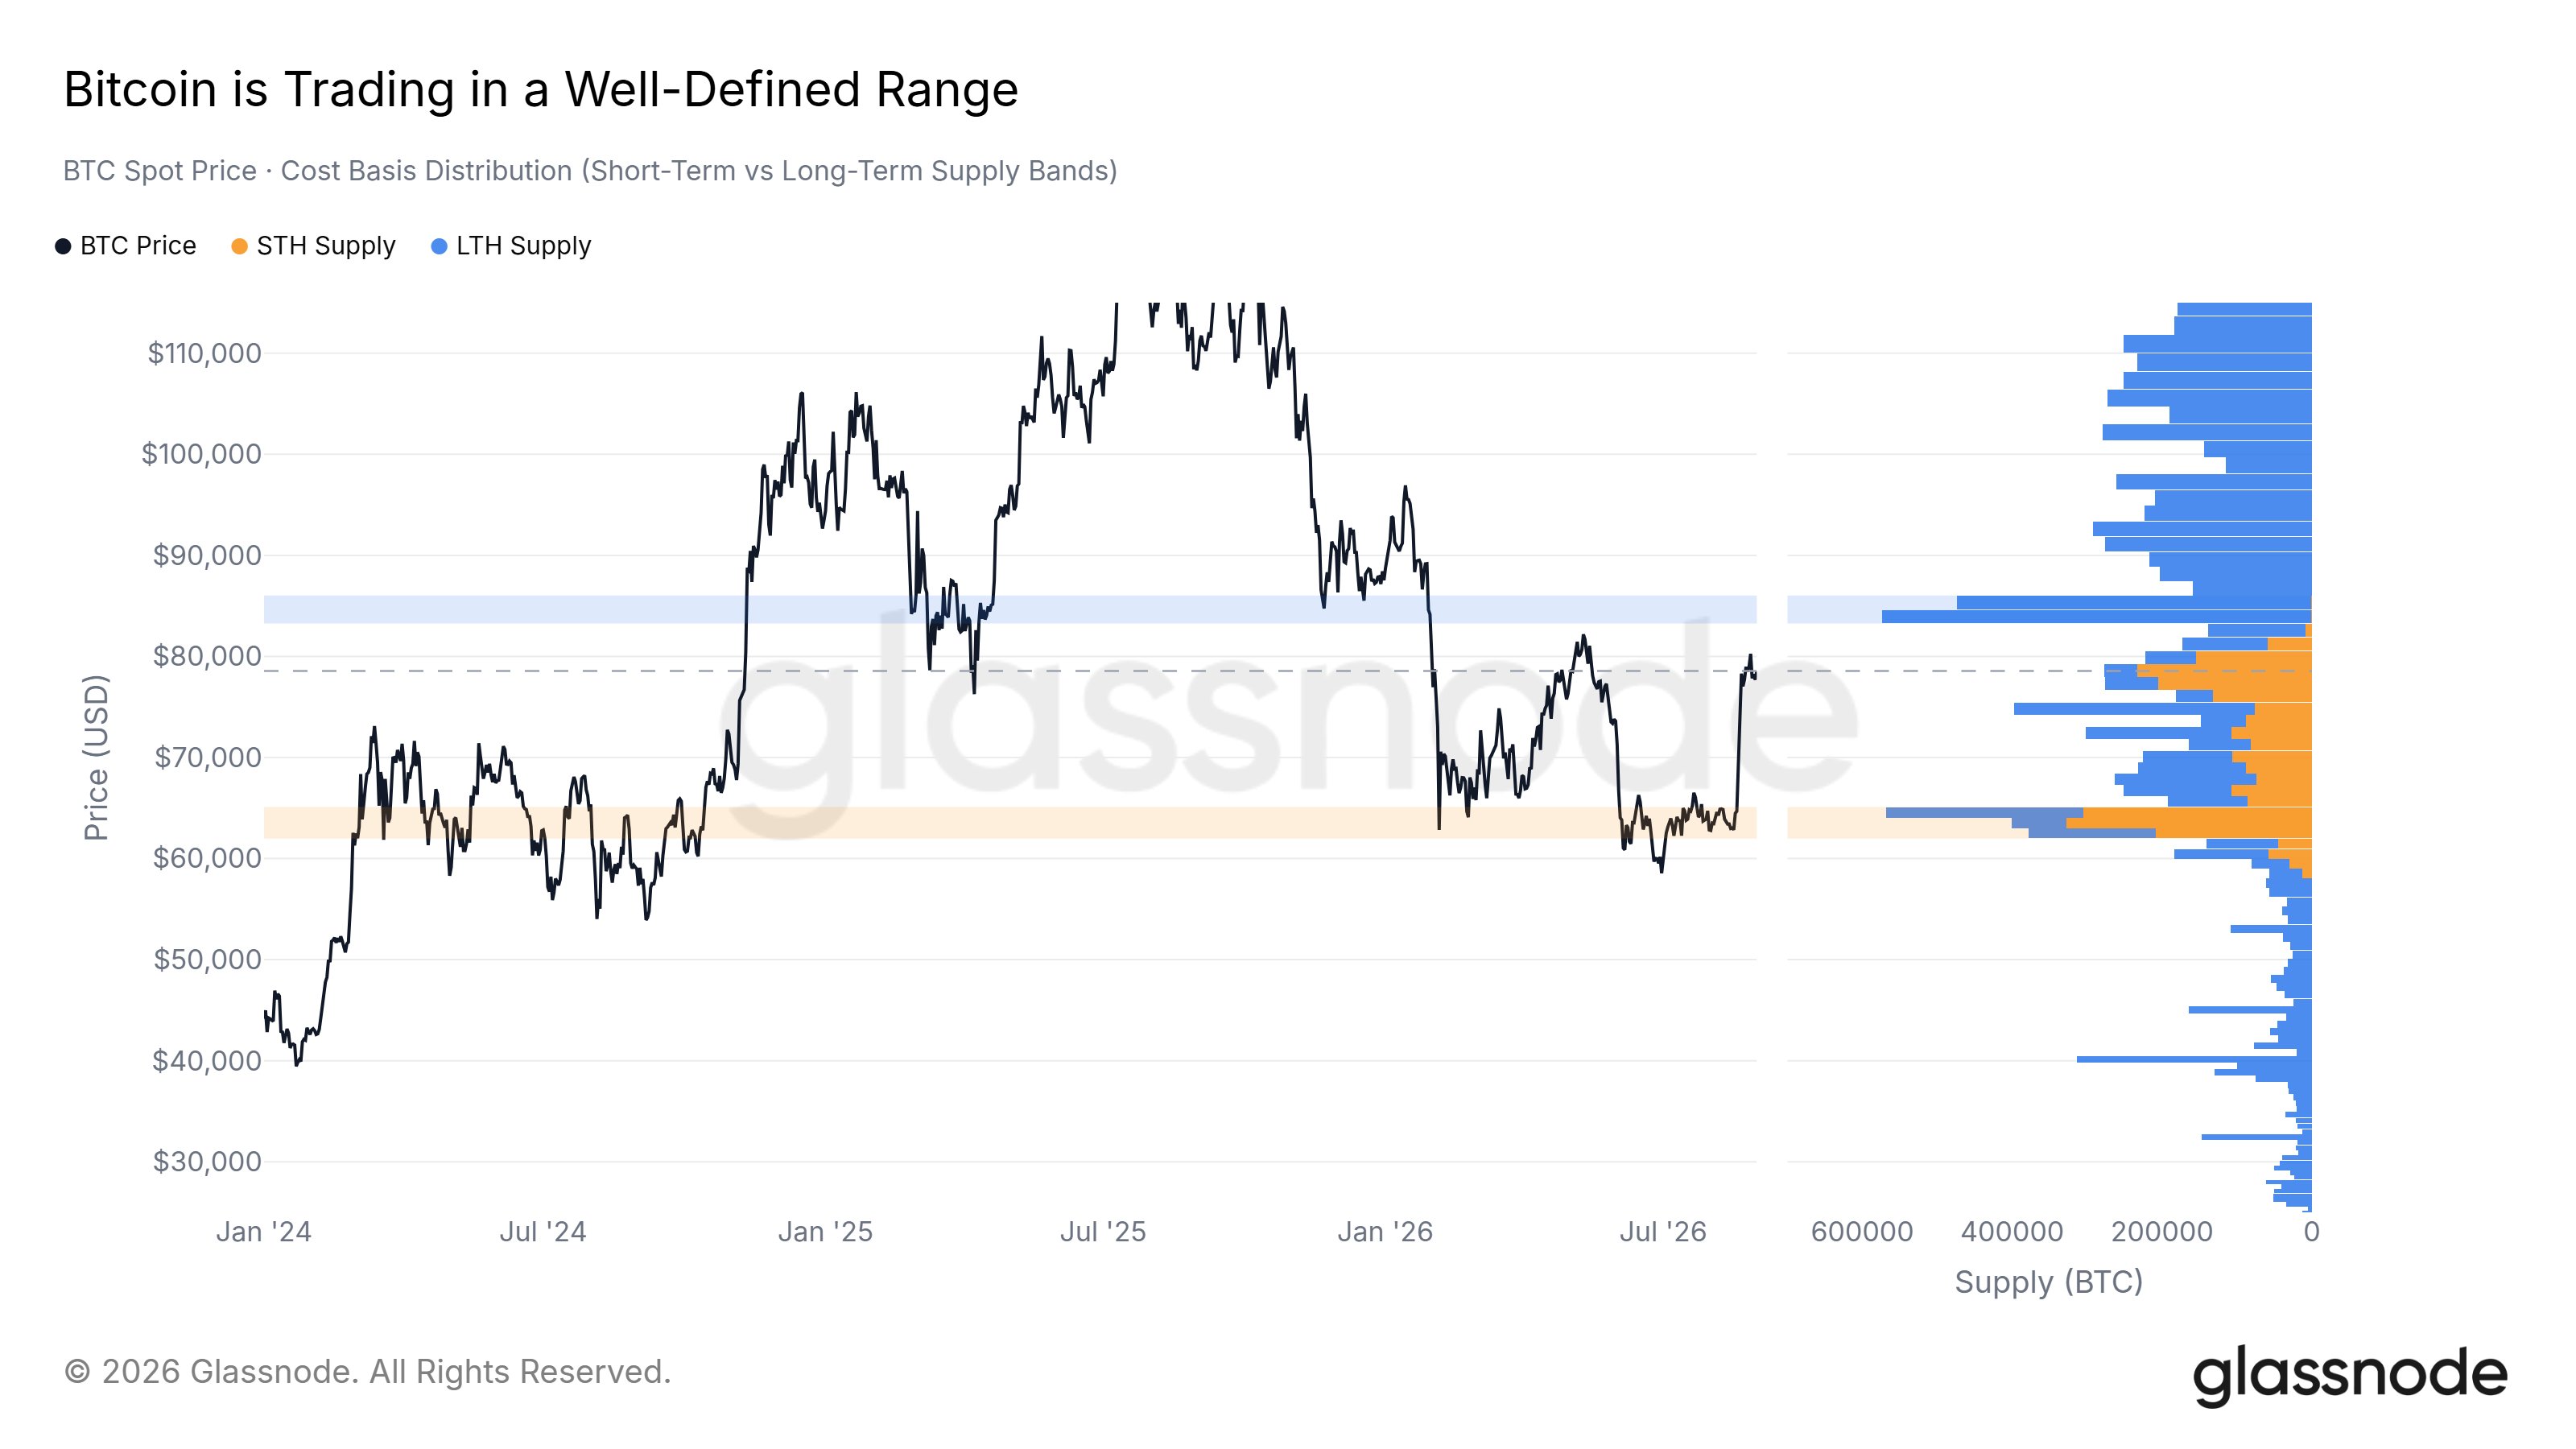
Combining cost basis models with the distribution of coins among holders sets clear structural boundaries:

  • Below — the dense accumulation zone of the summer consolidation between $62,000 and $65,000, acting as support;

  • Above — the large supply volume from long-term holders between $83,000 and $86,000, capping the upside.

For now, the price remains squeezed between these levels.
Capital Inflows into ETFs Exist, But Activity Does Not

US spot bitcoin ETFs continued to see capital inflows throughout the rally: the seven-day average inflow increased to $290 million per day. However, secondary trading activity tells a different story—trading volumes held around $3 billion per day, noticeably lower than during previous market expansion phases. Capital inflows triggered by isolated news catalysts without sustained momentum often coincide with local reversals, after which the move rolls back.

Government Bond Yields Pull the Market Down

The macroeconomic backdrop quickly returned to a restrictive state. After the announcement of the US Treasury bond buyback program on August 19, the yield on ten-year notes temporarily fell to 4.6%. But over the next eight trading sessions, it returned to 4.8%, marking a new cycle high. Such a rapid reversal indicates that pressure from government debt remains the primary factor driving global discount rates.

During the initial impulse, bitcoin briefly decoupled from traditional equity markets, which were trading virtually flat at the time: the 30-day rolling correlation with the S&P 500 index fell towards zero. Historically, sharp decouplings against the backdrop of bond market sell-offs have been short-lived phenomena, marking local exhaustion of momentum rather than a structural regime change.

Options Cool Down After the Frenzy

Dynamics in the options market reflect the rapid shift in sentiment. The seven-day 25-delta skew spiked sharply during the short squeeze amid a chase for call options, then quickly returned to neutral values once resistance held the price. Meanwhile, the 180-day skew remained stable throughout the entire move—short-term frenzy has cooled, but structural demand for long-term optionality persists.

An additional factor for the market remains the quarterly options expiration on September 25—this accounts for about $14 billion in open interest on exchanges like Deribit and IBIT, with a significant portion of positions concentrated above $80,000. The approaching expiration creates a significant volatility and positioning anchor for the coming weeks.

AI Opinion

From the perspective of macroeconomic linkages, it's worth noting the Fed meeting calendar, which the author did not mention in the article. The Federal Reserve will hold its next FOMC meeting on September 16—exactly nine days before the quarterly $14 billion options expiration mentioned in the text. The rate decision will be announced at 9:00 PM Moscow time, and it has the potential to sharply shift the trajectory of ten-year bond yields, which are currently keeping bitcoin within its current corridor. The coincidence of two volatility catalysts within one week is rare for the crypto market: typically, options expirations and regulatory decisions are spaced out over time, allowing the market to digest each event separately. This time, participants will have to factor in two scenarios simultaneously in their positioning.

Whether we should expect increased amplitude of moves in mid-September, or if the market has already priced in both factors into the current consolidation, will be revealed in the coming couple of weeks.

end-content

Preguntas relacionadas

QAccording to the Glassnode report, why did Bitcoin's rally halt between $83,000 and $86,000?

AThe rally halted because the price met a dense zone of supply from long-term holders between $83,000 and $86,000, which acted as a significant resistance level.

QWhat happened on August 19th that initially fueled the Bitcoin rally?

AOn August 19th, the market experienced its largest wave of short position liquidations since 2019, which cleared out significant leverage and provided the initial impulse for the rally above $80,000.

QWhat two key price levels define the current trading range for Bitcoin, as mentioned in the article?

AThe lower boundary is the accumulation zone from the summer consolidation between $62,000 and $65,000, which acts as support. The upper boundary is the supply zone from long-term holders between $83,000 and $86,000, which acts as resistance.

QHow does the report describe the activity in US spot Bitcoin ETFs despite capital inflows?

AWhile US spot Bitcoin ETFs continued to receive capital inflows (average $290M/day), secondary trading activity remained relatively low at around $3B per day, which is significantly below the levels seen during previous market expansion phases.

QWhat are the two upcoming volatility catalysts mentioned in the AI opinion section of the article?

AThe two catalysts are: 1) The Federal Reserve's interest rate decision on September 16th, and 2) The quarterly options expiration with approximately $14B in open interest, which occurs on September 25th. Their close timing within one week is noted as unusual.

Lecturas Relacionadas

Founders Fund Leads $5 Million Token Purchase of ANVL: What Exactly is This "Non-Lending" DeFi Protocol Doing?

On October 6th, Founders Fund, led by Peter Thiel, invested $5 million to purchase ANVL tokens from the DeFi protocol Anvil's treasury. The round included participation from Pantera Capital and others, alongside angel investors like Compound founder Robert Leshner. Anvil is not a lending protocol. Instead, users lock assets like ETH or USDC into its vault to generate a verifiable on-chain "Letter of Credit" (LOC). This LOC acts as an economic guarantee, proving the user has sufficient locked collateral to back financial commitments, without borrowing funds. The protocol applies this mechanism to use cases like payment guarantees for merchants (via integration with Flexa) and enabling instant deposits for traders on exchanges like Bullish. Anvil's economic model is unique: it charges zero protocol fees. Its native token, ANVL, derives value solely from governance rights over parameters like supported collateral types. The total supply is 100 billion tokens. Despite an 83% price surge on the investment news, ANVL remains down approximately 89% from its all-time high. The protocol's Total Value Locked (TVL) has also fallen about 87% from its peak of ~$109 million in July 2025 to around $14 million currently. The investment represents a strategic bet that on-chain credit guarantees could become a significant category. Key factors to watch include the rate of real enterprise adoption through Anvil's SDK, the long-term sustainability of its zero-fee model, and the broader migration of traditional trade finance needs to blockchain infrastructure.

marsbitHace 22 min(s)

Founders Fund Leads $5 Million Token Purchase of ANVL: What Exactly is This "Non-Lending" DeFi Protocol Doing?

marsbitHace 22 min(s)

Mathematical Explosion: OpenAI Overnight Solves 722 Math Problems, Quasi-Riemann Hypothesis Proven

OpenAI has stunned the global mathematics and AI communities by releasing a GitHub repository containing 722 manuscripts addressing 372 previously unresolved major mathematical problem families, all reportedly generated by an unreleased internal AI model. The announcement, made without prior peer review, has provoked both excitement and alarm among mathematicians. The most notable breakthrough claims to be a proof of a "quasi-Riemann Hypothesis," establishing a zero-free region for Dirichlet L-functions with real part greater than 7/8 and eliminating the Landau-Siegel zeros—a significant leap in analytic number theory. The work has reportedly undergone formal verification using Lean. Other highlighted results include: unconditionally proving the NP-hardness of the basic semidefinite programming (SDP) threshold for approximation algorithms, based solely on P ≠ NP and circumventing the Unique Games Conjecture; proving the rational Hodge conjecture for abelian varieties with complex multiplication (CM); and resolving both the symmetric and asymmetric Mahler conjectures in convex geometry. According to OpenAI, most proofs were generated automatically by the model, with an average "thinking" time of just three hours per problem. This unprecedented scale and speed have sparked intense debate about the future of human mathematicians. While some express fear about the concentration of intellectual power, others see it as the dawn of a new era of discovery driven by AI. The mathematical world is now tasked with scrutinizing these claims, which, if verified, would represent historic milestones.

marsbitHace 55 min(s)

Mathematical Explosion: OpenAI Overnight Solves 722 Math Problems, Quasi-Riemann Hypothesis Proven

marsbitHace 55 min(s)

As Midterm Elections Approach, the Real Trade in U.S. Stocks Isn't About Who Wins

With the US midterm elections approaching in early November, political uncertainty has re-emenrged as a market variable. While market participants are weighing potential shifts in congressional control and policy direction, historical data suggests midterm elections themselves are not a definitive negative catalyst for US equities. Since 1937, the S&P 500 has averaged a positive gain of 9.2% in midterm election years, though this lags behind the 13.3% average for non-election years. A more consistent historical pattern is increased market volatility and a tendency for stronger performance concentrated in the fourth quarter, as political uncertainty is resolved. The article, citing analysis from J.P. Morgan and Capital Group, argues that the market's primary concern is policy path uncertainty rather than which party wins. This uncertainty tends to depress markets in the run-up to the vote, with a potential rebound afterward as the political risk premium dissipates. However, the article cautions against attributing market performance solely to the election. Recent midterm years like 2018 and 2022 saw significant market declines primarily driven by factors like Federal Reserve tightening and inflation, not the election outcome itself. The core argument is that the midterm election's impact on markets is often secondary to more fundamental drivers. Regardless of whether the result is a unified or divided government, the market's longer-term trajectory has historically been determined by underlying economic conditions. For the current environment, the key variables to watch post-election are not political labels but the path of interest rates, corporate earnings trends, and whether any actual policy changes materially alter cash flow expectations for businesses. The election may influence sentiment and policy expectations, but the sustainability of any year-end rally will ultimately depend on these core fundamentals of profitability, rates, and economic data.

marsbitHace 1 hora(s)

As Midterm Elections Approach, the Real Trade in U.S. Stocks Isn't About Who Wins

marsbitHace 1 hora(s)

AI Can't Change 'DNA': How Long Can SanDisk Stay Strong?

**AI Cannot Alter the "DNA": How Much Longer Can Western Digital's Run Last?** This analysis examines the sustainability of the current "super cycle" for NAND flash memory, driven by AI, with a focus on Western Digital (WD). The core argument is that while AI demand has fundamentally shifted NAND's role from a data warehouse to an essential component on the compute path, especially for AI inference, this does not eliminate the industry's cyclical nature. The piece first assesses the supply-demand dynamics. On the supply side, major producers are showing capital expenditure restraint for NAND, prioritizing DRAM/HBM. Capacity growth through 2028 relies heavily on technological upgrades (increasing 3D layers to 300+) and expansion primarily from China's YMTC, rather than new fabs. Global new fab capacity from players like Samsung and WD/Kioxia is concentrated post-2029. This results in estimated bit supply growth (CAGR ~24% for 2026-2028) largely driven by higher per-wafer output. Demand is undergoing a structural shift. AI-related NAND demand (for data lakes, KV cache, and staging) is forecast to grow at a 75% CAGR from 2025-2028, becoming the dominant driver. Data center demand will surpass 50% of total NAND demand in 2026. Consumer demand (PC, smartphone) is being squeezed and is expected to decline or stagnate. A key 2027 demand catalyst is NVIDIA's Rubin platform with its dedicated contextual memory storage (ICMS). The analysis concludes that a supply-demand deficit will persist into 2027. However, 2028 is identified as a potential inflection point where supply (led by YMTC's new fab) could outpace demand, ending the price rally. For Western Digital, the analysis models a more conservative path than management's guidance. It forecasts Average Selling Price (ASP) peaking in FY28 (ending June 2028) before declining in FY29-30 as the market loosens, though supported by long-term agreements (LTAs) and a higher mix of data center products. Consequently, margins and profits are expected to peak in FY28 and then contract. The valuation suggests WD's current price largely reflects a neutral scenario, with limited short-term upside unless the market becomes convinced that prices will remain stable post-2028. The fundamental takeaway is that despite AI's transformative impact, NAND's cyclical "DNA" remains intact.

marsbitHace 1 hora(s)

AI Can't Change 'DNA': How Long Can SanDisk Stay Strong?

marsbitHace 1 hora(s)

Trading

Spot
活动图片