Wall Street FOMO Rally Continues to Heat Up, How Did Four Days of Gains Surpass Three Months of Fluctuations?

marsbitPublicado a 2026-08-11Actualizado a 2026-08-11

Resumen

A FOMO-driven rally on Wall Street saw the S&P 500 surge 5.8% over four consecutive trading days ending August 4th, a move whose magnitude exceeded the index's entire high-to-low closing price range from the preceding three months. This rapid ascent, placing the four-day gain in the 99.32 percentile for the past decade, forced late entrants to chase prices higher. Despite the bullish momentum, the VIX volatility index also rose concurrently, indicating that traders were simultaneously hedging against potential downside risks. This was reflected in option markets, where short-term call skew hit a two-year high and the one-month average put/call ratio reached its most bullish level in at least four years, showcasing a rare mix of aggressive optimism and persistent caution.

After the close on August 4th, Wall Street witnessed an acceleration that was hard to ignore. The S&P 500 index had rallied 5.8% cumulatively over the four trading days ending that day. According to Reuters, the options market also showed the most bullish skew in at least four years.

The rally itself is not FOMO. What truly makes this round of market action different is how fast prices moved upward and what price the options market simultaneously placed on both upside and downside risks. On August 4th, closing data compiled by FRED also showed the stock market continuing to climb higher, while the VIX volatility index, which measures expected volatility, also closed higher. Optimism did not push volatility down alongside it.

Why Four Days Can Seem Longer Than Three Months
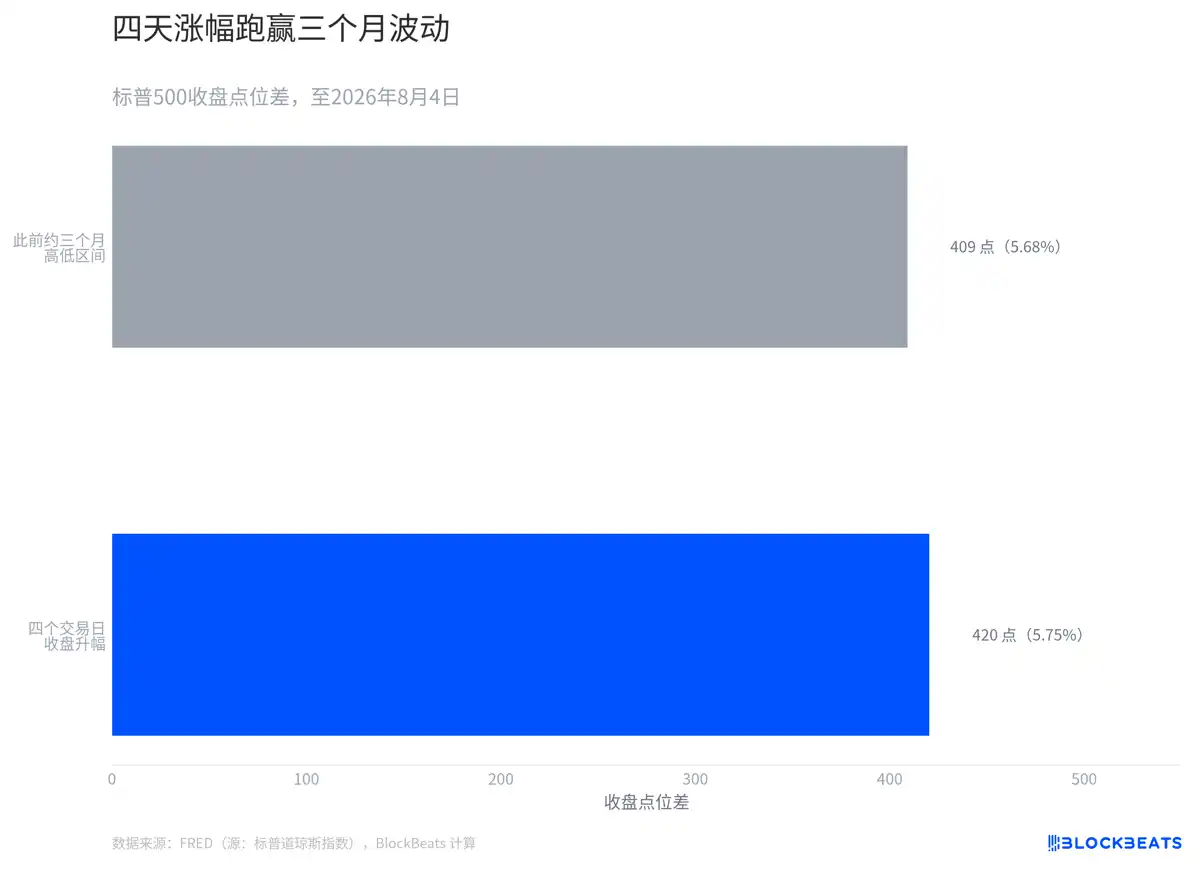
According to the S&P Dow Jones Indices daily closing data compiled by FRED, the economic database of the Federal Reserve Bank of St. Louis, this four-day upward move, measured by the same closing price metric, has slightly exceeded the point difference between the highest and lowest closing prices over the preceding approximately three months.

Placing these two changes side by side is not to equate the four-day return with the three-month high-low range as the same metric. The former indicates direction, the latter a range. They are placed on the same scale to visualize a shift in trading tempo: the closing price fluctuation band formed over months was surpassed by a one-way move over just four trading days.

The price path itself cannot prove the psychology of every participant. What it does illustrate is that four consecutive days of closing price increases rapidly raised the entry price for those joining later. Reuters characterized traders chasing into this rally as FOMO. The speed shown in the chart is precisely the aspect that allows this characterization to be tested against the price series.

How Rare Is This in the Past Decade?
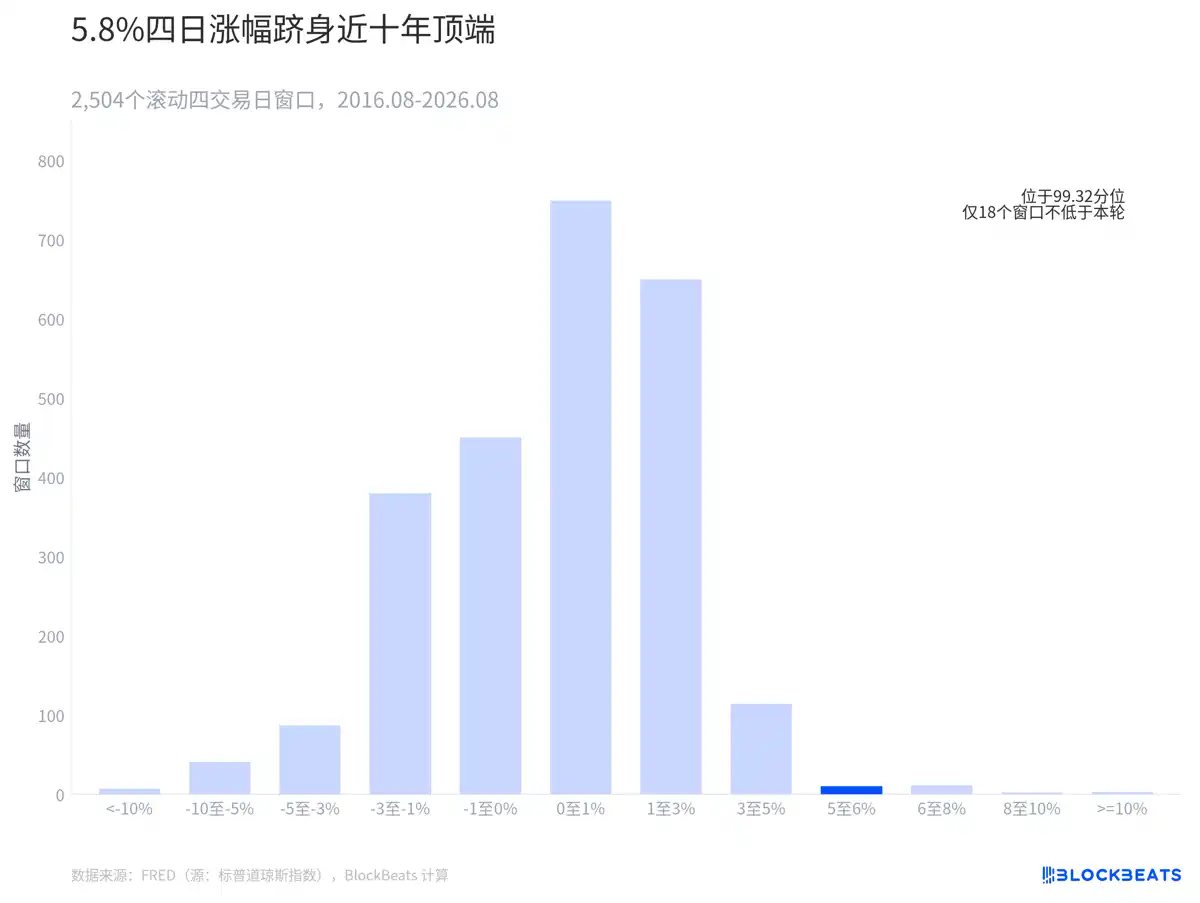
Based on a rolling calculation using nearly a decade of daily S&P 500 closing data from FRED, 2,504 four-day windows were obtained. The current rally of 5.7458% falls at the 99.32nd percentile, already in the sparse area on the far right of the chart.

Calculated from FRED data, including this round, only 18 windows have seen four-day gains at or above this level. Such a four-day magnitude is not common.

How Are Bullishness and Hedging Both Appearing in Options?
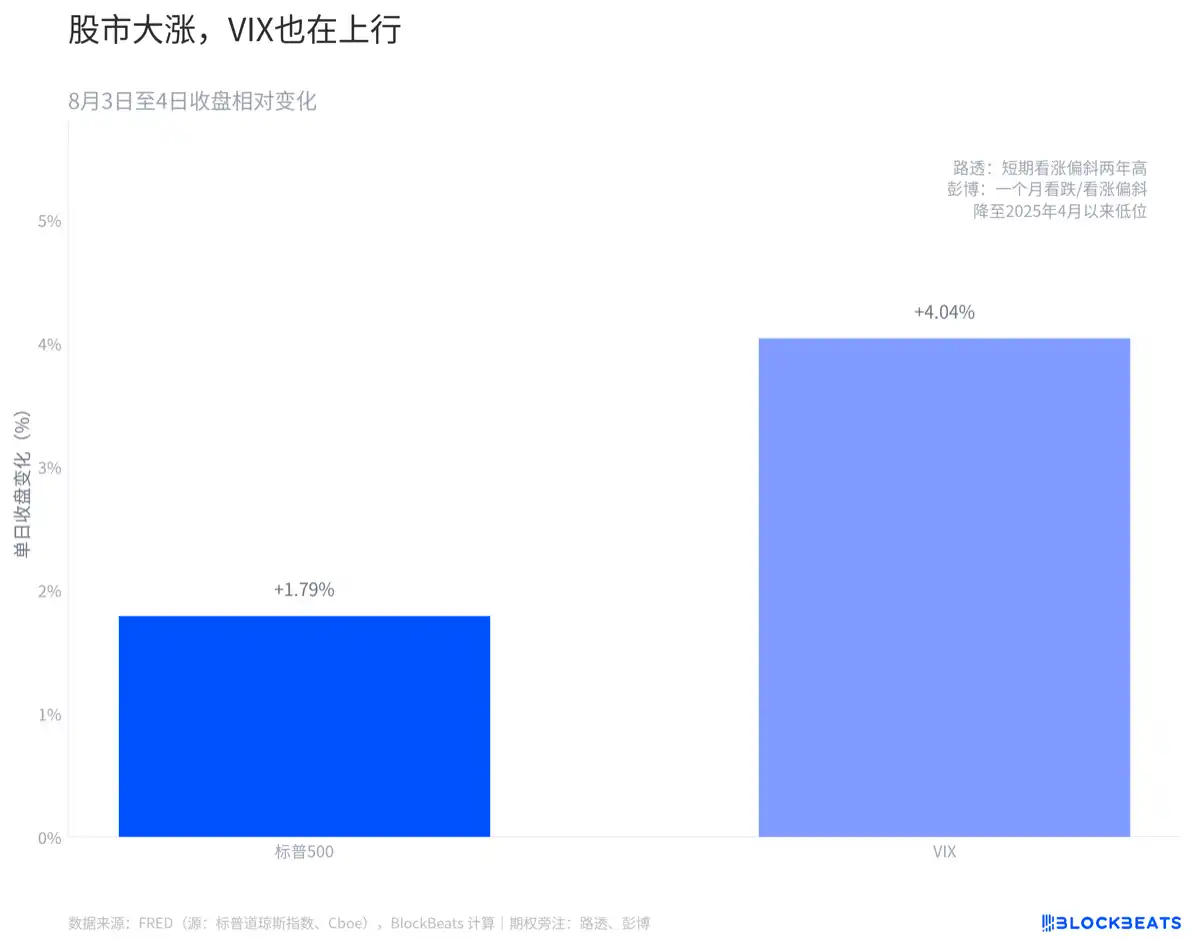
According to closing data for the S&P Dow Jones Indices and the Cboe (Chicago Board Options Exchange) compiled by FRED, the S&P 500 rose 1.79% while the VIX closed up 4.04%. The fact that both prices moved in the same direction indicates that, at least by the end of that day's trading, the market was not fully pricing down expectations for future volatility.

According to Reuters, the skew for near-term call options hit a two-year high. Data from options analytics firm Trade Alert showed the average daily S&P 500 call/put ratio for one month was 0.9, in its most bullish range in at least four years.

Preguntas relacionadas

QAccording to the article, what two contrasting phenomena occurred simultaneously in the options market during the described rally?

AThe article states that while short-term call option skew hit a two-year high and the call/put ratio indicated strong bullish sentiment (at least a four-year high), the volatility index (VIX) also rose, meaning the market did not completely price down expectations for future volatility. This shows bullishness and a demand for hedging against risk appeared together.

QWhat statistical benchmark is used in the article to show the rarity of the four-day S&P 500 gain mentioned?

AThe article uses a percentile rank based on a rolling calculation of all four-day windows over the past decade of S&P 500 closing data. The specific gain of 5.7458% ranks at the 99.32nd percentile, meaning it is higher than over 99% of similar four-day periods in the last ten years.

QHow does the article visually demonstrate that the four-day price move exceeded the prior three-month range?

AThe article includes a chart (the first image) that plots the four-day upward movement alongside the three-month high-to-low closing price range on the same scale. This visual comparison shows the four-day directional gain crossing the width of the three-month range.

QWhat specific data point from August 4th is given to illustrate that rising stock prices and rising volatility expectations can coincide?

AOn August 4th, the S&P 500 rose by 1.79%, while the VIX (a measure of expected market volatility) also rose, closing up by 4.04%. This simultaneous increase shows that optimism about prices did not suppress expectations for future price swings.

QWhat does the term FOMO refer to in the context of this market rally, and what evidence does the article link to this behavior?

AFOMO refers to 'Fear Of Missing Out,' describing traders chasing the rising market to avoid missing further gains. The article links this behavior to the evidence of the rapid, four-day price increase that quickly raised the entry price for latecomers, as well as the extremely bullish readings in the options market (e.g., high call/put ratios).

Lecturas Relacionadas

Wall Street Morning Report: Philadelphia Semiconductor Index Falls Nearly 3%, Nvidia's 'Circular Financing' Concerns Trigger Tech Stock Correction, Optical Communication and Chip Stocks Plunge

Wall Street Morning Report: The Philadelphia Semiconductor Index fell nearly 3%, and concerns over Nvidia's "revolving financing" sparked a tech stock pullback, with optical communications and chip stocks declining sharply. U.S. stocks retreated from record highs on Monday amid geopolitical tensions and AI financing doubts. The Dow fell 0.11%, the Nasdaq 0.32%, and the S&P 500 was nearly flat. Hopes for reopening the Strait of Hormuz dimmed after Trump demanded war reparations from Iran, pushing Brent crude above $87 and WTI above $82. Spot gold broke above $4400/oz. Treasury yields rose, with the market pricing in a ~54% chance of a September Fed hike. The semiconductor and AI infrastructure sectors were hit hard. The Philly Semiconductor Index dropped nearly 3%, with the semiconductor ETF down 2.28%. Optical communication was the worst-performing AI sub-sector, with Coherent plunging over 14%. The sell-off centered on Nvidia, which fell 2.86% on reports it is collaborating with major financial institutions to mobilize over $500 billion in third-party capital for AI infrastructure. Market concerns focused on whether this creates a circular financing loop and if future AI facilities can generate sufficient cash flow. Other notable moves: Intel dropped over 4% on a new share offering. Microsoft rose 1.21% on plans for its next-gen Maia 300 chip. The software sector outperformed, with Palantir up 1.85%. Energy stocks rallied nearly 4.7% on geopolitical risks. Key upcoming events include the RBA rate decision on Aug 11 and earnings from Lumentum, CoreWeave, and Super Micro Computer after the close on Aug 12, which will test the real demand for AI infrastructure.

marsbitHace 53 min(s)

Wall Street Morning Report: Philadelphia Semiconductor Index Falls Nearly 3%, Nvidia's 'Circular Financing' Concerns Trigger Tech Stock Correction, Optical Communication and Chip Stocks Plunge

marsbitHace 53 min(s)

Podcast Notes | VanEck Digital Asset Research Head: Current AI Infrastructure Rally Not a Bubble; Crypto Market Quiet Due to Institutional Disappointment in L1s

In this podcast, VanEck's Head of Digital Asset Research Matthew Sigel discusses the current market dynamics. He argues the ongoing AI infrastructure boom is not a bubble, contrasting it with the 19th-century railroad mania. Unlike railroads funded by speculative land grants and government bonds, today's AI data centers are backed by long-term private contracts and significant customer prepayments, making the investment cycle more sustainable. Sigel notes a recent market shift: companies with high capital expenditures (capex) were rewarded in early 2024 but are now being punished. Cryptocurrencies, categorized as software assets, have suffered alongside the broader software sector. His NODE ETF has outperformed Bitcoin by nearly 100 percentage points over 15 months, largely by betting on Bitcoin miners transitioning into AI data centers. He highlights the value of miners' key assets—power and land—and their new ability to fund growth through debt instead of diluting shareholders. Regarding the crypto market's weakness, Sigel points to institutional disappointment with major Layer-1 (L1) blockchains like Ethereum and Solana. Post-election rallies lacked breakout applications, and regulated entities are increasingly building their own private, permissioned chains (e.g., by Circle, Stripe, Wells Fargo), diluting the "winner-takes-all" potential of public L1s. He believes a regulatory catalyst like the CLARITY Act, which would enforce disclosure standards, could trigger a significant relief rally for some tokens, but remains cautious until then. He also views proposals by ETH, Solana, and NEAR to reduce token inflation as a positive, necessary adjustment for the maturing sector.

marsbitHace 58 min(s)

Podcast Notes | VanEck Digital Asset Research Head: Current AI Infrastructure Rally Not a Bubble; Crypto Market Quiet Due to Institutional Disappointment in L1s

marsbitHace 58 min(s)

Shenzhen Competing for 'Tsinghua Faction' Talent

Shenzhen is actively attracting Tsinghua University-affiliated technology ventures, as highlighted during the "X-Day" Xili Lake Roadshow held in Nanshan. The event featured six startup projects from Tsinghua alumni, spanning semiconductors, AI, materials, and healthcare. The showcased companies include: Zhichen Semiconductor, developing edge AI chips; Guangsu Evolution, creating AI-powered home security systems; Qingli Technology, commercializing "self-superlubricating" technology; Shu Yu Technology, offering an AI Agent for analog chip design; Heyi Intelligent Control, providing AI-driven building management systems; and Shengshengyi, applying AI to assisted reproductive medicine. These ventures represent a trend of deep-tech innovation closely linked to academic research. The roadshow series, initiated a year ago, underscores a strategic shift in Shenzhen's investment landscape. Venture capital is moving earlier into the innovation cycle, seeking projects directly from laboratories and research papers. Tsinghua University serves as a key source for such early-stage, technology-intensive startups. Over the past two years, Tsinghua alumni projects have accounted for nearly 30% of the approximately 280 billion RMB in early-stage deep-tech funding in Shenzhen. The "X-Day" platform has facilitated significant growth. To date, its 19 roadshows have connected companies with investors thousands of times, leading to over 3.3 billion RMB in equity financing for 58 firms. Past participants like Kuaiwei Intelligent (recently valued over 10 billion RMB after a Series B round) and Lingcifang (securing four funding rounds in 18 months) exemplify the successful trajectory from this ecosystem. The activity underscores Shenzhen's, particularly Nanshan District's, role in bridging academic research from institutions like Tsinghua with industrial application and venture capital.

marsbitHace 58 min(s)

Shenzhen Competing for 'Tsinghua Faction' Talent

marsbitHace 58 min(s)

Trading

Spot
活动图片