Venice Token climbs to $7 – Will VVV clear THIS supply zone?

ambcryptoPublicado a 2026-04-02Actualizado a 2026-04-02

Resumen

Venice Token (VVV) surged 14.55% to reach $7.06, supported by an 83.5% increase in trading volume to $45.42M. The price is now testing a key resistance level at $7.20, a historically significant supply zone. Technical indicators show a bullish structure with higher lows and a positive MACD crossover, suggesting potential for further upward movement. However, recent exchange inflows of $931.21K could introduce selling pressure. Short liquidations of $85.05K have reduced immediate downside pressure, but the market breakout depends on whether demand can absorb the increased supply near resistance.

Venice Token [VVV] climbed to $7.06 after a 14.55% daily gain, backed by rising participation and volume expansion.

Price approached a critical supply zone, keeping focus on whether buyers could extend the move.

Trading Volume rose 83.5% to $45.42M, reflecting stronger engagement behind the rally. However, the move neared a region that historically capped upside.

This left VVV at a key decision point, where structure and activity needed to align for continuation.

Can higher lows break resistance?

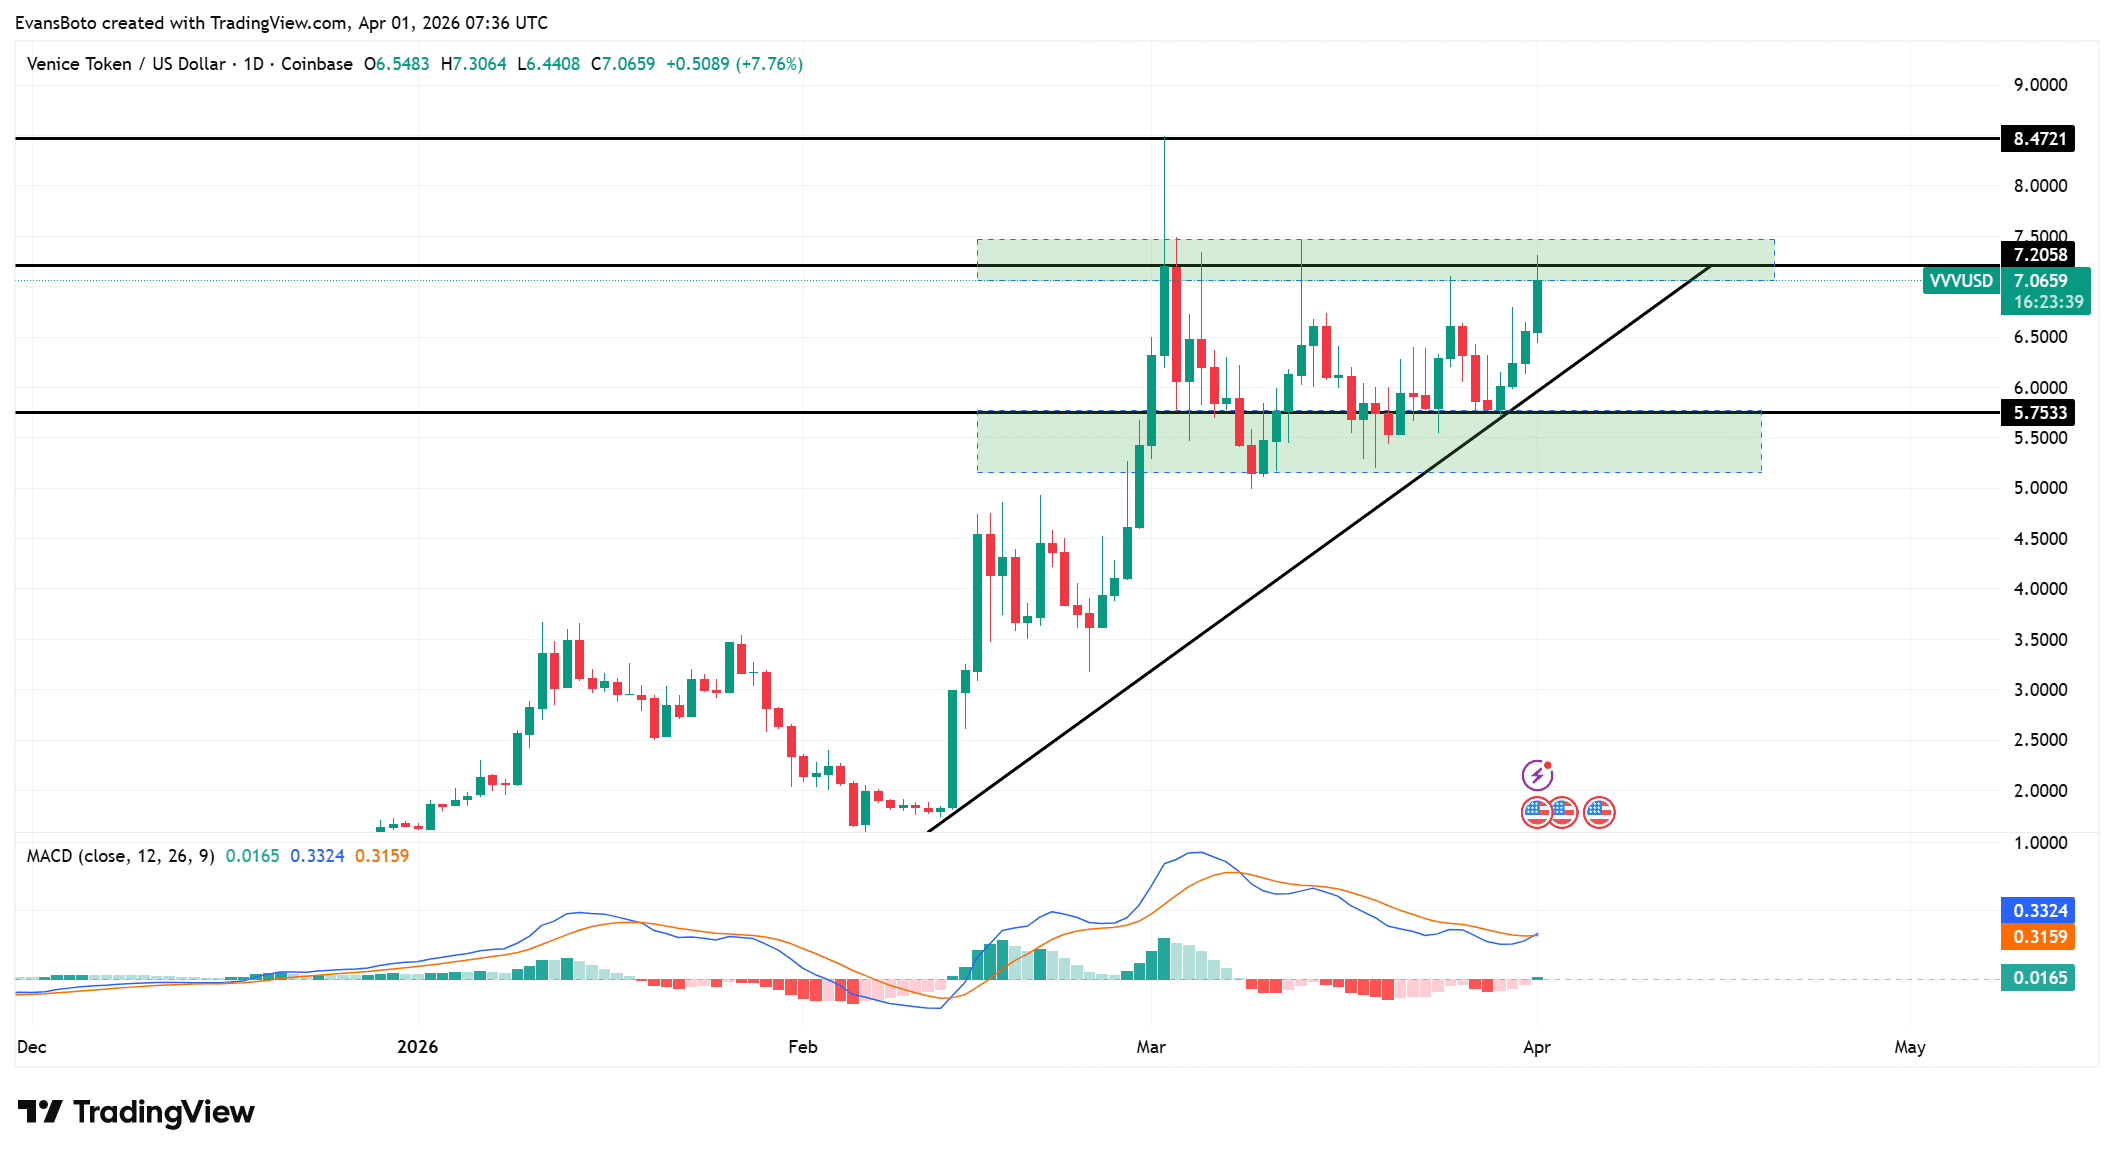
VVV formed a series of higher lows along an ascending trendline, keeping the broader structure intact.

Price compressed below the $7.20 resistance while holding above the $5.75 support. This structure showed buyers stepping in at higher levels, reinforcing upward pressure.

Even so, repeated resistance tests signaled supply remained active in this zone.

As price tightened near the upper boundary, the structure pointed toward a potential expansion. If the breakout holds, trendline support could drive continuation beyond resistance.

On top of that, MACD crossed above the signal line, with the histogram turning positive. This shift indicated strengthening bullish momentum behind the move.

Source: TradingView

Do VVV inflows signal selling pressure?

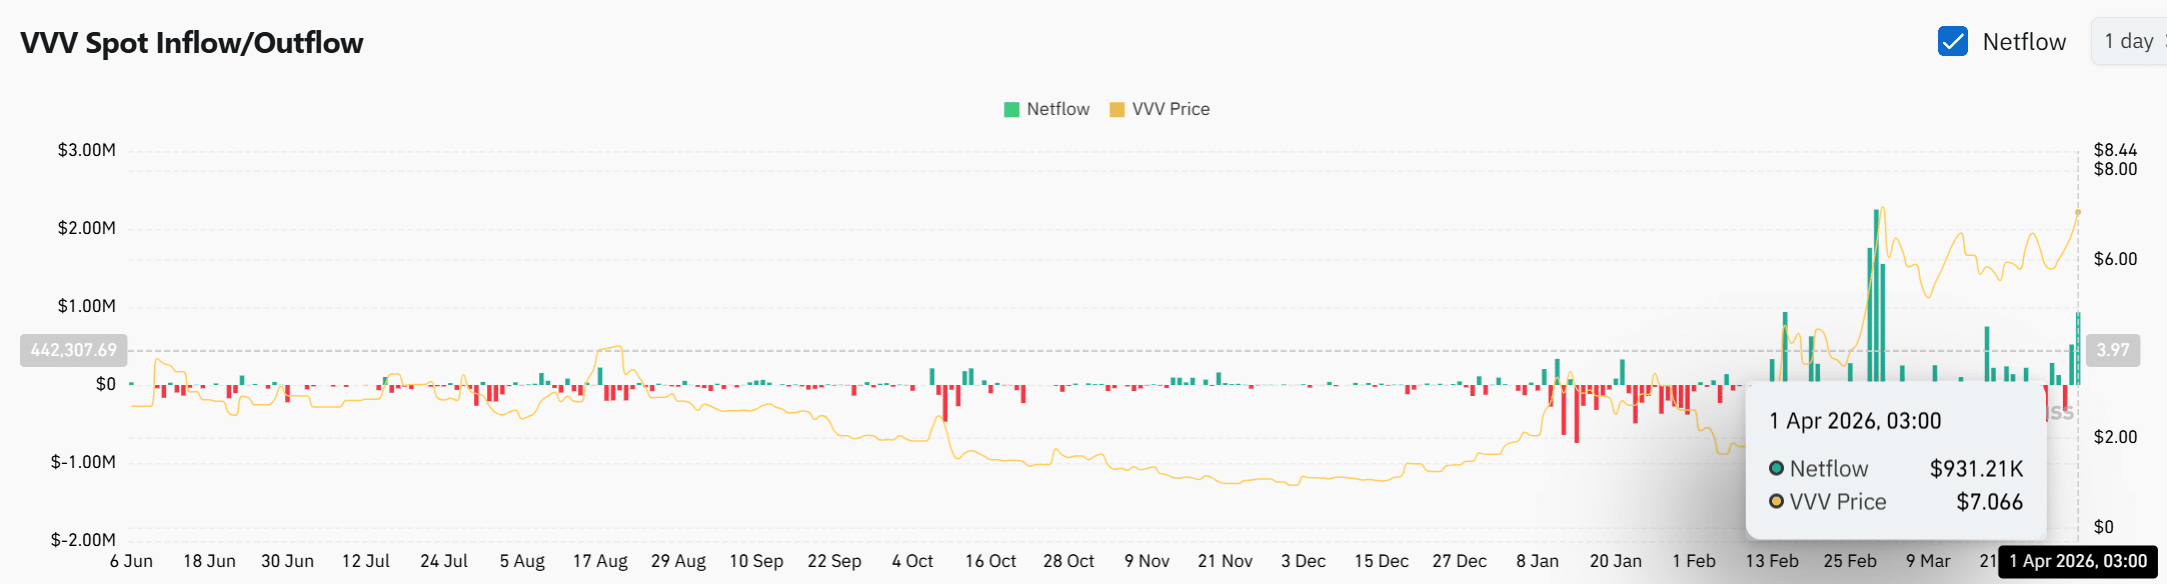
Spot Netflows have turned positive, with $931.21K in inflows recorded, marking a shift from prior outflow dominance.

This transition suggests that tokens are moving back onto exchanges, which introduces potential sell-side liquidity.

However, the timing of these inflows coincides with price testing resistance, which often reflects positioning adjustments rather than immediate distribution.

Exchange deposits increase available supply, yet they do not always translate into instant selling pressure.

As price holds near the upper range, these inflows create a layer of caution. The market now watches whether this added liquidity slows the rally or simply accompanies continued upward movement.

Source: CoinGlass

Short squeeze reshapes positioning

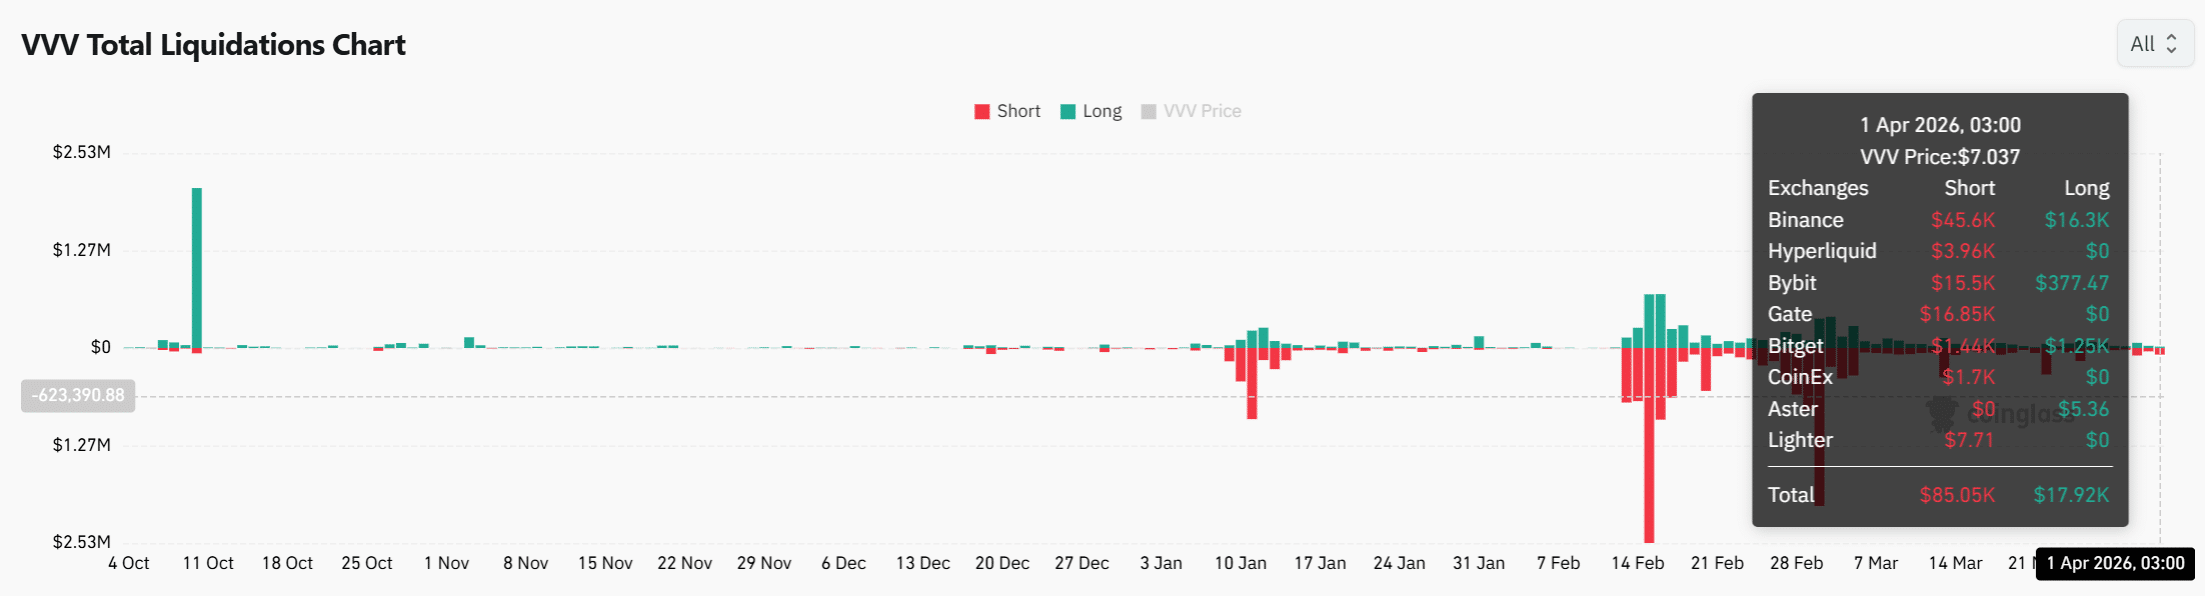
Liquidation data showed $85.05K in short liquidations versus $17.92K in long liquidations. This imbalance indicated that bearish positions faced stronger pressure.

That move aligned with a leverage reset, removing downside bets from the market.

When shorts unwind, forced buying can support the price and reduce selling pressure.

However, this also reduced immediate squeeze potential after weaker shorts exited. The liquidation profile suggested the market cleared fragile bearish positions.

As a result, price faced less resistance from leveraged downside pressure.

Source: CoinGlass

Can VVV sustain breakout?

VVV tested resistance as structure, indicators, and positioning aligned toward continuation.

Higher lows supported the trend, while MACD confirmed sustained momentum. Short liquidations reduced bearish pressure, keeping the path upward less contested.

Even so, rising exchange inflows introduced supply near resistance. If demand absorbed this supply, VVV could attempt a breakout beyond $7.20.


Final Summary

  • Venice Token [VVV] rose to $7.06, backed by a 14.55% daily gain and an 83.5% jump in Trading Volume.
  • Price approached the $7.20 resistance zone, a key level that previously capped upside.

Preguntas relacionadas

QWhat was the daily percentage gain that pushed Venice Token (VVV) to $7.06?

AThe daily gain was 14.55%.

QWhat is the critical resistance level that VVV price is approaching according to the article?

AThe critical resistance level is $7.20.

QHow much did the trading volume increase, and what was the new volume figure?

ATrading volume rose by 83.5% to $45.42 million.

QWhat technical indicator showed strengthening bullish momentum with a positive histogram?

AThe MACD indicator crossed above the signal line with a positive histogram, indicating strengthening bullish momentum.

QWhat does the shift to positive Spot Netflows of $931.21K suggest about token movement?

AThe positive Spot Netflows suggest that tokens are moving back onto exchanges, which introduces potential sell-side liquidity.

Lecturas Relacionadas

Trading

Spot
Futuros

Artículos destacados

Cómo comprar GAIN

¡Bienvenido a HTX.com! Hemos hecho que comprar GriffinAI (GAIN) sea simple y conveniente. Sigue nuestra guía paso a paso para iniciar tu viaje de criptos.Paso 1: crea tu cuenta HTXUtiliza tu correo electrónico o número de teléfono para registrarte y obtener una cuenta gratuita en HTX. Experimenta un proceso de registro sin complicaciones y desbloquea todas las funciones.Obtener mi cuentaPaso 2: ve a Comprar cripto y elige tu método de pagoTarjeta de crédito/débito: usa tu Visa o Mastercard para comprar GriffinAI (GAIN) al instante.Saldo: utiliza fondos del saldo de tu cuenta HTX para tradear sin problemas.Terceros: hemos agregado métodos de pago populares como Google Pay y Apple Pay para mejorar la comodidad.P2P: tradear directamente con otros usuarios en HTX.Over-the-Counter (OTC): ofrecemos servicios personalizados y tipos de cambio competitivos para los traders.Paso 3: guarda tu GriffinAI (GAIN)Después de comprar tu GriffinAI (GAIN), guárdalo en tu cuenta HTX. Alternativamente, puedes enviarlo a otro lugar mediante transferencia blockchain o utilizarlo para tradear otras criptomonedas.Paso 4: tradear GriffinAI (GAIN)Tradear fácilmente con GriffinAI (GAIN) en HTX's mercado spot. Simplemente accede a tu cuenta, selecciona tu par de trading, ejecuta tus trades y monitorea en tiempo real. Ofrecemos una experiencia fácil de usar tanto para principiantes como para traders experimentados.

348 Vistas totalesPublicado en 2025.09.24Actualizado en 2025.09.24

Cómo comprar GAIN

Discusiones

Bienvenido a la comunidad de HTX. Aquí puedes mantenerte informado sobre los últimos desarrollos de la plataforma y acceder a análisis profesionales del mercado. A continuación se presentan las opiniones de los usuarios sobre el precio de GAIN (GAIN).

活动图片