US-Iran Negotiations Countdown: What Cards Does Trump Hold?

比推Publicado a 2026-03-24Actualizado a 2026-03-24

Resumen

Summary: On March 23, Trump announced a 5-day suspension of planned strikes on Iran’s energy infrastructure, citing "productive dialogue" and "major consensus." However, Iran’s parliament speaker denied any direct talks. This marks the 7th time since 2018 that Trump has threatened Iran but only fully followed through twice—withdrawing from the JCPOA in 2018 and launching "Epic Fury" in February 2026. Brent crude fell 10.92% to around $100 after the delay announcement, reflecting market skepticism. Three scenarios post-deadline are possible: a temporary freeze agreement (oil at $80–90), extended talks (oil at $95–110), or resumed strikes with Hormuz blockade (oil up to $150+). Trump’s demands go far beyond the 2015 nuclear deal, including zero uranium enrichment and halting missile development. Current indirect mediation via Turkey, Egypt, and Pakistan lacks the structure of past multilateral talks. If talks fail, Trump’s options include strikes on power plants or Kharg Island (handling 90% of Iran’s exports), tariffs on nations trading with Iran, and cyber operations. Iran can counter by blocking the Strait of Hormuz (20% of global oil transit) for months and using its remaining missiles. Both sides face a credibility trap—military escalation risks oil price spikes, while repeated delays weaken threat credibility. The 5-day window is part of an ongoing high-stakes cycle.

Author: Rhythm BlockBeats

Original Title: If the US and Iran Don't Reach an Agreement in 5 Days, What Other Cards Does Trump Have?


On March 23, Trump announced a 5-day suspension of strikes on Iran's energy infrastructure, claiming that there had been "very good, productive dialogue" and "major points of consensus" between the US and Iran. Upon the news, Brent crude fell from $112 to $99.94, a single-day plunge of 10.92%, the largest single-day drop since the start of Epic Fury.

However, Iranian Parliament Speaker Mohammad Bagher Ghalibaf denied the same day that any direct negotiations had taken place. Turkey, Egypt, and Pakistan are acting as intermediaries to relay messages, with Kushner and Witkof coordinating, but there is disagreement even on the basic fact of "whether talks are happening."

On the Iran issue, this is not the first time Trump has issued an "ultimatum" and then stepped back. From 2018 to now, a similar pattern has occurred 7 times.

7 Threats, 2 Delivered

Laying out all of Trump's major threats against Iran from 2018 to the present reveals a clear pattern.
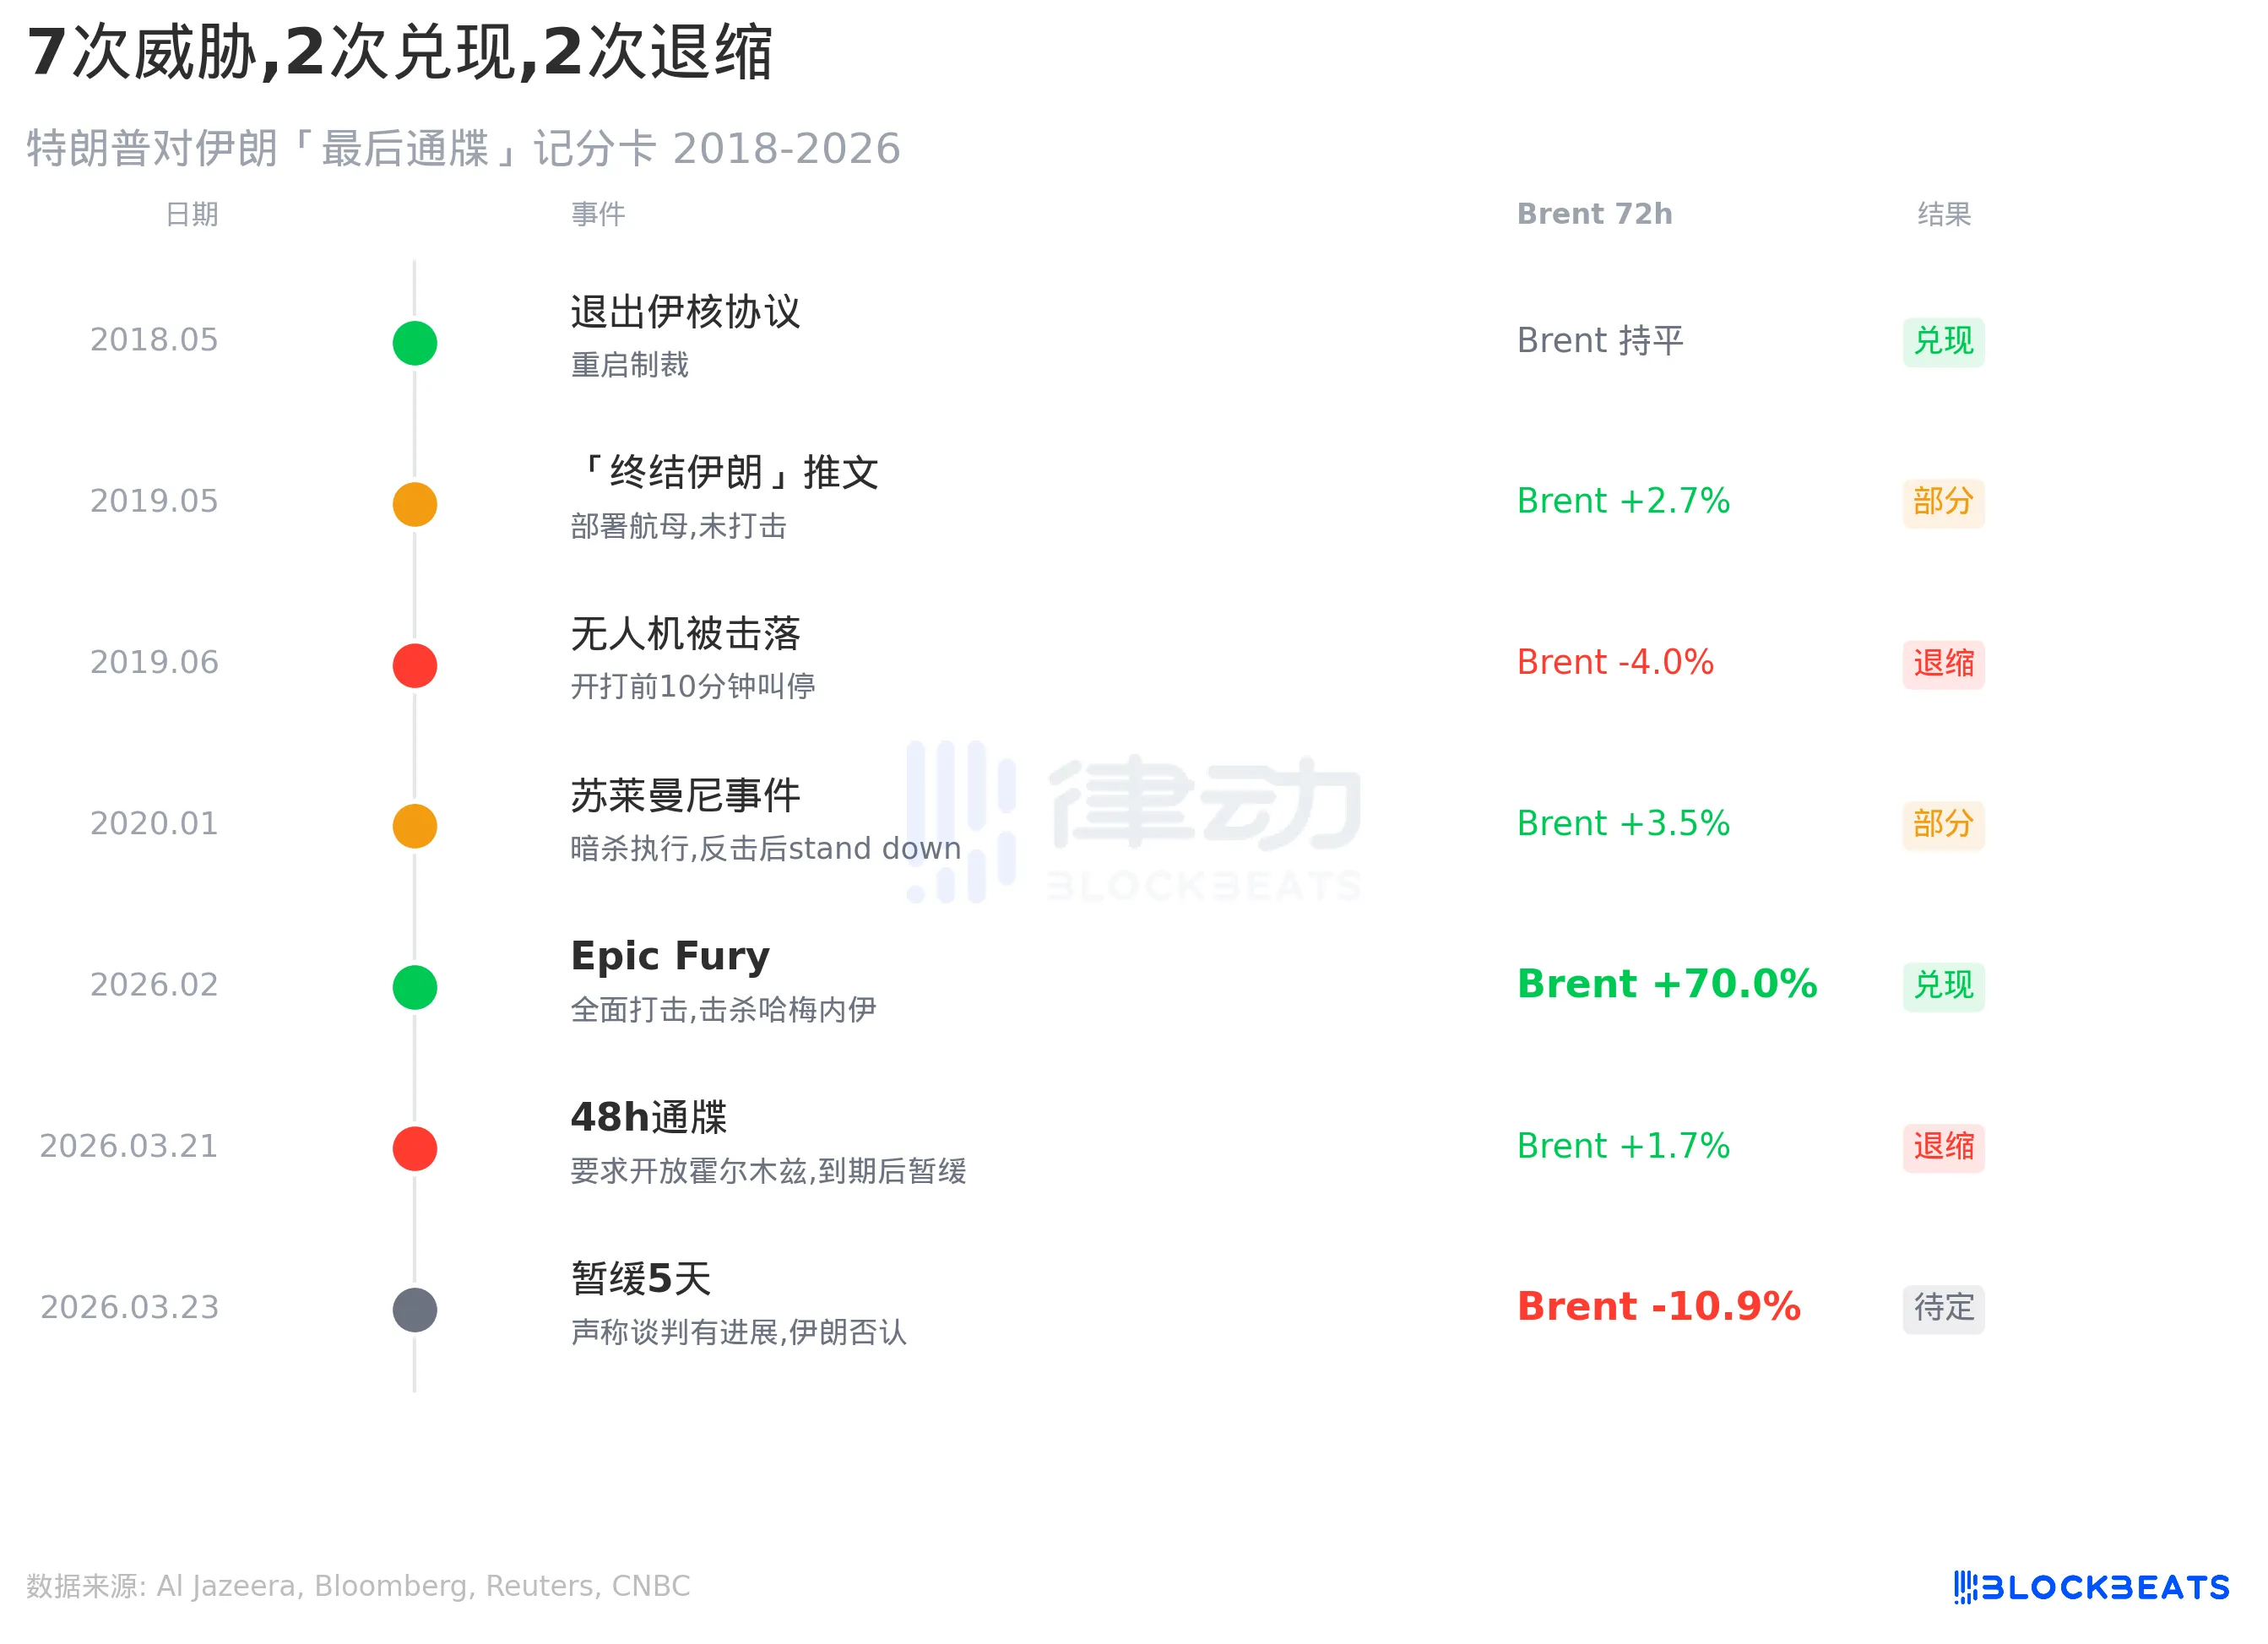
In 2018, he withdrew from the JCPOA, followed through, and sanctions were reinstated as scheduled. In February 2026, he launched Epic Fury, also followed through, killing Khamenei within 24 hours and destroying over 70% of Iran's missile launchers (according to Israeli intelligence assessments). These two were fully delivered, with oil prices reacting violently; Epic Fury drove Brent from $71 to $119.50, a 70% increase.

But the other side is equally prominent. In June 2019, after Iran shot down a US drone, Trump ordered strikes on Iranian radar and missile sites; the military was "cocked and loaded," but he called it off 10 minutes before launch. On March 21, 2026, he issued a 48-hour ultimatum to Iran to reopen the Strait of Hormuz; when it expired, he didn't strike, instead switching to a "5-day suspension."

Out of 7 instances, 2 were fully delivered, 2 were partially executed, 2 were退缩 (stepped back), and 1 is pending. The market's response is also changing. After the 2019 strike call-off, oil prices fell back only 3-5%. This time, with the 5-day suspension, oil prices directly fell 10.92%. The market's reaction amplitude to "suspension" type signals is放大 (amplifying), because investors are increasingly quickly pricing in the "threat devaluation."

What $100 Oil is Saying

After the 5-day window expires, there are three paths.

First, reaching some kind of framework agreement. Not a comprehensive deal, more likely a 30-60 day temporary freeze to buy time for后续 (follow-up) negotiations. In this scenario, Brent could fall back to the $80-90 range, close to Goldman Sachs' 2026 average price forecast of $85.

Second,延期 (extending) and continuing talks. After the 5 days expire, neither striking nor signing, but换 (exchanging for) a new suspension window. Oil prices remain震荡 (oscillating) in the $95-110 range, with war risk premium neither eliminated nor increased.

Third, resuming strikes加上 (plus) continued blockade of the Strait of Hormuz. According to CSIS's scenario modeling, if Iran expands attacks on Gulf oil facilities after being struck, Brent could surge to $130-150. Goldman Sachs' extreme scenario is more aggressive: if the Hormuz blockade lasts 60 days and Middle East production is长期 (long-term) reduced by 2 million barrels/day, oil prices could break the 2008 historical high of $147.
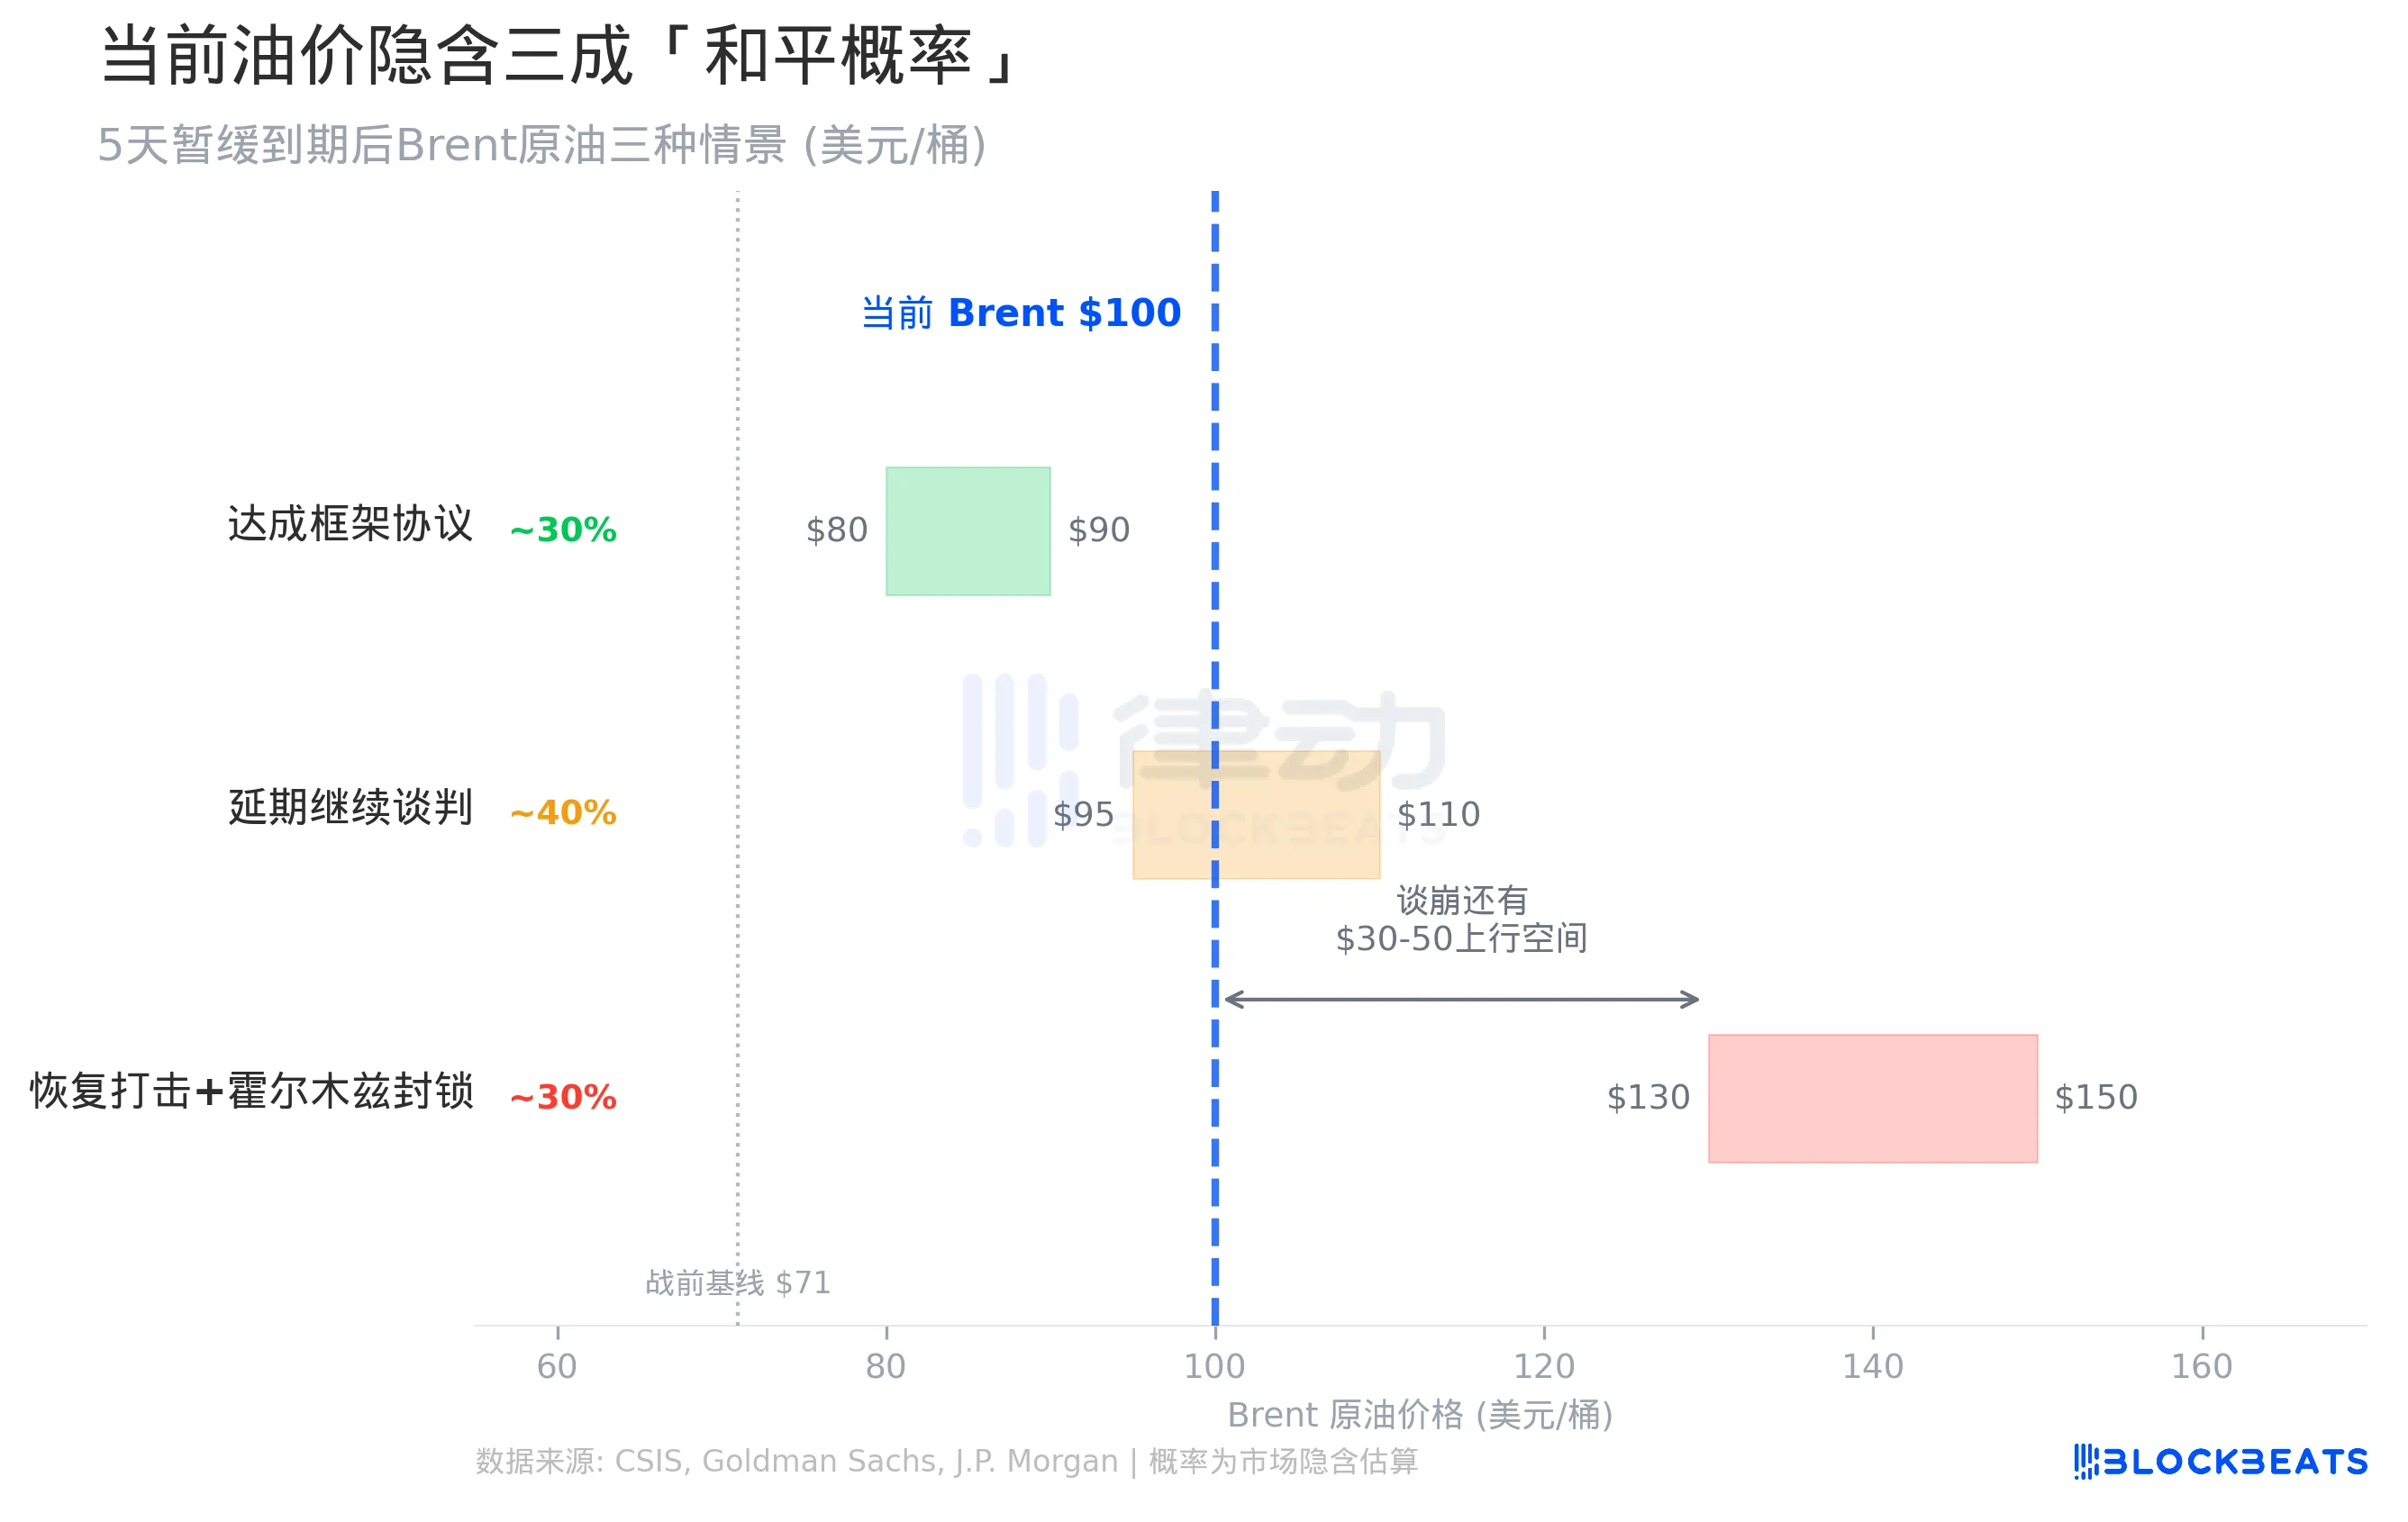
The current $100 Brent pricing roughly implies about a 30-40% probability of "reaching an agreement." Put another way, the market believes there is a 60-70% chance that the situation will not fundamentally improve after 5 days. If talks collapse, oil prices have another $30-50 of upside potential.

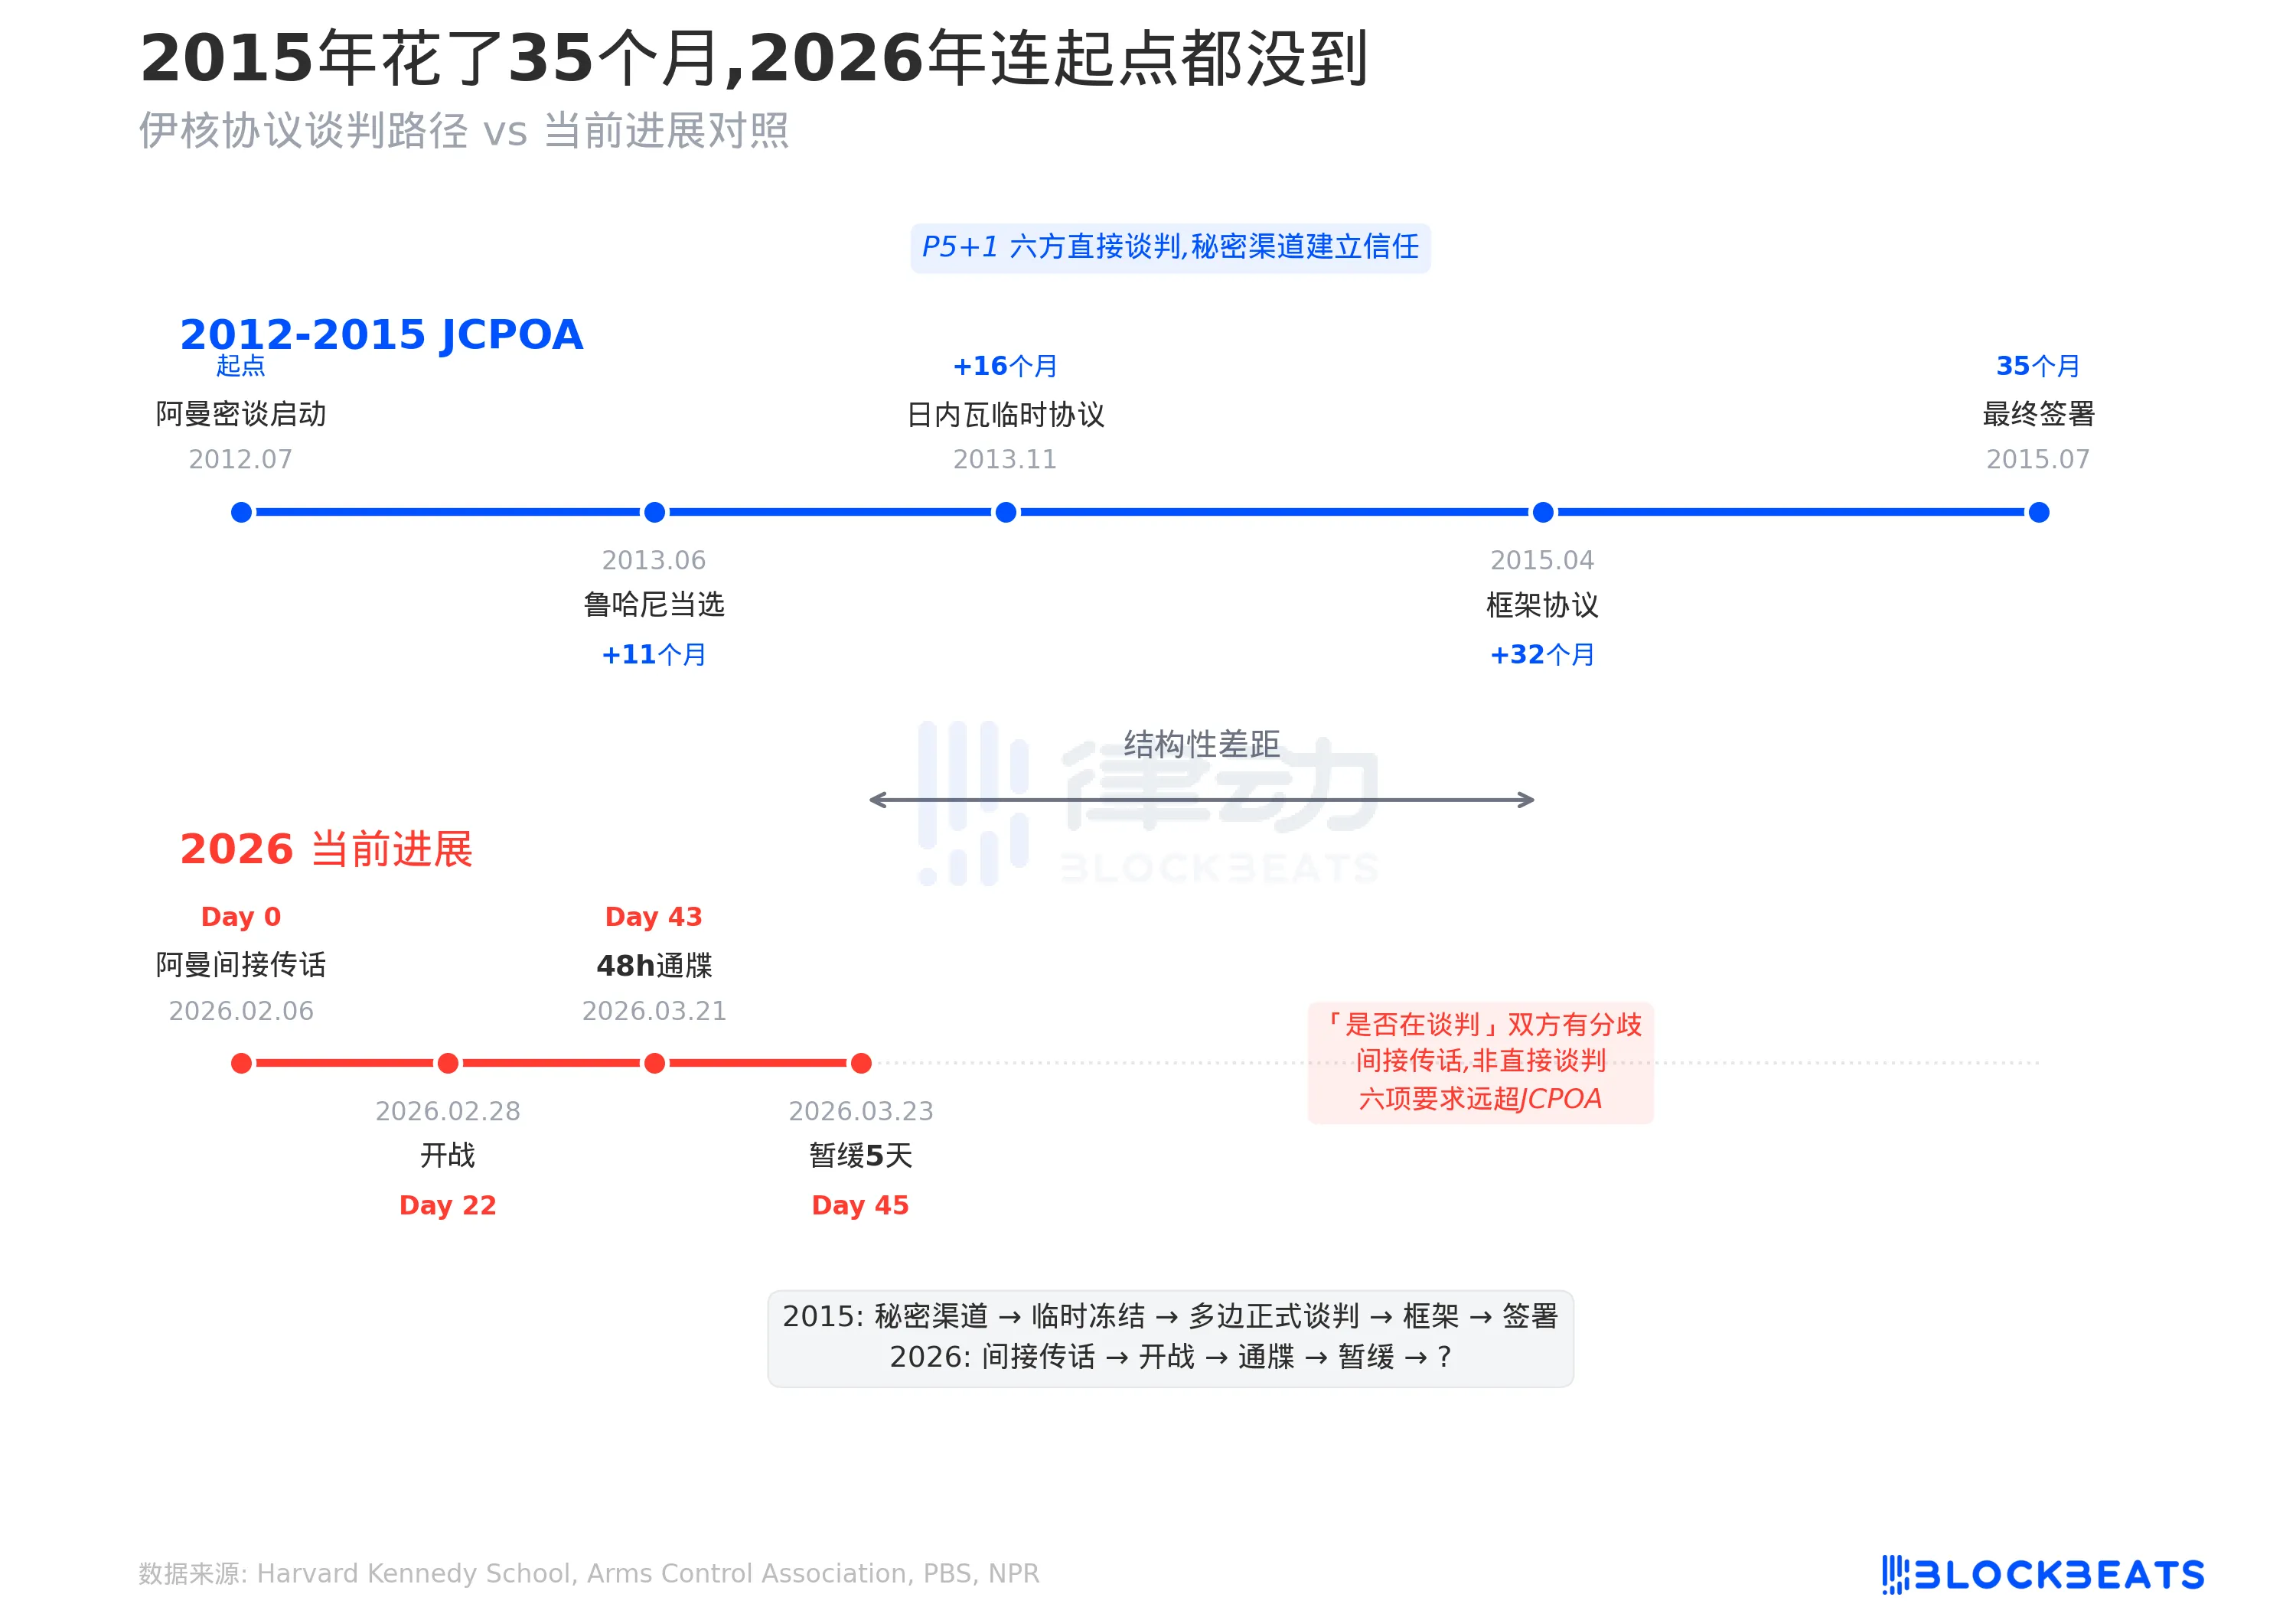
The 2015 Negotiations Took 35 Months

Trump's six core demands include zero uranium enrichment, dismantling nuclear facilities, a 5-year freeze on missile development, stopping funding proxy militias, recognizing Israel's right to exist, and US physical custody of Iran's stockpile of highly enriched uranium. This set of demands far exceeds the framework of the 2015 JCPOA. The当年的 (that year's agreement only limited enrichment levels to 3.65%, kept facilities operational, and did not address missiles or proxy militias.

The 2015 JCPOA started with secret contacts in Oman in July 2012 and took 35 months until the final signing in Vienna. In between, there was Rouhani's election bringing pragmatists to power, the interim Geneva agreement building trust, and 20 rounds of direct P5+1 six-party negotiations.

Where is the progress in 2026? There was one indirect message relay through Oman on February 6th, then the war started on February 28th. As of the March 23rd suspension, only 45 days have passed, and the two sides don't even agree on "whether negotiations are happening." The intermediary structure involves Turkey, Egypt, and Pakistan separately relaying messages, not the multilateral direct谈判 (negotiations) of P5+1. The precondition for谈判 (negotiations) (both sides acknowledging their existence) isn't even met yet, whereas the 2015 path used secret channels to build trust for over a year before entering public谈判 (negotiations).
If No Deal, What Other Cards Does Trump Have?

The military card is the most direct. Power plant strikes are the direct object of the 5-day suspension; resuming strikes has the lowest operational threshold. More升级 (escalated) options include blockading or occupying Kharg Island; Al Jazeera reported on March 20th that plans were already being discussed. Kharg handles 90% of Iran's crude exports, about 1.3-1.6 million barrels/day (according to EIA data). Regarding nuclear facilities, Natanz was damaged in the first week of the war, Fordow's highly enriched uranium has not been moved since being struck in June 2025 (according to FDD analysis), but Iran's new Pickaxe Mountain facility, built 100 meters underground in granite near Natanz, is beyond the reach of airstrikes. Currently, the US military has deployed 2 carrier strike groups, over 16 surface vessels, and more than 100 aircraft in the Middle East (according to Military Times), the largest scale since the 2003 Iraq war.

On the economic card, Trump announced in January a 25% tariff on countries doing business with Iran. The main targets are China (over 90% of Iran's oil trade), as well as India, the UAE, and Turkey. Iran's current oil exports are still 1.5-1.6 million barrels/day, with daily revenue of about $140 million (according to Defense News data).

Cyber warfare is already underway. According to Foreign Policy报道 (reporting), before the Epic Fury kinetic strikes, US Cyber Command had already launched "non-kinetic effects," paralyzing parts of Iran's communication and early warning systems.

But Iran is not without counter-cards. According to US Defense Intelligence Agency (DIA) assessments, Iran can maintain a blockade of the Strait of Hormuz for 1-6 months. The Strait of Hormuz sees 20 million barrels of crude and refined products pass through daily, accounting for 20% of global oil consumption (according to EIA data), while Saudi Arabia and the UAE's pipeline bypass capacity is only 3.5-5.5 million barrels/day, leaving a huge gap of 14.5 million barrels/day. Iran still has about 1,500 ballistic missiles and 200 launchers (according to Israeli military estimates), and Hezbollah holds about 25,000 missiles (according to Israeli assessments).

This is the underlying博弈 (game theory) logic of the 5-day window. Trump faces a credibility trap: if he strikes, oil prices could spiral out of control, putting pressure on the domestic economy. If he doesn't strike, the cycle of ultimatums and suspensions will further weaken the pricing power of military threats. Iran's dilemma is对称 (symmetrical): if they talk, domestic hardliners won't agree. If they don't talk, the next round of strikes could target power plants and Kharg Island. The March 28th expiration date is not the end point; it's the next flip of this trap.


Twitter:https://twitter.com/BitpushNewsCN

Bitpush TG Discussion Group:https://t.me/BitPushCommunity

Bitpush TG Subscription: https://t.me/bitpush

Original link:https://www.bitpush.news/articles/7622904

Preguntas relacionadas

QWhat are the three possible outcomes after the 5-day window for US-Iran negotiations expires, and how would each affect oil prices?

AThe three possible outcomes are: 1) A framework agreement is reached, likely a 30-60 day temporary freeze, which could cause Brent crude to fall to the $80-90 range. 2) The talks are extended with a new grace period, keeping oil prices fluctuating in the $95-110 range. 3) The US resumes strikes and the Strait of Hormuz remains blocked, which could push Brent crude to $130-150 or even higher, potentially surpassing the 2008 high of $147 per barrel.

QAccording to the article, what is the market's implied probability of a deal being reached after the 5-day window?

AThe current Brent crude price of $100 implies a market probability of about 30-40% that an agreement will be reached. This means the market believes there is a 60-70% chance that the situation will not fundamentally improve after the 5 days.

QHow do Trump's current core demands on Iran compare to the 2015 JCPOA agreement?

ATrump's six core demands are far more extensive than the 2015 JCPOA. They include zero uranium enrichment, dismantling nuclear facilities, a 5-year freeze on missile development, stopping funding for proxy militias, recognition of Israel's right to exist, and physical custody of Iran's highly enriched uranium stockpile by the US. The JCPOA only limited enrichment levels to 3.65%, allowed facilities to remain operational, and did not address missiles or proxy militias.

QWhat military and economic options does the US have if negotiations with Iran fail?

AMilitarily, the US could resume strikes on power plants, which is the most direct option. More escalatory options include blockading or occupying Kharg Island, which handles 90% of Iran's crude exports. The US has a significant military presence in the region. Economically, the US has already imposed a 25% tariff on countries trading with Iran, primarily targeting China, India, the UAE, and Turkey. Cyber warfare operations are also already underway.

QWhat countermeasures does Iran have at its disposal, according to the article's assessment?

AIran can maintain a blockade of the Strait of Hormuz for 1-6 months, which transits 20% of global oil consumption. It still possesses an estimated 1,500 ballistic missiles and 200 launchers. Its proxy, Hezbollah, is assessed to hold about 25,000 missiles. These assets provide Iran with significant retaliatory capabilities.

Lecturas Relacionadas

Goldman Sachs: July Smashes Through Crowded Trades, U.S. Stock Bull Market Not Broken but Harder to Navigate

Goldman Sachs: July Sees Crowded Trades Unwound, U.S. Bull Market Intact but Getting Tougher. The U.S. stock market in July did not see an index-level crash, but rather a significant unwinding of speculative positions. While the S&P 500 remained stable—trading within a narrow 3.5% range and staying within 2% of its high—underlying market dynamics were volatile. Heavily crowded trades, particularly in high-momentum tech, AI-linked stocks, and Asian strategies, faced severe pressure and forced deleveraging. Data indicates this was a meaningful cleanse, not a minor adjustment. Global tech exposure saw its largest sell-off in over five years, leverage in Korean equity ETFs plummeted, and Goldman's prime brokerage recorded the largest gross exposure reduction since late 2022. Leverage on momentum factors among fundamental long/short clients fell to the 28th percentile of its one-year range. The AI trade narrative shifted from pure potential to a focus on tangible returns. While Meta failed to show clear AI monetization, Microsoft and Amazon provided evidence that massive capital expenditure is translating into scalable revenue and product growth, preventing a blanket sell-off of the AI sector. The Federal Reserve's more opaque communication style and volatility in long-end Treasury yields have introduced new friction, particularly for rate-sensitive growth and tech stocks. The broader outlook for U.S. equities remains favorable, supported by a strong economy, robust earnings, and substantial AI capital expenditure. However, risk/reward is no longer cheap, and the market's upward elasticity has weakened. The Nasdaq 100's trajectory—up 12% year-to-date despite significant pullbacks—illustrates that the bull trend persists but the path is becoming more difficult. The key lesson from July is that the market no longer rewards crowded, highly leveraged trades, requiring more disciplined and liquid portfolio approaches.

marsbitHace 58 min(s)

Goldman Sachs: July Smashes Through Crowded Trades, U.S. Stock Bull Market Not Broken but Harder to Navigate

marsbitHace 58 min(s)

Interview with Robinhood Executive: Meme + Tokenized US Stocks as "Barbell" Customer Acquisition Strategy, All Business Lines Achieve Hundreds of Millions in Revenue

Interview with Robinhood executive Johann Kerbrat reveals the company's "barbell" customer acquisition strategy for its new Robinhood Chain, combining meme tokens with tokenized stocks. Three weeks after mainnet launch, the chain has seen over $3B in weekly DEX volume and 105M transactions. Kerbrat explains the logic behind the permissionless chain: meme tokens attract DeFi users, while tokenized real-world assets (RWA), currently over 90 US stocks and ETFs accessible in 120+ countries, serve global users. The goal is to bring Robinhood's 27 million funded accounts on-chain by simplifying DeFi with a user-friendly interface, exemplified by features like Robinhood Earn which offers yield without requiring wallet management. Built on Arbitrum's technology stack for its speed, low cost, and Ethereum's security, the chain focuses on financial products like Earn, spot trading, and perpetuals. Kerbrat downplays direct competition with platforms like Base, emphasizing the goal of expanding the overall market for on-chain assets. He details selective partnerships (e.g., Morpho, Lighter) based on compliance, unique UX, and differentiation. While regulatory clarity is pending for US perpetuals, the expansion continues via Bitstamp in Europe. Finally, Kerbrat positions Robinhood as a "super app" integrating stocks, options, crypto, banking, and AI trading, with all major business lines generating hundreds of millions in revenue. For the chain, current priority is driving adoption over maximizing gas fee revenue.

marsbitHace 3 hora(s)

Interview with Robinhood Executive: Meme + Tokenized US Stocks as "Barbell" Customer Acquisition Strategy, All Business Lines Achieve Hundreds of Millions in Revenue

marsbitHace 3 hora(s)

Fidelity Q3 Report: BTC, ETH, and SOL Continue to Build Bottoms; How Much Further Will This Crypto Bear Market Go?

Fidelity's Q3 Crypto Signal Report analyzes the current bear market, noting Bitcoin (BTC), Ethereum (ETH), and Solana (SOL) are in a prolonged bottoming phase. Key indicators like the weighted Net Unrealized Profit/Loss (NUPL) have turned negative (-0.01), signaling the market is slightly below its aggregate cost basis, with BTC acting as the primary stabilizing asset. BTC's dominance has risen to 68%, indicating a lack of capital rotation to other digital assets. Performance has been weak across the board, with BTC, ETH, and SOL down significantly year-to-date. Market sentiment is depressed, exacerbated by substantial outflows from spot ETPs and a challenging macro environment. The report compares the current ~203-day downtrend to historical ~300-day bottoming cycles, suggesting the process may be two-thirds complete, with late 2026 as a potential timeframe to monitor. For Bitcoin, NUPL at 0.09 indicates cautious sentiment, while momentum signals remain negative. The Yardstick metric points to potential undervaluation relative to network security (hashrate). Ethereum's NUPL is deep in the "capitulation" zone at -0.43, a historically positive signal for future returns, though its momentum and network fee revenue are negative. Solana shows the deepest NUPL at -0.72 but demonstrates relative resilience in on-chain activity and stablecoin transfer volume. The report concludes that while several metrics are near historical capitulation levels, a definitive market bottom has not yet been established. The path forward likely involves continued consolidation, with BTC's relative strength and fundamental on-chain usage for ETH and SOL providing key areas for investor observation.

marsbitHace 3 hora(s)

Fidelity Q3 Report: BTC, ETH, and SOL Continue to Build Bottoms; How Much Further Will This Crypto Bear Market Go?

marsbitHace 3 hora(s)

Trading

Spot
活动图片





