TRUMP’s $3.18 vs $3.60 liquidity battle: What’s next for price?

ambcryptoPublicado a 2026-02-27Actualizado a 2026-02-27

Resumen

A whale linked to the official team deposited 5 million TRUMP tokens ($17.3M) into Binance, raising volatility and distribution concerns. However, broader spot flows remain muted, suggesting limited immediate selling pressure. TRUMP is trading near a critical support level at $3.184 within a descending channel. Despite structural weakness, top traders are predominantly long (62.79%), anticipating a rebound. Liquidation clusters are dense around $3.30-$3.35 (below) and $3.50-$3.60 (above), indicating high volatility potential in either direction. The price hold above $3.184 could trigger a short squeeze toward $3.60, while a breakdown may cause a long liquidation cascade. Current data favors volatility expansion over consolidation.

A team-linked whale has deposited 5 million The Official Trump [TRUMP] worth $17.3 million into Binance within 24 hours, intensifying volatility risks.

On-chain tracking shows most tokens originated from official Meme Team allocation wallets, which immediately raises distribution concerns.

Such direct exchange transfers often precede active supply rotation rather than cold storage holding.

However, the TRUMP price has not collapsed aggressively since the transfer, which suggests traders still assess the broader structure before reacting.

This deposit now shifts focus toward spot flows and derivatives positioning. If exchange balances expand meaningfully, sellers could pressure nearby support.

Yet if broader flows remain muted, liquidity conditions may stay balanced despite the headline-sized transfer.

TRUMP presses against a lower channel

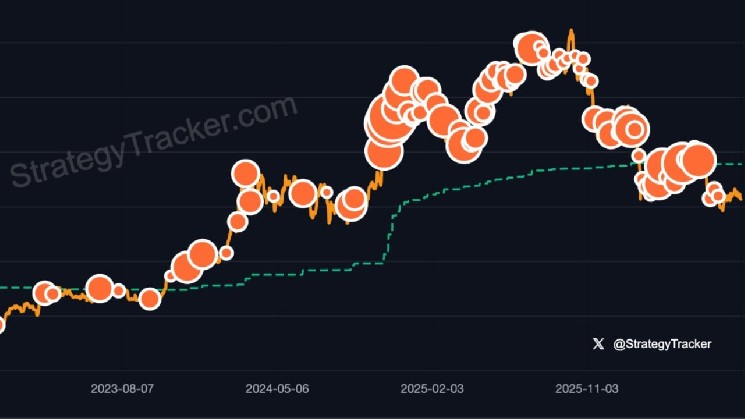
TRUMP continues trading inside a well-defined descending channel that has governed price structure since mid-2025, and current candles show compression near the lower boundary.

Price trades around $3.421 while repeatedly testing the horizontal $3.184 support zone, which now acts as the immediate structural floor.

Each rebound from this level has produced only shallow recoveries, which reflects limited upside conviction.

Overhead, $4.274 represents the first meaningful resistance inside the channel, while $5.684 aligns closer to the upper boundary and the prior breakdown region.

Meanwhile, RSI printed 40.54 at press time, while its signal line tracks near 36.62, indicating a modest rebound from oversold conditions.

However, RSI still remains below the 50 midpoint, which keeps the broader bearish structure intact. Therefore, buyers must reclaim $4.274 decisively to weaken channel continuation pressure.

Are spot flows confirming the distribution?

Spot flow data showed a netflow reading of -$470.75K, which indicates slight net outflows rather than aggressive inflows.

This figure contrasts sharply with the $17.3 million whale deposit and suggests broader exchange participation has not expanded dramatically.

However, a single wallet transfer does not confirm sustained selling pressure unless aggregate inflows increase.

Historically, distribution phases coincide with consistent positive netflow spikes rather than isolated transfers. Therefore, traders now monitor whether inflows begin exceeding prior baseline levels.

If exchange balances rise in the coming sessions, supply overhang could intensify. Until then, spot data reflects contained exchange activity despite heightened narrative risk.

Why are top traders leaning long?

Binance top trader data shows 62.79% of accounts positioned long versus 37.21% short. The long/short ratio stands at 1.69, which signals aggressive upside positioning despite broader structural weakness.

This skew indicates traders anticipate a rebound from lower channel support rather than immediate continuation downward.

However, crowded long exposure increases vulnerability to forced liquidations if the price breaks lower. Elevated long dominance often creates asymmetric risk when support levels weaken.

Traders clearly expect recovery toward mid-range resistance, yet leverage concentration now magnifies volatility potential. If price fails to sustain $3.184, long-heavy positioning could unwind rapidly.

Liquidity clusters crowd both sides

The 24-hour liquidation heatmap reveals dense leverage clusters between $3.50 and $3.60 overhead. Bright bands also appear around the $3.30 to $3.35 region below the current price.

These zones act as liquidity magnets because forced liquidations amplify directional moves. When the price approaches dense clusters, cascading stop-outs frequently accelerate volatility.

Overhead liquidity suggests potential short squeezes if the price reclaims higher intraday levels. However, lower clusters expose downside risk if support weakens.

Current positioning reflects a compressed range between liquidation pools. This structure implies volatility expansion likely occurs once the price decisively targets one side’s leverage pocket.

Inflection or controlled unwind?

TRUMP currently trades at a structural inflection near $3.184 while long positioning dominates derivatives markets. Spot flows remain muted despite the $17.3 million deposit, which tempers immediate distribution fears.

However, dense liquidation clusters surround the price tightly. If bulls defend support and trigger overhead liquidations, price could squeeze toward $3.60 and beyond.

If support breaks, leveraged longs could unwind quickly. Present data slightly favors volatility expansion rather than quiet consolidation.


Final Summary

  • Whale deposit of $17.3 million TRUMP heightens volatility risks, but muted spot flows temper immediate distribution pressure.
  • Price compression near $3.184 support with crowded long positioning suggests either a rebound squeeze or rapid unwind if support fails.

Preguntas relacionadas

QWhat was the value and quantity of the TRUMP tokens deposited by the whale into Binance, and what does it indicate?

AA whale deposited 5 million TRUMP tokens worth $17.3 million into Binance. This large transfer from a team-linked wallet intensifies volatility risks and raises concerns about potential distribution, as such direct exchange transfers often precede active supply rotation rather than long-term holding.

QWhat are the key support and resistance levels for TRUMP's price according to the technical analysis?

AThe immediate structural support is at the horizontal zone of $3.184. The first meaningful overhead resistance is at $4.274 inside the descending channel, with a stronger resistance level near the upper channel boundary at $5.684.

QHow did the spot flow data contrast with the large whale deposit, and what does this suggest?

AThe spot flow data showed a net outflow of -$470.75K, indicating slight net outflows rather than aggressive inflows. This contrasts sharply with the $17.3 million whale deposit and suggests that broader exchange participation has not expanded dramatically, tempering immediate fears of a sustained distribution phase.

QWhat is the current sentiment among Binance's top traders regarding TRUMP, and what risk does this pose?

ABinance top trader data shows 62.79% of accounts are positioned long, with a long/short ratio of 1.69. This indicates aggressive upside positioning, anticipating a rebound from support. However, this crowded long exposure increases vulnerability to forced liquidations and creates asymmetric risk if the $3.184 support level breaks.

QWhat do the liquidity clusters on the heatmap indicate for potential price movement?

AThe liquidation heatmap shows dense leverage clusters between $3.50-$3.60 overhead and around $3.30-$3.35 below the current price. These zones act as liquidity magnets, meaning a move toward either cluster could trigger cascading liquidation event, accelerating volatility in that direction—a potential short squeeze upward or a long unwinding downward.

Lecturas Relacionadas

Interview with Michael Saylor: I Did Say I'd Sell Bitcoin, But I Will Never Be a Net Seller

**Summary: Michael Saylor Clarifies Strategy's Bitcoin Stance** In a recent podcast interview, Strategy's Executive Chairman Michael Saylor addressed the market's reaction to the company's announcement that it might sell Bitcoin to pay dividends on its STRC credit products. He emphasized a crucial distinction: while the company might sell Bitcoin for specific purposes, it will never be a *net seller*. Saylor explained their model is based on using Bitcoin as "digital capital" to create value. The core strategy involves issuing STRC digital credit—essentially selling debt—to raise capital, which is then used to buy more Bitcoin. He estimates Bitcoin appreciates at roughly 40% annually. A small portion of these capital gains (e.g., ~2.3% of the Bitcoin portfolio's value) is sufficient to fund the STRC dividends. Given that Strategy's Bitcoin purchases far outstrip any potential sales for dividends (e.g., buying $3.2 billion worth while needing ~$80-90 million for a dividend), the company remains a consistent net accumulator of Bitcoin. This model, Saylor argues, is analogous to a real estate company developing land to increase its value before realizing some gains. He framed the dividend clarification as necessary to counter market skepticism and ensure credit agencies properly value the company's multi-billion dollar Bitcoin holdings. Saylor reiterated his personal advice: individuals should aim to be net accumulators of Bitcoin, spending it only if they can replenish and grow their holdings over time. Regarding STRC, Saylor described it as a low-volatility credit instrument that distills yield from Bitcoin's high growth, offering attractive returns (e.g., ~11-12% yield) for risk-averse investors. He noted that Strategy's STRC issuance now constitutes about 60% of the U.S. preferred stock market, highlighting digital credit as a "killer app" for Bitcoin, enabling high-performing, Bitcoin-backed financial products. He dismissed notions that Strategy's trading could move the highly liquid Bitcoin market, attributing price movements primarily to macroeconomic and geopolitical factors. Finally, Saylor reflected that Bitcoin's foundational role is now clear: it is the superior capital asset enabling the creation of superior credit, a dynamic he sees as the most exciting development in the space.

marsbitHace 4 min(s)

Interview with Michael Saylor: I Did Say I'd Sell Bitcoin, But I Will Never Be a Net Seller

marsbitHace 4 min(s)

380,000 Apps Exposed, 2,000+ Apps Leaked Secrets: AI Programming Turns 'Intranet' into Public Internet

Israeli cybersecurity firm RedAccess uncovered a severe data exposure trend linked to "vibe coding" or AI-powered software development tools. Their research found approximately 38,000 publicly accessible web applications built with platforms like Lovable, Base44, Netlify, and Replit. Of these, an estimated 2,000 apps exposed sensitive corporate and personal data, including medical records, financial information, internal strategic documents, and customer chat logs. In some cases, access even granted administrative privileges. The core issue stems from default privacy settings that make applications public by default, combined with a lack of built-in security controls (like authentication) in the AI-generated code. This allows employees without security expertise—"citizen developers"—to easily create and deploy applications that bypass standard corporate security reviews. The exposed apps, often indexed by search engines, are trivially discoverable. While some platform providers (Replit, Lovable, Wix/Base44) argue that security configuration is the user's responsibility and question the validity of some findings, security researchers confirm the widespread reality of such exposures. This pattern, also noted in prior studies, highlights a critical security gap as AI democratizes app creation, potentially leading to massive, unintentional data leaks.

marsbitHace 1 hora(s)

380,000 Apps Exposed, 2,000+ Apps Leaked Secrets: AI Programming Turns 'Intranet' into Public Internet

marsbitHace 1 hora(s)

Attracting Global Capital, Asia's New 'Super Cycle' Is Unfolding

Investors are turning to Asia as the next frontier for global equity growth, with a new "super cycle" unfolding across the region. Driven by the AI revolution, Asian markets, particularly South Korea, have seen significant rallies. According to Morgan Stanley analysis, the underlying drivers of Asia's industrial cycle are shifting from traditional sectors like real estate and manufacturing to massive investments in AI infrastructure, energy security and transition, and supply chain resilience. Fixed asset investment in Asia is projected to grow from around $11 trillion in 2025 to $16 trillion by 2030, with a 7% annual growth rate from 2026-2030. The AI wave is a primary catalyst, driving immense capital expenditure for chips, servers, data centers, and power systems. Asia is central to this hardware supply chain. In China, AI investment is focused on building a full-system domestic capability, with the local AI chip market potentially reaching $86 billion by 2030. Beyond AI, China's export story is expanding from EVs and batteries to robotics. The country already captures about half of new global industrial robot demand and over 90% of humanoid robot shipments. This growth phase mirrors the early stages of China's EV export boom. Simultaneously, energy security investments, spurred by AI's massive power needs, are rising, with China benefiting from its leadership in solar, batteries, and EVs. Regional defense spending is also increasing structurally, supporting demand for advanced manufacturing. The main beneficiaries are China, South Korea, and Japan, positioned in core supply chain areas. However, risks remain, including potential overcapacity, profit margin pressures from competition, persistent technological restrictions, geopolitical friction, and workforce displacement due to AI-driven automation. Market volatility is also expected to increase as investor expectations diverge on the realization of these capital investment and export themes.

marsbitHace 1 hora(s)

Attracting Global Capital, Asia's New 'Super Cycle' Is Unfolding

marsbitHace 1 hora(s)

Trading

Spot
Futuros
活动图片