TRON activity surges with 2.6mln users – But can TRX sustain upside?

ambcryptoPublicado a 2026-03-31Actualizado a 2026-03-31

Resumen

TRON (TRX) has demonstrated significant growth, with an 11.32% increase in Total Value Locked (TVL) and 2.62 million active addresses, indicating strong capital retention and user engagement. The price has been recovering, forming a higher low near $0.27 and advancing toward the $0.322 resistance level. The MACD indicator shows strengthening momentum with sustained buying strength. However, exchange inflows have turned positive, suggesting potential profit-taking near resistance, which could slow upward momentum. Liquidation data indicates a reset in leveraged long positions, creating a more stable market environment. For a sustained breakout, buyers must absorb selling pressure and push above $0.322; otherwise, consolidation may continue.

TRON [TRX] recorded an 11.32% rise in Total Value Locked [TVL] over the past month, signaling steady capital retention.

Network usage also intensified, with 2.62 million Active Addresses and $1.06 million in daily fees. This placed TRX ahead of competing chains in activity.

That combination reflected sustained demand building across the TRX network.

Such growth in liquidity and participation pointed to a structurally active ecosystem.

TRX presses resistance after strong recovery structure

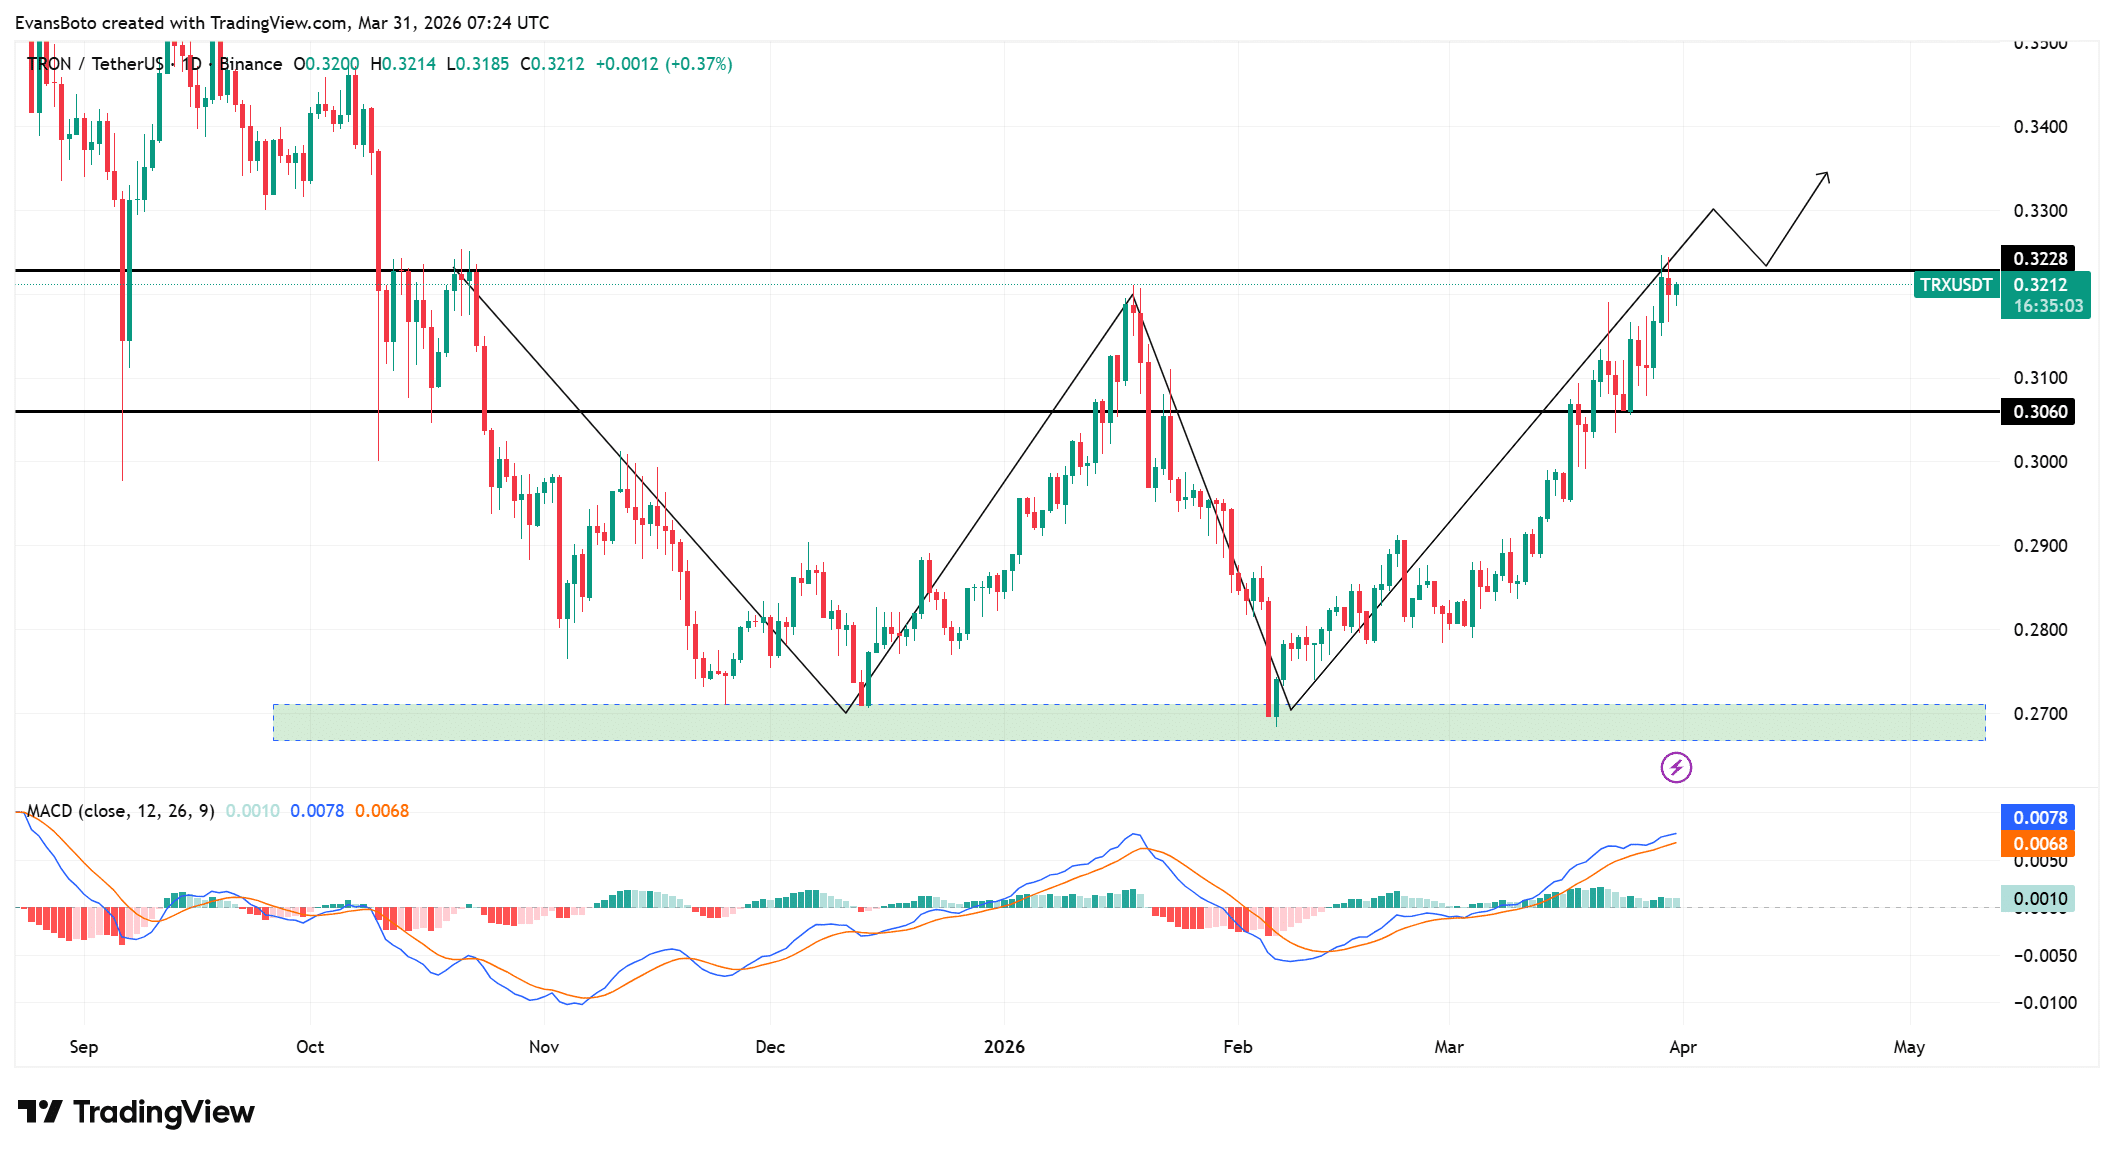
TRX formed a higher low near the $0.27 demand zone, supporting the ongoing recovery.

Price advanced toward the $0.322 resistance, forming a rising structure that showed stronger buyer control.

Each pullback held above prior lows, reinforcing the uptrend.

However, this level remained a key decision point, as prior rejections appeared near this zone. If buyers held above the $0.306 support, the structure could stay intact.

A move above $0.322 would confirm strength, while hesitation could trigger short consolidation.

The MACD crossed above the signal line and widened, indicating strengthening bullish momentum. Histogram bars stayed positive, showing sustained buying strength after the crossover.

This suggested demand remained consistent rather than driven by a single impulse.

Source: TradingView

Exchange inflows rise as selling risk builds

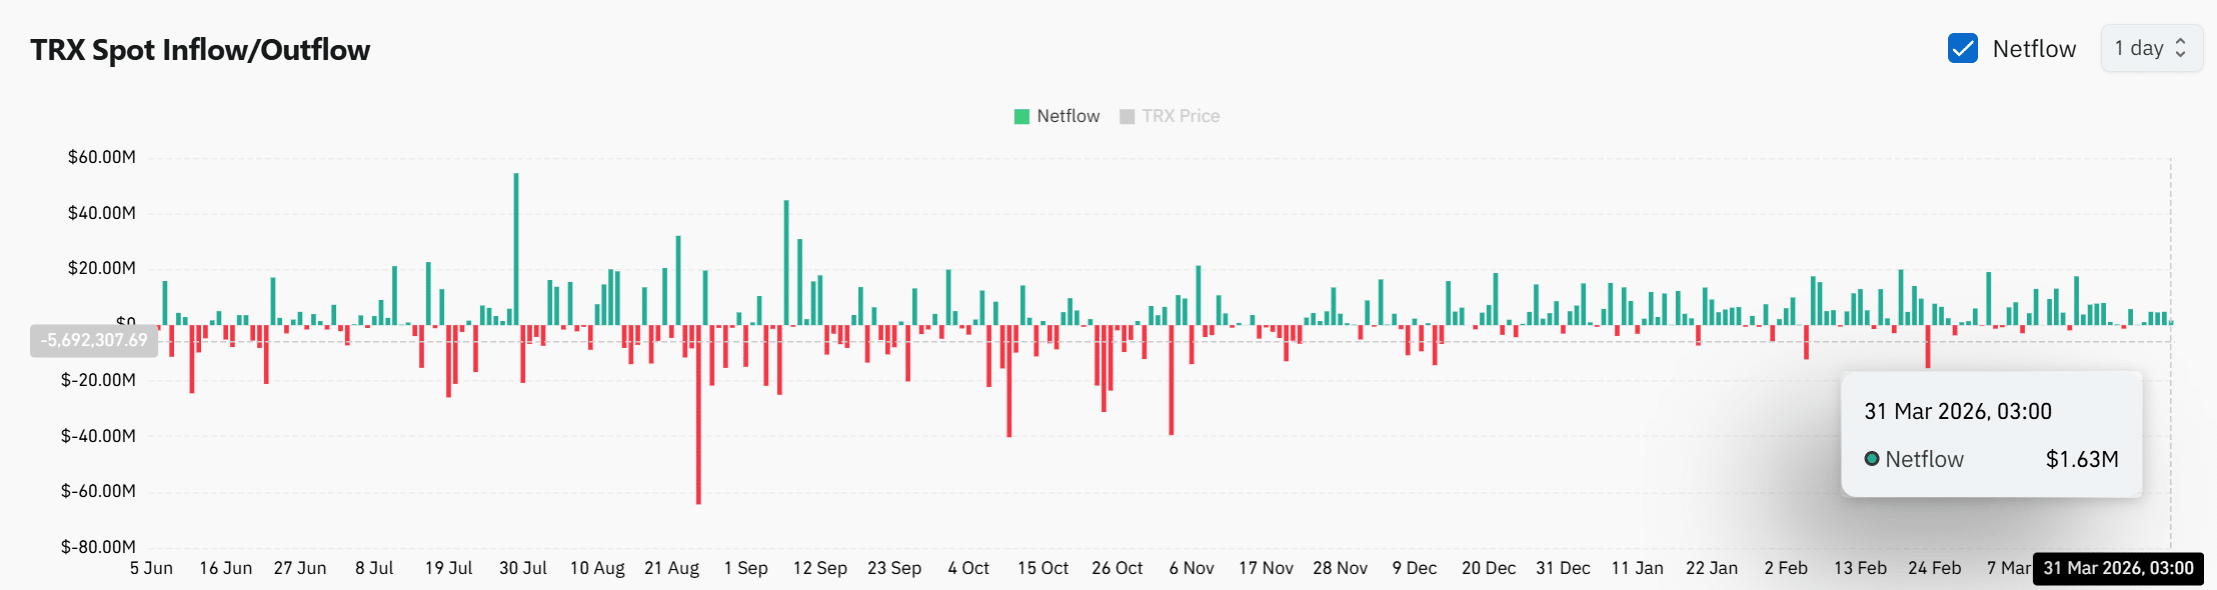
Spot Netflows flipped positive, with $1.63M in inflows, signaling increased exchange deposits. That shift indicated a behavioral change, as earlier outflows reduced sell-side pressure.

Now, rising deposits suggested some traders were prepared to take profits near resistance.

However, inflows alone did not confirm selling and could reflect repositioning.

If price held steady, demand could absorb the incoming supply. By contrast, rising balances near $0.322 could increase rejection risk.

Source: CoinGlass

TRX liquidations show leverage reset during volatility

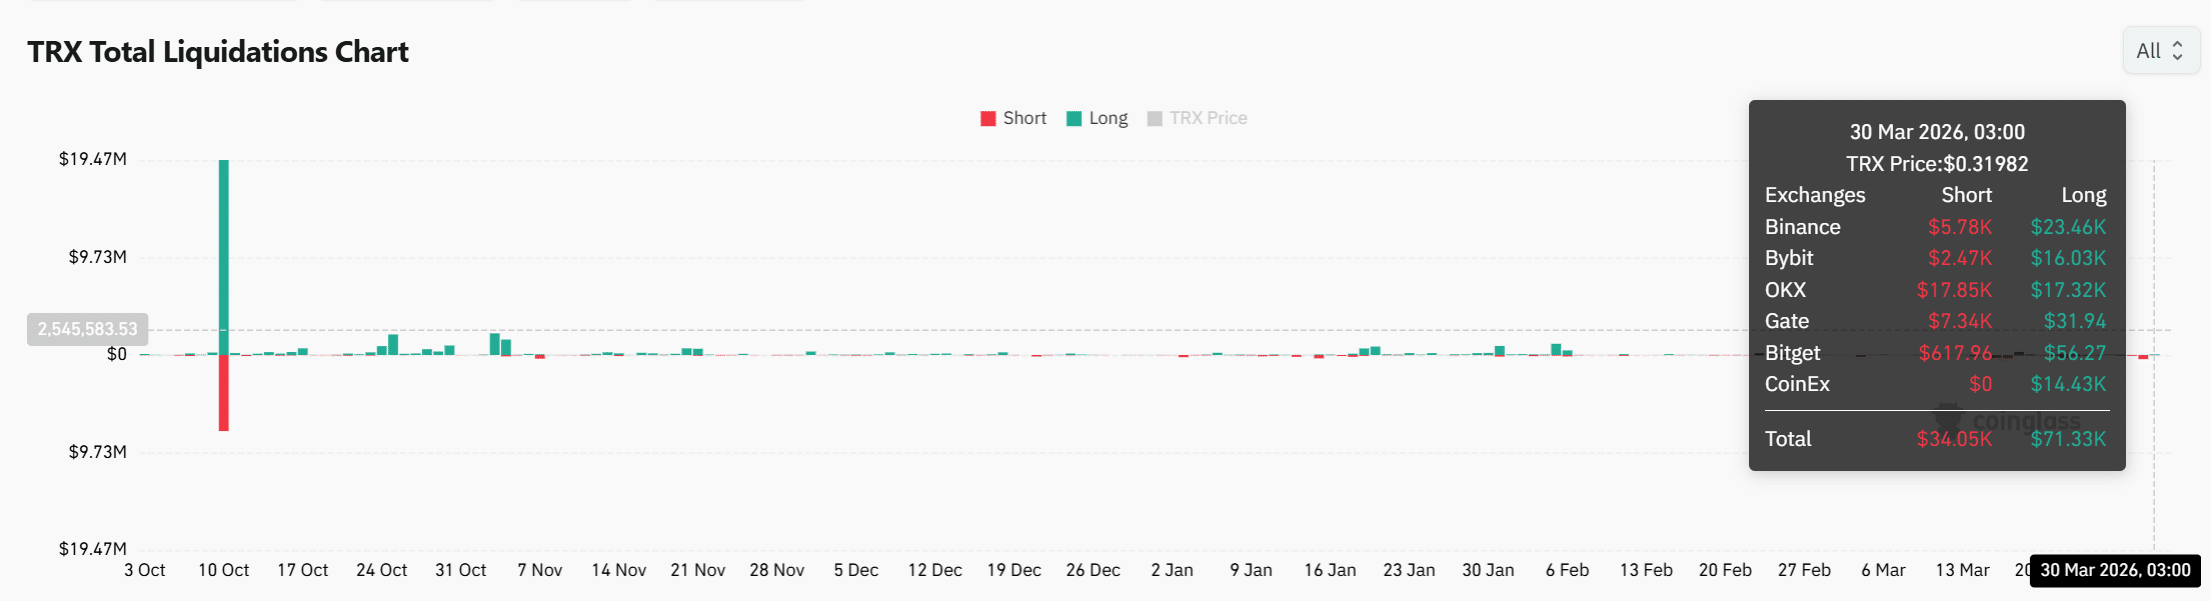
Liquidation data showed long positions absorbed the most recent wipes. About $71.33K in longs cleared, compared to $34.05K in shorts.

This imbalance indicated volatility flushed overleveraged long positions.

That reset reduced excessive leverage across the market. As a result, the structure appeared cleaner, with fewer crowded positions.

This often creates a more stable environment for continuation. Even so, aggressive leverage buildup could bring volatility back.

For now, the liquidation profile suggested a stabilized market.

Source: CoinGlass

TRX has shown strong alignment between rising network activity and improving price structure, which suggests underlying strength continues building.

However, resistance at $0.322 remains the defining barrier.

If buyers sustain pressure and absorb exchange inflows, a breakout would likely follow. Otherwise, price may continue consolidating as fundamentals gradually catch up.


Final Summary

  • Strong network growth continues supporting TRX, yet price still faces pressure near a key resistance zone.
  • Price structure remains bullish, but rising exchange inflows could slow momentum before any sustained breakout attempt.

Preguntas relacionadas

QWhat was the percentage increase in TRON's Total Value Locked (TVL) over the past month, and what does it signal?

ATRON recorded an 11.32% rise in Total Value Locked (TVL) over the past month, signaling steady capital retention.

QHow many active addresses and daily fees did the TRON network have, and what did this activity level indicate?

AThe TRON network had 2.62 million active addresses and $1.06 million in daily fees, which placed it ahead of competing chains and reflected sustained demand building across the ecosystem.

QWhat is the key resistance level for TRX's price mentioned in the article, and what is required for a confirmed breakout?

AThe key resistance level for TRX is $0.322. A move above this level would confirm strength and a likely breakout.

QWhat did the shift to positive Spot Netflows indicate about trader behavior?

AThe shift to positive Spot Netflows, with $1.63 million in inflows, indicated increased exchange deposits and suggested that some traders were preparing to take profits near the resistance level.

QAccording to the liquidation data, which type of positions were cleared more, and what was the implication for the market?

ALong positions were cleared more, with $71.33K in longs compared to $34.05K in shorts. This indicated that volatility flushed overleveraged long positions, which reduced excessive leverage and created a more stable market environment.

Lecturas Relacionadas

Will the Next Crypto Bull Run Start with On-Chain Trading of SpaceX?

This article presents a scenario-based forecast for the crypto industry from 2026 to 2029, arguing that the next major cycle will be driven not by technological narratives but by legal access to real-world assets. The author predicts that by mid-2026, pre-IPO perpetual contracts for top private companies like SpaceX, OpenAI, and Anthropic on platforms like Hyperliquid will become the primary gateway for accessing quality assets, as most crypto-native tokens fail to capture real value. The much-hyped AI x Crypto intersection largely fails except for prediction markets, which thrive on betting on AI model supremacy. By 2027, public blockchain foundations are forced to choose between catering to retail speculation or building compliant infrastructure for institutions, with many opting for the latter. Growth in stablecoins and tokenized private credit/equity hits a "triple ceiling" due to regulatory and political uncertainty rather than market demand. The pivotal shift is forecast for 2028. A major liquidation event in pre-IPO perpetuals exposes the structural flaw of synthetic markets lacking a real underlying asset anchor. In response, regulatory changes finally allow the public solicitation of private securities resales to verified accredited investors. This creates a legitimate secondary market for real company equity, which then becomes the core asset class of the new bull market, relegating synthetic perps to a niche role. By 2029, the industry becomes "boring" but foundational. Tokens without claims on real cash flows or assets cease trading. Stablecoin growth is steady but politically capped. Crypto infrastructure fades from view as it gets absorbed into traditional finance backends. The article's central thesis is that the key bottleneck for crypto's next phase is legal and regulatory channels for real asset ownership, not technology.

marsbitHace 38 min(s)

Will the Next Crypto Bull Run Start with On-Chain Trading of SpaceX?

marsbitHace 38 min(s)

The Value Distribution of Stablecoins

**Summary: The Value Distribution of Stablecoins** The article argues that stablecoins are evolving from mere trading tools into broader channels for dollar access. It divides the stablecoin ecosystem into four layers to analyze how value is distributed: 1. **Issuance Layer:** Mints stablecoins, holds reserve assets, and captures the spread between reserve yield and user costs (e.g., Tether, Circle). This layer currently earns the largest profit margin. 2. **Infrastructure Layer:** Connects stablecoins to the traditional financial system, handling fiat on/off-ramps, banking integration, compliance (KYC/AML), and asset management (e.g., Bridge, BVNK). This is the "unglamorous" but critical work, building the essential bridges between crypto and real-world finance. 3. **Acquiring/Distribution Layer:** Integrates stablecoins into merchant systems, manages payment flows, and provides enterprise financial software (e.g., Stripe, Coinbase). They act as the access point for businesses. 4. **Application Layer:** The end-users and businesses that ultimately use stablecoins for payments, settlements, or as a store of value. They benefit from convenience but have little pricing power. The core thesis is that while the issuance layer currently dominates profits, the often-overlooked **infrastructure layer holds significant long-term potential**. The real challenge and barrier to mass adoption is not the on-chain transfer of stablecoins (which is simple), but the complex "last mile" integration into existing business workflows, banking systems, and regulatory frameworks across different countries. Companies in this layer are currently in a "land grab" phase, investing heavily to build networks, secure bank partnerships, and establish compliance pathways. While their position is currently pressured by the profitable issuers above and distribution platforms below, the article suggests that if stablecoins become a default financial rail for businesses, the infrastructure providers who have done the hard work of integration will ultimately gain strong pricing power and become entrenched, essential players.

marsbitHace 7 hora(s)

The Value Distribution of Stablecoins

marsbitHace 7 hora(s)

The Value Distribution of Stablecoins

The Value Distribution of Stablecoins The article argues that stablecoins are evolving from a mere trading tool into a broad "dollar channel." It analyzes the industry's value chain through four layers: 1. **Issuance Layer (e.g., Tether, Circle):** The top layer that mints stablecoins, holds reserve assets, and captures the thickest interest rate spread. 2. **Infrastructure Layer (e.g., Bridge, BVNK):** Connects stablecoins to the traditional financial system, handling critical but complex "dirty work" like fiat on/off-ramps, banking integration, compliance (KYC/AML), and cross-border settlement. 3. **Acquiring/Distribution Layer (e.g., Stripe, Coinbase):** Embeds stablecoins into merchant systems, manages payment flows, and integrates with enterprise software. 4. **Application Layer:** End-users and businesses that ultimately use stablecoins for payments, settlement, or storing value. The author posits that while the issuance layer currently captures the most profit, the most overlooked and potentially critical layer is infrastructure. The core challenge for stablecoin adoption isn't the on-chain transfer (which is simple), but bridging the gap between blockchain and the real-world financial system. This involves solving practical problems for businesses: fiat conversion, reconciliation, tax handling, and user onboarding. Infrastructure companies are currently in a difficult "land-grab" phase—building networks, securing banking relationships, and achieving compliance country-by-country. They face pressure from both the profitable issuance layer above and distribution platforms below. However, the author suggests this layer is building a crucial moat. Once stablecoins become a default business rail, the infrastructure players who have done the hard work of integration may gain significant, durable value and pricing power.

链捕手Hace 7 hora(s)

The Value Distribution of Stablecoins

链捕手Hace 7 hora(s)

Trading

Spot
Futuros

Artículos destacados

Cómo comprar TRX

¡Bienvenido a HTX.com! Hemos hecho que comprar TRON (TRX) sea simple y conveniente. Sigue nuestra guía paso a paso para iniciar tu viaje de criptos.Paso 1: crea tu cuenta HTXUtiliza tu correo electrónico o número de teléfono para registrarte y obtener una cuenta gratuita en HTX. Experimenta un proceso de registro sin complicaciones y desbloquea todas las funciones.Obtener mi cuentaPaso 2: ve a Comprar cripto y elige tu método de pagoTarjeta de crédito/débito: usa tu Visa o Mastercard para comprar TRON (TRX) al instante.Saldo: utiliza fondos del saldo de tu cuenta HTX para tradear sin problemas.Terceros: hemos agregado métodos de pago populares como Google Pay y Apple Pay para mejorar la comodidad.P2P: tradear directamente con otros usuarios en HTX.Over-the-Counter (OTC): ofrecemos servicios personalizados y tipos de cambio competitivos para los traders.Paso 3: guarda tu TRON (TRX)Después de comprar tu TRON (TRX), guárdalo en tu cuenta HTX. Alternativamente, puedes enviarlo a otro lugar mediante transferencia blockchain o utilizarlo para tradear otras criptomonedas.Paso 4: tradear TRON (TRX)Tradear fácilmente con TRON (TRX) en HTX's mercado spot. Simplemente accede a tu cuenta, selecciona tu par de trading, ejecuta tus trades y monitorea en tiempo real. Ofrecemos una experiencia fácil de usar tanto para principiantes como para traders experimentados.

1.8k Vistas totalesPublicado en 2024.12.10Actualizado en 2026.06.02

Cómo comprar TRX

Discusiones

Bienvenido a la comunidad de HTX. Aquí puedes mantenerte informado sobre los últimos desarrollos de la plataforma y acceder a análisis profesionales del mercado. A continuación se presentan las opiniones de los usuarios sobre el precio de TRX (TRX).

活动图片