Triple Smoothing: All the Nuances of Using TRIX in Crypto Trading

cryptonews.ruPublicado a 2026-08-22Actualizado a 2026-08-22

Resumen

The article "Triple Smoothing: All the Nuances of Using TRIX in Crypto Trading" explains the TRIX indicator. TRIX is a triple exponential smoothing of moving averages, introduced in the 1980s by Jack Hutson to reduce lagging signals. Its calculation involves three sequential EMA calculations, followed by finding the percentage change between the final EMA values. The primary trading signals from TRIX are: 1. Zero-line crossover: Crossing above indicates a bullish trend, crossing below indicates a bearish one. 2. Signal line crossover: Similar logic applies when TRIX crosses its signal line (though TradingView lacks this feature). 3. Divergence: A bearish divergence occurs when price makes a higher high but TRIX makes a lower high, signaling a potential trend reversal, and vice versa for bullish divergence. The article notes that despite extensive smoothing to eliminate market noise, TRIX has drawbacks. It can still be lagging, filter out crucial information, and produce false signals, especially during consolidation periods. Therefore, its signals require confirmation from other technical or fundamental analysis tools. In summary, TRIX is a hybrid trend/oscillator indicator whose core strength—triple smoothing—is also its main weakness, as it creates a trade-off between noise reduction and responsiveness.

Analyzing cryptocurrency charts rarely happens without moving averages. There are standard options: simple (SMA), exponential (EMA), and weighted (WMA). Unusual varieties also exist. One such example is the Triple Exponential Smoothing Moving Average, or simply TRIX. It is used in an attempt to avoid lagging signals.

TRIX was first introduced in the 1980s by Jack Hutson, the editor of the magazine Technical Analysis of Stocks & Commodities. What formula did he use as the basis for the indicator?

Calculating TRIX

TRIX is calculated in four stages.

  1. The first stage determines the exponential moving average (EMA1) for the required number of periods (n).

  2. The second stage calculates the EMA (EMA2) from the values obtained in the initial stage.

  3. The third stage calculates the exponential average (EMA3) from the results of the previous stage.

  4. At the final stage, the percentage change between EMA3 on the last time segment and the one preceding it is calculated.

As a result, the following formula is obtained:

TRIX = (EMA3i – EMA3(i-1))/ EMA3(i-1)*100%,

where EMA3i is the exponential average calculated at the third stage for the last time segment;

EMA3(i-1) is the exponential average calculated at the third stage for the time segment preceding the last by one unit.

In modern conditions, manual calculation is not necessary. The determination of the TRIX value occurs automatically on any trading platform. The only thing a trader needs to do is determine the number of periods for the calculation.

Don't be surprised if, on some services, besides the main TRIX line, the indicator also has another line — the signal line. It represents another smoothing performed on the main line but with a different number of periods. Using the signal line helps eliminate unnecessary noise — chaotic tendencies that do not provide traders with useful information.

Having understood the mathematical side of TRIX, let's move on to its direct use in real cryptocurrency trading.

TRIX Signals

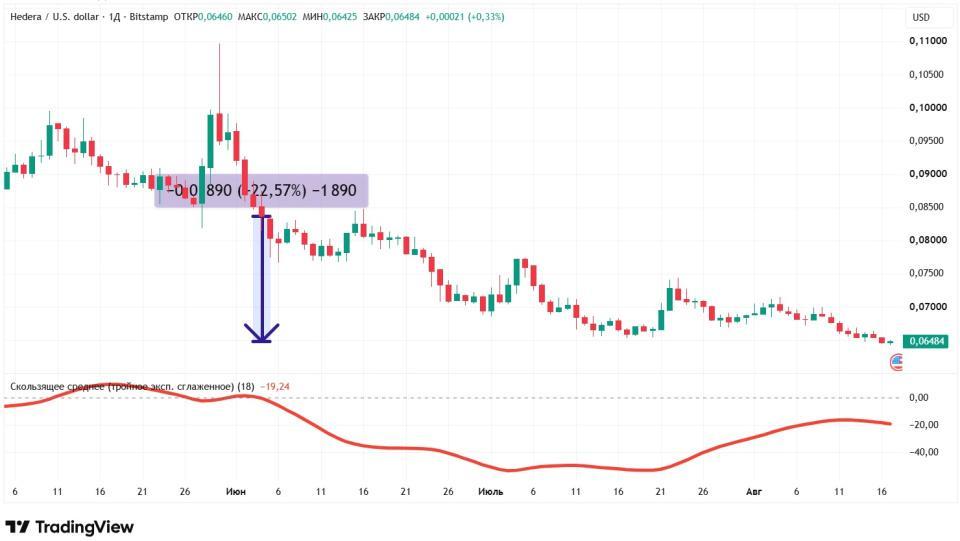
The first and simplest trading signal of the indicator is the crossing of the zero line. If TRIX crosses it from bottom to top, the trend is bullish; if from top to bottom, it's bearish. For example, on the daily chart of the cryptocurrency Hedera, the indicator was below zero on June 4. Since then, the indicator has not risen above this level once. Over 2.5 months, HBAR fell by 22.57%.
Source: tradingview.com

There is also a signal line crossover signal. The meaning is similar: if TRIX is above, an upward impulse is observed; if below, a downward one. Unfortunately, in the functionality on the TradingView portal, the signal line is absent in the TRIX indicator.

Another signal provided by the analytical tool is divergence. It represents a discrepancy between the price and the indicator's data. If TRIX is rising while the price is falling, it's called a bullish divergence; if the opposite occurs, it's a bearish divergence.

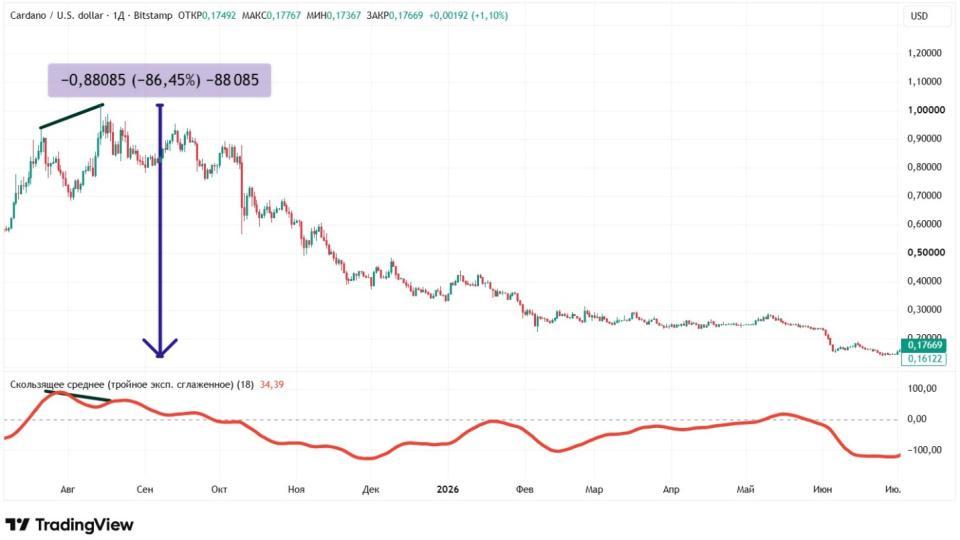
For example, on the daily chart of Cardano in August 2025, the price high from July was renewed. However, TRIX showed a lower value. A bearish divergence emerged. Ten months later, by June 2026, Cardano had collapsed by 86.45%.
Source: tradingview.com

Although in the shown examples TRIX worked almost perfectly, this is not always the case. The indicator has its drawbacks.

Disadvantages of TRIX

Despite the fact that triple smoothing allows getting rid of a significant amount of noise, it often eliminates important information as well. This leads to the lagging nature of the indicator. In other words, TRIX provides the necessary signal noticeably later than the price movement.

Another disadvantage of the indicator is false signals. This especially applies to consolidation zones, where the TRIX line may repeatedly cross the zero level in various directions.

The third shortcoming stems from the second — one cannot rely solely on the signals of the triple exponential smoothing moving average. All of them require confirmation from other tools of technical and/or fundamental analysis.

Conclusion

TRIX is a technical analysis indicator that combines features of an oscillator and a trend identification tool. The indicator is based on multiple smoothing. However, the result is twofold. On one hand, it allows getting rid of a lot of noise; on the other hand, it causes TRIX to lag.

This material and the information within are not individual or any other form of recommendation. The opinion of the editorial board may not coincide with the opinions of analytical portals and experts.

end-content

Preguntas relacionadas

QWhat is TRIX, and what problem in trading does it aim to address?

ATRIX is the triple exponential smoothed moving average. It aims to reduce or avoid the issue of lagging signals commonly associated with standard moving averages.

QWhat are the four basic steps involved in calculating the TRIX indicator?

A1. Calculate an exponential moving average (EMA1) for the specified number of periods (n). 2. Calculate an EMA (EMA2) from the values obtained in step one. 3. Calculate an exponential moving average (EMA3) from the result of step two. 4. Calculate the percentage change between the EMA3 value on the current period and the one preceding it.

QWhat are two types of trading signals generated by the TRIX indicator?

ATwo main signals are: 1. The crossover of the TRIX line above or below the zero line, indicating a bullish or bearish trend. 2. Divergence, where the TRIX indicator moves in the opposite direction of the price, signaling a potential reversal (bullish or bearish divergence).

QWhat are two main drawbacks of the TRIX indicator mentioned in the article?

AThe two main drawbacks are: 1. A lagging character, as the triple smoothing often removes important information along with noise, causing signals to appear later than the price move. 2. The generation of false signals, especially in consolidation zones where the indicator line might cross the zero level multiple times without a clear trend direction.

QAccording to the article, what must traders do with signals from the TRIX indicator?

ATraders cannot rely solely on TRIX signals. All signals require confirmation from other tools of technical and/or fundamental analysis.

Lecturas Relacionadas

Vitalik Moves to Local Mixing as Obfuscation Series Reaches Third Stage

Ethereum co-founder Vitalik Buterin published the third part of his series on cryptographic obfuscation, focusing on a method called "local mixing." This method abandons lattices and elliptic curves in favor of ideas borrowed from hash function design. Buterin described local mixing as a "completely different way of cryptography," free from elliptic curves, prime factorization, and lattices, making it more akin to symmetric cryptography used in everyday encryption. The process begins with a circuit of logic gates like XOR, AND, and NOT. It undergoes a pipeline that ensures a correct output while obscuring any trace of the internal logic. Key steps include adding reversibility, strengthening, mechanization, mixing, and finally obfuscation. The mixing step scatters extra logic gates and shuffles their arrangement. Reversibility is foundational, allowing gates to be rewritten as other reversible gates with similar behavior. Buterin acknowledged local mixing is a "wild and risky undertaking," lying on the "graveyard of failed attempts at white-box cryptography." However, its proponents argue it needs more research effort and a willingness to accept higher overhead costs. Buterin suggested AI could accelerate its development. He called obfuscation the "final boss of cryptography," with the most complex constructions having runtimes exceeding the universe's age. The article concludes by explaining obfuscation's utility: it can encrypt a program so it still functions with normal inputs and outputs while hiding the code. Combined with blockchain, this moves toward a "trusted third party that requires no trust," enabling applications like private, collusion-resistant voting without relying on a trusted committee.

cryptonews.ruHace 32 min(s)

Vitalik Moves to Local Mixing as Obfuscation Series Reaches Third Stage

cryptonews.ruHace 32 min(s)

India Orders Closure of Hundreds of Google Firebase Accounts Used in Banking Frauds

India's cybercrime agency ordered Google to block hundreds of accounts on its Firebase app development platform. The move came after investigators traced numerous fake banking apps and phishing websites to the service. The Indian Cyber Crime Coordination Centre (I4C) sent multiple notices to Google, identifying at least 57 websites and databases on Firebase allegedly used to distribute malware and steal victims' financial data. Among these, seven were phishing pages mimicking login screens of major Indian banks like State Bank of India, ICICI Bank, and Axis Bank. The rest were reportedly data collection points for stolen information like credit card numbers and one-time passwords. The fraud scheme involved Android malware disguised as legitimate banking apps, luring victims with promises of new credit cards, rewards, or credit limit increases. Once installed, the app secretly forwarded device data to a Firebase database controlled by scammers, granting them access to other apps and the victim's funds. One scam specifically targeted beneficiaries of a government farmer aid program. This action marks a shift in India's approach. Previously focused on blocking individual fraudulent websites, authorities are now targeting the broader infrastructure enabling these scams. The move highlights how fraudsters exploit widely accessible platforms like Firebase, attracted by its free tier and database capabilities, to target India's vast digital payment user base.

cryptonews.ruHace 34 min(s)

India Orders Closure of Hundreds of Google Firebase Accounts Used in Banking Frauds

cryptonews.ruHace 34 min(s)

Trading

Spot
活动图片