Token Watch, Based on RootData, Launches Interactive Relationship Graph for Projects, Investors, and Key Figures

marsbitPublicado a 2026-07-27Actualizado a 2026-07-27

Resumen

Token Watch, operated by Token Post, has launched a new "Interactive Relationship Graph" feature. This tool visually maps the connections between cryptocurrency projects listed on the Korean Won market, their investors, and key individuals. The graph allows users to explore investment backgrounds, see which investors co-invest in other projects, and track the past and present affiliations of core team members. Key features include the ability to filter by project, investor, or person, and to view different relationship types: general investment, lead investment, current affiliation, and past affiliation. A focus mode lets users isolate connections within two degrees of a selected node for clearer analysis. The graph is designed to help users identify co-investors, frequent VC partnerships, investor overlap between competing projects, and recurring key figures across the ecosystem. The underlying data for investors and individuals is sourced from RootData, with some verification by the Token Post editorial team. The web-based tool is available in both Korean and English. Token Watch emphasizes that the information is for reference and analysis purposes only and does not constitute investment advice.

Author: Han Jae-ho

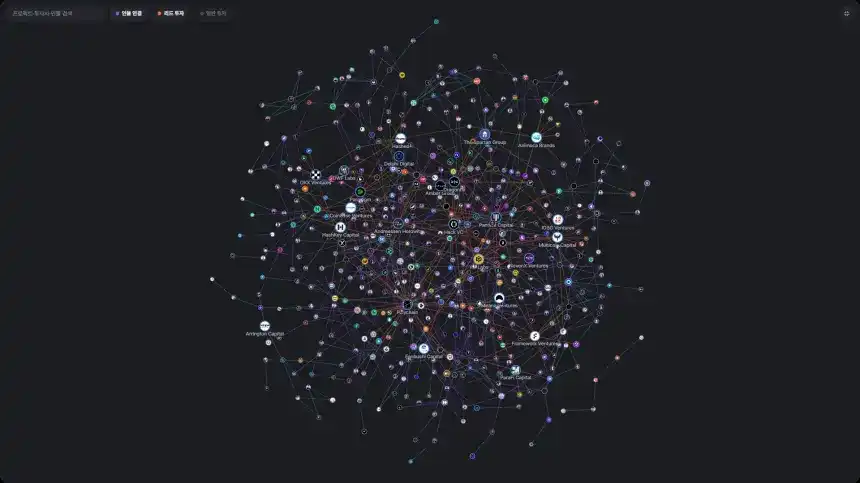
The cryptocurrency asset data platform "Token Watch," operated by Token Post, has unveiled an "Interactive Relationship Graph" feature that allows users to see the interconnected structure between projects, investors, and key figures at a glance.

This newly added relationship graph is a function that visually displays how investors and key individuals are connected, centering on cryptocurrency asset projects listed in the Korean won market. Users can not only check the investment background of a single project but also explore other projects participated in by the same investor and the past and present affiliations of individuals within the same screen.


Currently, the relationship graph shows the top 30 investors by portfolio and key figures confirmed across multiple projects. Users can directly search for projects, investors, or individuals, or filter by type to extract only the desired relationships.

The connecting lines are divided into ▲ General Investment ▲ Lead Investor ▲ Current Affiliation ▲ Past Affiliation. Through this classification, users can confirm not only which investors participated in a specific project but also who led the investment round, and the organizations with which key figures are currently or were previously associated.
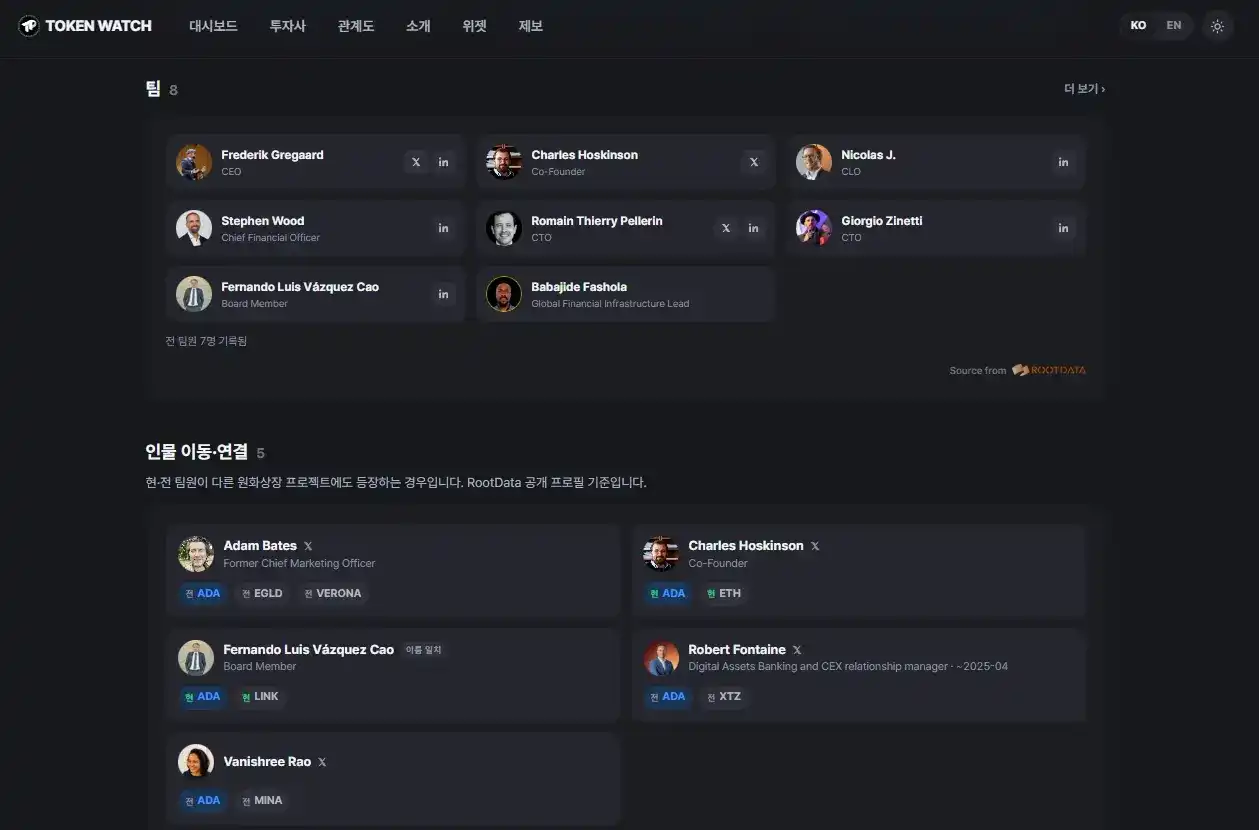
For example, selecting a specific project will display the investors in that project and related individuals. Conversely, with an investor as the center, users can view that investor's portfolio of Korean won-listed projects and co-investment relationships with other investors.

After clicking on a node, using the "View Centered on This Node" function allows users to keep only connections within two degrees of separation from the selected object. Even when the overall network appears complex, this enables quick focus on a specific project or investor, narrowing down to the core relationships. The feature also supports node dragging and screen zooming.

With this relationship graph, Token Watch moves beyond simple investor lists, allowing users to three-dimensionally explore the capital and human networks within the cryptocurrency asset market.


This feature can be used to grasp information that was difficult to confirm previously with just a project's published investor logos, such as:

  • Co-investors

  • Frequent VC co-investor combinations

  • Investor overlap between competing projects

  • Core individuals recurring across multiple projects

Particularly for investors, it can serve as a reference to verify the background of projects of interest; for journalists and researchers, it can be a tool for interviews and analysis to uncover hidden commonalities between projects; and for industry professionals and business developers, it can be used to examine connection paths between projects, investors, and key figures.
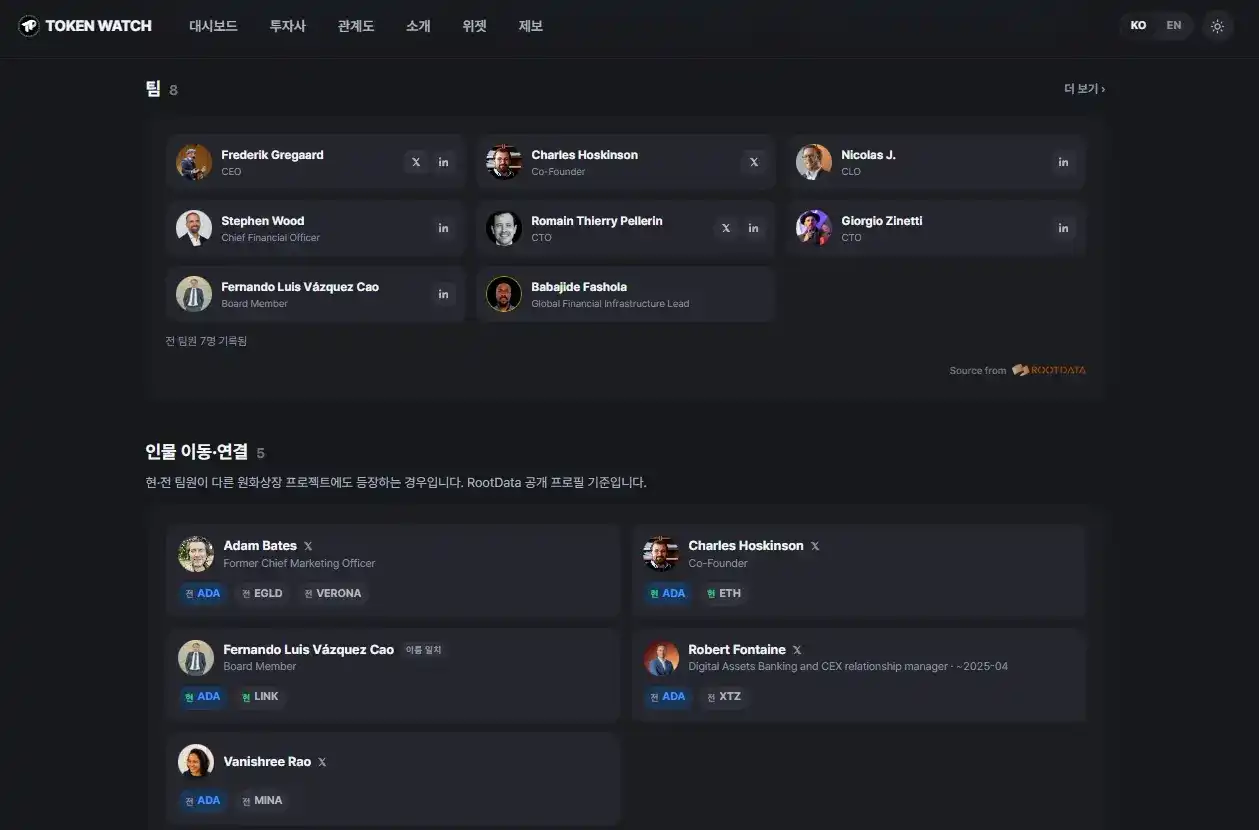
The investor and individual data used in the relationship graph is based on RootData, and some information (such as whether a project has responded) is based on records from the Token Post editorial department. Regarding individual relationships, to reduce erroneous connections of the same person, associations are made only when X account IDs match or two or more full names match.

The Token Watch relationship graph requires no additional installation and can be used directly on the web, supporting both Korean and English interfaces.

A representative from Token Post stated: "To understand a cryptocurrency asset project, one must not only look at price and listing information but also understand which capital and individuals are connected behind the project. We will continue to optimize the relationship graph so that dispersed investment and individual information can be explored intuitively."

Simultaneously, Token Watch states that the information displayed in the relationship graph may differ from the actual latest status due to variations in collection and verification timing. All data is for reference only and does not constitute investment advice.


This article is written based on market data and chart analysis and does not constitute investment advice for specific projects.

Criptos en tendencia

Preguntas relacionadas

QWhat is the main function of the 'Interaction Relationship Map' feature launched by Token Watch?

AToken Watch launched an 'Interaction Relationship Map' feature that visually displays the interconnected structure between cryptocurrency projects, their investors, and key personnel. It allows users to see investment backgrounds, explore other projects funded by the same investor, and track the past and present affiliations of core individuals.

QWhat types of relationship lines are distinguished in the Token Watch Relationship Map?

AThe relationship lines in the map are categorized into four types: General Investment, Lead Investment, Current Affiliation, and Former Affiliation. This categorization helps users understand not only who invested in a project but also who led the investment round and the past/current organizational ties of key people.

QBased on which data provider is the investor and personnel information in the Relationship Map primarily built?

AThe investor and personnel data used in the Relationship Map is based on the data platform RootData. Additional information, such as whether a project has responded to inquiries, is based on records from the Token Post editorial team.

QWhat practical uses does the article list for the new Relationship Map feature?

AThe article lists several practical uses for the feature: identifying co-investors, spotting frequently co-investing VC combinations, observing investor overlap between competing projects, and recognizing key personnel who appear across multiple projects. It serves as a reference for investors, a research tool for journalists, and a way for professionals to explore connection paths.

QHow does the feature handle privacy and data accuracy according to the article?

ATo reduce incorrect links for individuals, connections are only made when X (formerly Twitter) accounts match or when two or more full names are identical. Token Watch also notes that the information may differ from the latest actual status due to collection and verification timing, and all data is for reference only, not constituting investment advice.

Lecturas Relacionadas

Wall Street Traders Shift Crypto Market Activity to Weekdays

For decades, Wall Street adhered to a strict Monday-Friday schedule, a rhythm initially challenged but not fully overturned by the 24/7 nature of cryptocurrencies. However, institutional adoption is now fundamentally reshaping crypto market dynamics, shifting most price discovery and trading activity to traditional U.S. market hours (9:30 AM - 4:00 PM ET). According to Kaiko Research, weekend trading volume has fallen from roughly 25% to about 16% of the total. This concentration creates a significant "liquidity vacuum" on weekends when institutional support withdraws. Analysis by BridgePort shows the market becomes more vulnerable: trading costs rise by an average of 11% due to wider spreads, market depth for $100k trades worsens by nearly 9%, and displayed liquidity drops over 5%. Consequently, smaller trades can trigger sharper price swings. The massive success of U.S. spot Bitcoin ETFs has been a key driver of this structural shift. While providing steady weekday demand, their complete inactivity on weekends exacerbates the liquidity gap. Large capital movements, like the over $0.5 billion withdrawn from U.S. spot ETFs since October 2023, are easily absorbed on weekdays but can cause significant turbulence on thinner weekends. Ultimately, weekend trading now requires heightened caution due to a "thin" market, absent major market makers, and multiplied risks of sudden price jumps and slippage. Understanding these hidden liquidity mechanisms has become crucial for navigating the new financial reality.

cryptonews.ruHace 15 min(s)

Wall Street Traders Shift Crypto Market Activity to Weekdays

cryptonews.ruHace 15 min(s)

Trading

Spot

Artículos destacados

Cómo comprar DATA

¡Bienvenido a HTX.com! Hemos hecho que comprar DATA Network (DATA) sea simple y conveniente. Sigue nuestra guía paso a paso para iniciar tu viaje de criptos.Paso 1: crea tu cuenta HTXUtiliza tu correo electrónico o número de teléfono para registrarte y obtener una cuenta gratuita en HTX. Experimenta un proceso de registro sin complicaciones y desbloquea todas las funciones.Obtener mi cuentaPaso 2: ve a Comprar cripto y elige tu método de pagoTarjeta de crédito/débito: usa tu Visa o Mastercard para comprar DATA Network (DATA) al instante.Saldo: utiliza fondos del saldo de tu cuenta HTX para tradear sin problemas.Terceros: hemos agregado métodos de pago populares como Google Pay y Apple Pay para mejorar la comodidad.P2P: tradear directamente con otros usuarios en HTX.Over-the-Counter (OTC): ofrecemos servicios personalizados y tipos de cambio competitivos para los traders.Paso 3: guarda tu DATA Network (DATA)Después de comprar tu DATA Network (DATA), guárdalo en tu cuenta HTX. Alternativamente, puedes enviarlo a otro lugar mediante transferencia blockchain o utilizarlo para tradear otras criptomonedas.Paso 4: tradear DATA Network (DATA)Tradear fácilmente con DATA Network (DATA) en HTX's mercado spot. Simplemente accede a tu cuenta, selecciona tu par de trading, ejecuta tus trades y monitorea en tiempo real. Ofrecemos una experiencia fácil de usar tanto para principiantes como para traders experimentados.

128 Vistas totalesPublicado en 2026.07.01Actualizado en 2026.07.01

Cómo comprar DATA

Discusiones

Bienvenido a la comunidad de HTX. Aquí puedes mantenerte informado sobre los últimos desarrollos de la plataforma y acceder a análisis profesionales del mercado. A continuación se presentan las opiniones de los usuarios sobre el precio de DATA (DATA).

活动图片