Author: David, Shenchao TechFlow
Original Title: When Rate Cuts Become Consensus, Could the Market 'Exhaust the Good News' and Go Silent?
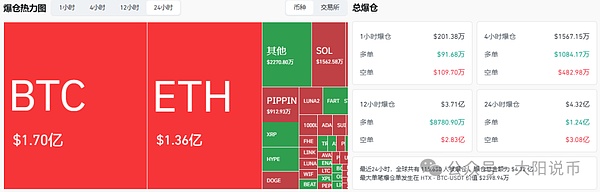
This Thursday (Beijing time), the Federal Reserve will announce its final interest rate decision of the year. Market expectations are very consistent:
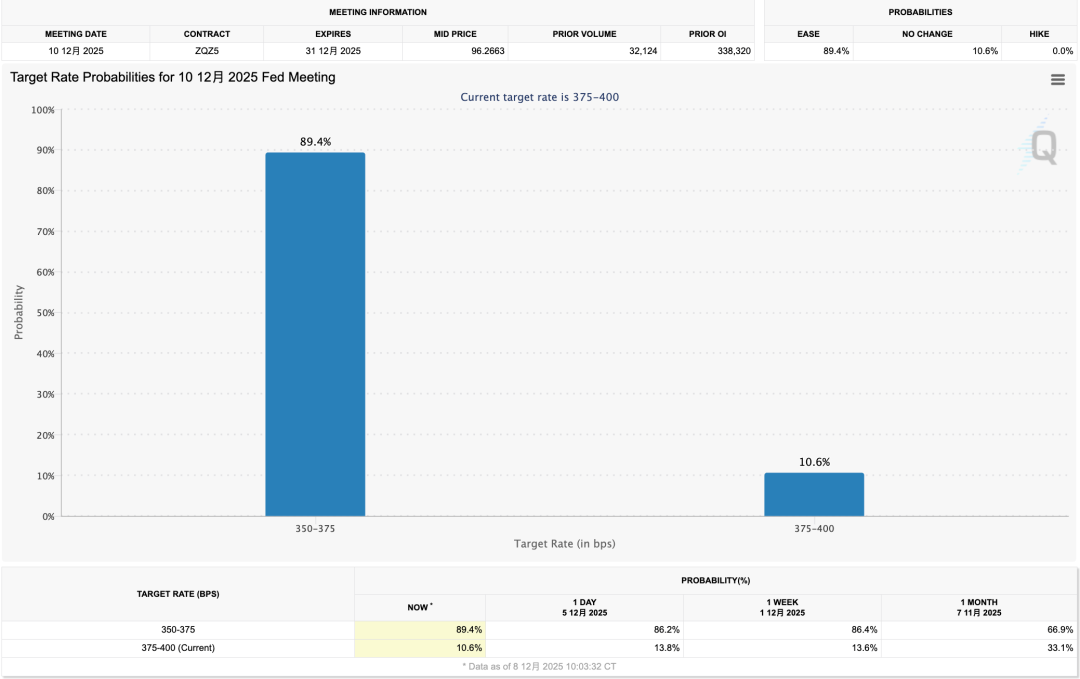
According to CME FedWatch data, the probability of a 25 basis point rate cut exceeds 85%.
If implemented, this would be the third consecutive rate cut since September, bringing the federal funds rate down to the 3.5%-3.75% range.
For crypto investors accustomed to the "rate cut = positive" narrative, this sounds like good news.
But the problem is, when everyone expects a rate cut, the cut itself ceases to be a market-moving factor.
Financial markets are expectation machines. Prices reflect not "what happened," but "what happened relative to expectations."
An 85% probability means the rate cut is already fully priced in; when it is officially announced early Thursday, unless there is a surprise, the market will not react significantly.
So what is the real variable?
The Fed's attitude towards next year. A 25 basis point cut is basically certain, but how long the rate-cutting cycle can last and how many more cuts are possible in 2026—these are the things the market is truly betting on.
Early Thursday, the Fed will simultaneously update its forecasts for the future interest rate path, and this forecast often influences market direction more than the immediate rate cut decision.
But there's an additional problem this time: the Fed itself might not see things clearly either.
The reason is that from October 1 to November 12, the U.S. federal government was shut down for 43 days. During this period, statistical agencies suspended work, leading to the cancellation of the October CPI release and the postponement of the November CPI to December 18, a full week after this week's FOMC meeting.
This means that Fed officials are discussing the interest rate outlook without the inflation data from the last two months.
When policymakers themselves are groping in the dark, the guidance they provide will be more ambiguous, and ambiguity often means greater potential for market volatility.
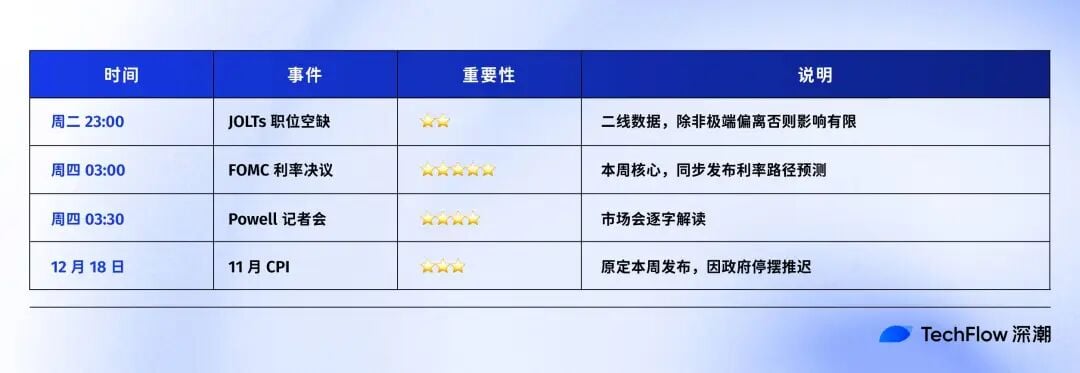
Let's look at this week's timeline:
We can analyze specifically what signals the Fed might give and what kind of market reaction each would correspond to.
Betting on Next Year's Outlook
After each FOMC meeting, the Fed releases a "Summary of Economic Projections" (SEP).
It includes a chart showing all Fed officials' expectations for future interest rates.
Each official plots a dot indicating where they think the interest rate should be at the end of the year. Because it looks like a scatter plot of dots, the market习惯 calls it the "dot plot." You can find the original dot plots from previous meetings on the Federal Reserve website.
The chart below is the dot plot released during the September 17 FOMC meeting.
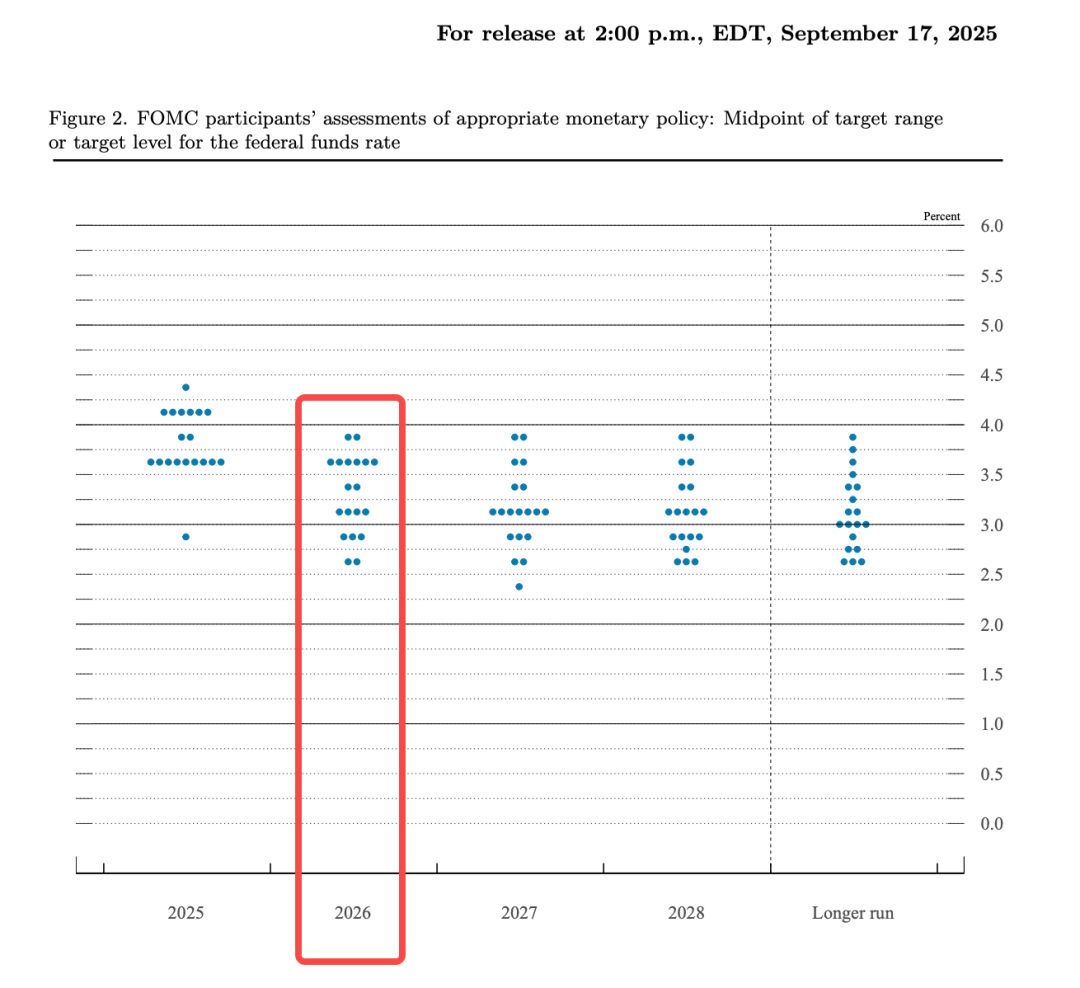
It shows the divergence and consensus within the Fed. If the dots are clustered together, it means the officials are in agreement, and the policy path is relatively clear;
If the dots are widely scattered, it indicates internal disagreement and future uncertainty.
For the crypto market, uncertainty itself is a risk factor. It suppresses risk appetite, making funds倾向于观望 (lean towards watching) rather than entering the market.
From the chart, we can see that the dots for the 2025 column are mainly in two areas: around 3.5%-3.625% with about 8-9 dots, and around 3.75%-4.0% with 7-8 dots. This shows the committee is split into two camps:
One camp believes there should be 1-2 more cuts this year, while the other believes they should pause or only cut once. The median falls around 3.6%, meaning the baseline expectation for the majority is 2 more cuts within 2025 (including this week's).
Looking further at 2026, the divergence among Fed members is even greater.
The current rate is 3.75%-4.00%. If it drops to around 3.4% by the end of next year, it implies only 1-2 cuts for the full year. But looking at the chart, some officials believe it should drop to 2.5% (equivalent to 4-5 cuts), while others think it should remain at 4.0% (no cuts at all).
Within the same committee, the most aggressive and most conservative expectations differ by a space of 6 rate cuts. This is a "highly divided" Federal Reserve Committee.
This division is itself a signal.
If the Fed itself can't agree, the market will naturally vote with its feet. Currently, traders' bets are more aggressive than the official guidance. CME FedWatch shows the market is expecting 2-3 rate cuts in 2026, while the official dot plot median shows only 1.
Therefore, this week's FOMC meeting is, to some extent, a "synchronization of watches" between the Fed and the market. Will the Fed move closer to the market, or stick to its own pace?
Three Scenarios, Three Reactions
Based on current information, this week's FOMC could roughly go one of three ways.
The most likely scenario is "in line with expectations": a 25bp cut, the dot plot maintains the guidance from the last September meeting, and Powell repeatedly emphasizes "data dependence" in the press conference without giving a definite direction.
In this case, the market won't fluctuate much. Because the cut is priced in, the guidance is unchanged, and there is a lack of new trading signals. The crypto market will likely follow U.S. stocks in slight fluctuations before returning to its original trend.
This is also the baseline expectation of most Wall Street institutions, including recent reports from Goldman Sachs and Raymond James pointing in this direction.
The next possible scenario is "dovish-leaning": a 25bp cut, but the dot plot shows the possibility of 2 or even more cuts in 2026, with Powell's wording being soft, emphasizing that labor market risks outweigh inflation risks.
This would mean the Fed is moving closer to market expectations, confirming an easing path. A weaker dollar would boost dollar-denominated assets, while improved liquidity expectations would boost market sentiment. BTC and ETH could follow U.S. stocks higher, with the former potentially testing recent highs.
The less probable but not impossible scenario is "hawkish-leaning": although cutting 25bp, Powell emphasizes sticky inflation, hinting at limited room for cuts next year; or there are multiple dissenting votes, showing internal resistance to continued easing.
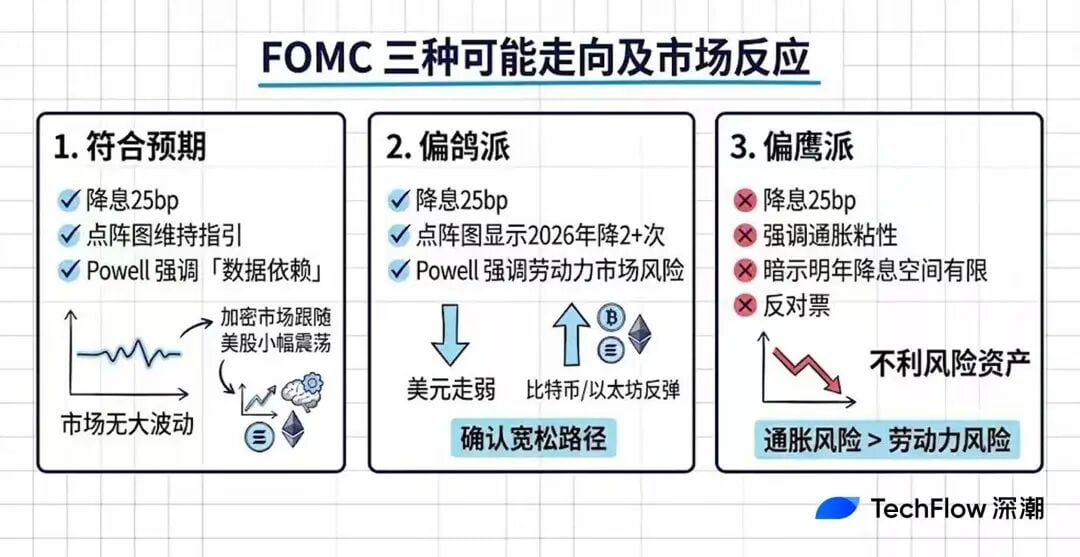
This would tell the market "you've thought too much," the dollar would strengthen, liquidity expectations would tighten, and risk assets would come under pressure. The crypto market could face a short-term pullback, especially high-beta altcoins.
However, if it's just hawkish wording rather than a substantial policy shift, the decline is often limited and might反而 become an entry opportunity.
Normally, the Fed adjusts the dot plot based on the latest data. But this time, they lack two months of CPI due to the government shutdown and must make judgments based on incomplete information.
This leads to several chain reactions. First, the reference value of the dot plot itself is discounted; the officials themselves are uncertain, so the dots they plot might be more scattered.
Second, Powell's press conference will carry more weight; the market will look for directional cues in his every word. If the倾向 (inclination) shown in the dot plot is inconsistent with Powell's tone, the market will be more confused, and volatility could amplify.
For crypto investors, this means the行情 (market movement) early Thursday might be harder to predict than usual.
Rather than betting on direction, it's better to focus on volatility itself. When uncertainty rises, controlling position size is more important than betting on rises or falls.
Tonight's Job Openings Data Isn't as Important as You Think
The前面 (above) discussion was all about Thursday's FOMC, but tonight (Tuesday, 23:00 Beijing Time) there is also data to be released: JOLTs.
On social media, it is occasionally portrayed as very important, like "quietly determining the direction" of liquidity. But honestly, JOLTs doesn't carry much weight among macroeconomic data. If your time is limited, just focus on Thursday's FOMC;
If you want to understand a bit more background information on the labor market, you can read on.
JOLTs stands for Job Openings and Labor Turnover Survey. It is released monthly by the U.S. Bureau of Labor Statistics (BLS) and统计 (statistics) how many job openings U.S. businesses have, how many people they hired, and how many left their jobs.
The most watched metric is the "job openings number": the higher the number, the stronger the corporate demand for hiring and the tighter the labor market.
At its peak in 2022, this number exceeded 12 million, meaning companies were frantically competing for people, wages were rising rapidly, and the Fed was worried this would push inflation higher. Now this number has fallen back to around 7.2 million, basically returning to pre-pandemic normal levels.
Twitter:https://twitter.com/BitpushNewsCN
Bitpush TG Discussion Group:https://t.me/BitPushCommunity
Bitpush TG Subscription: https://t.me/bitpush