US job openings rose to 7.62 million in April, the highest reading in nearly two years and 750,000 above consensus. The 10-year yield pushed back above 4.45% in response, and markets have repriced Fed expectations to more than 50% probability of a rate hike by year-end, with no cuts remaining in the outlook. The DXY is holding above 99. Financial conditions are tightening at the margin, not easing.
Bitcoin has absorbed this shift harder than any other risk asset. Price has declined 13% over the past week to the $67,000 range. US spot ETFs have recorded $4.21 billion in outflows across three weeks, the largest institutional redemption streak of 2026. Institutions are de-risking ahead of the price, not reacting to it. Friday's nonfarm payrolls report is the key data to monitor. A strong print extends the current distribution pressure; a soft number offers the first conditions for a reset.
On-chain Insight
Back Inside the Bear Market Range
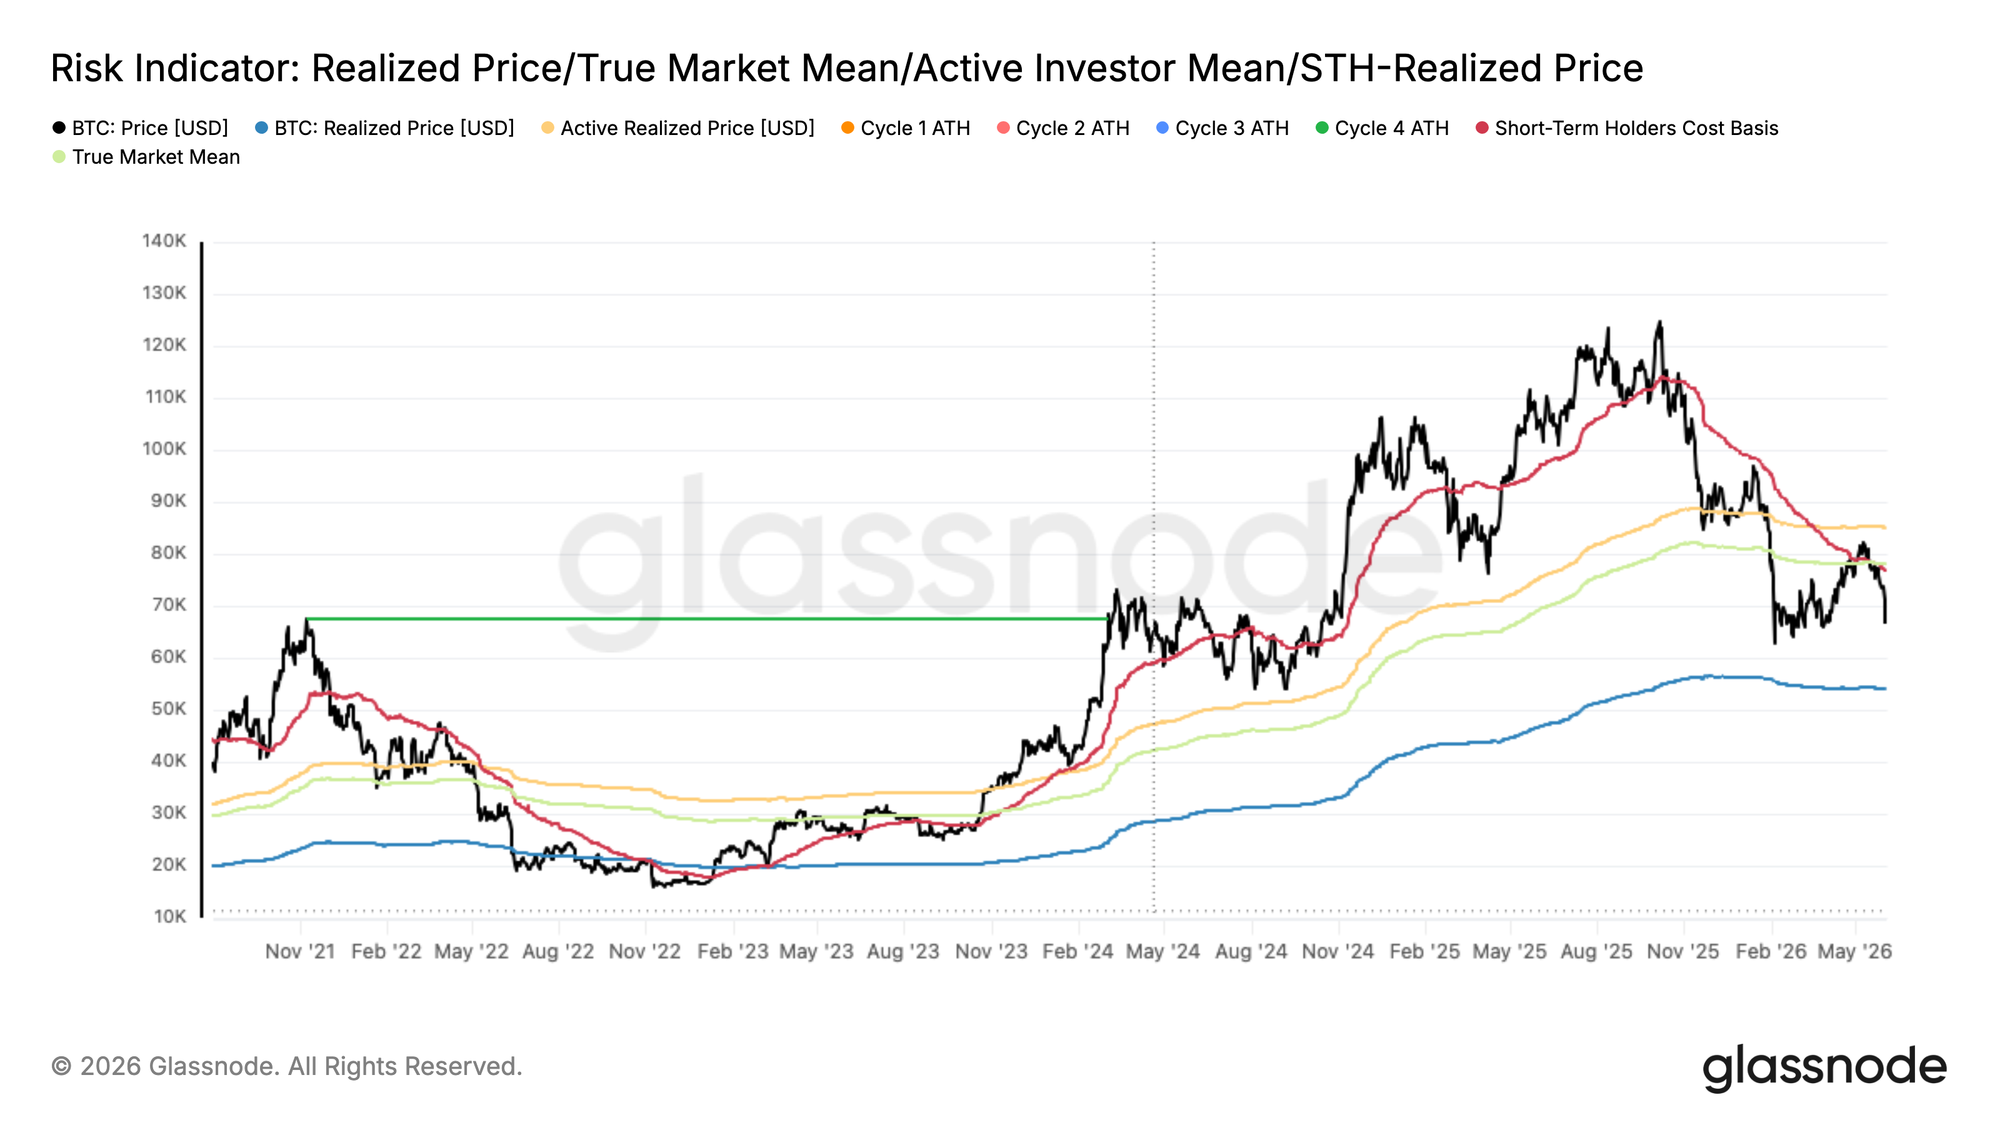
The macro headwinds outlined above have translated directly into on-chain structure deterioration. The 13% decline over the past week has pulled price decisively back from the True Market Mean at $77.8k, which tracks the cost basis of actively transacted supply and historically marks the threshold between bear and bull market regimes, toward the lower bound of the bear market value zone defined by the Realized Price at $53.9k, measuring the average acquisition cost of all circulating supply. At $67k, Bitcoin is trading near the midpoint of this range, and the failure to sustain above the True Market Mean reconfirms bear market continuation as the prevailing regime.
Interestingly, the Short-Term Holder Cost Basis at $76.4k now declining below the True Market Mean, a structure last observed in January 2022. This configuration indicates that new buyers are accumulating below the market's key mean valuation level, a hallmark of a later-stage bear market where the time component of the drawdown begins to bear down on investor conviction, and where structural failures or capitulation by larger entities have historically become more common.
Profitability Bias Collapses on the Leg Down
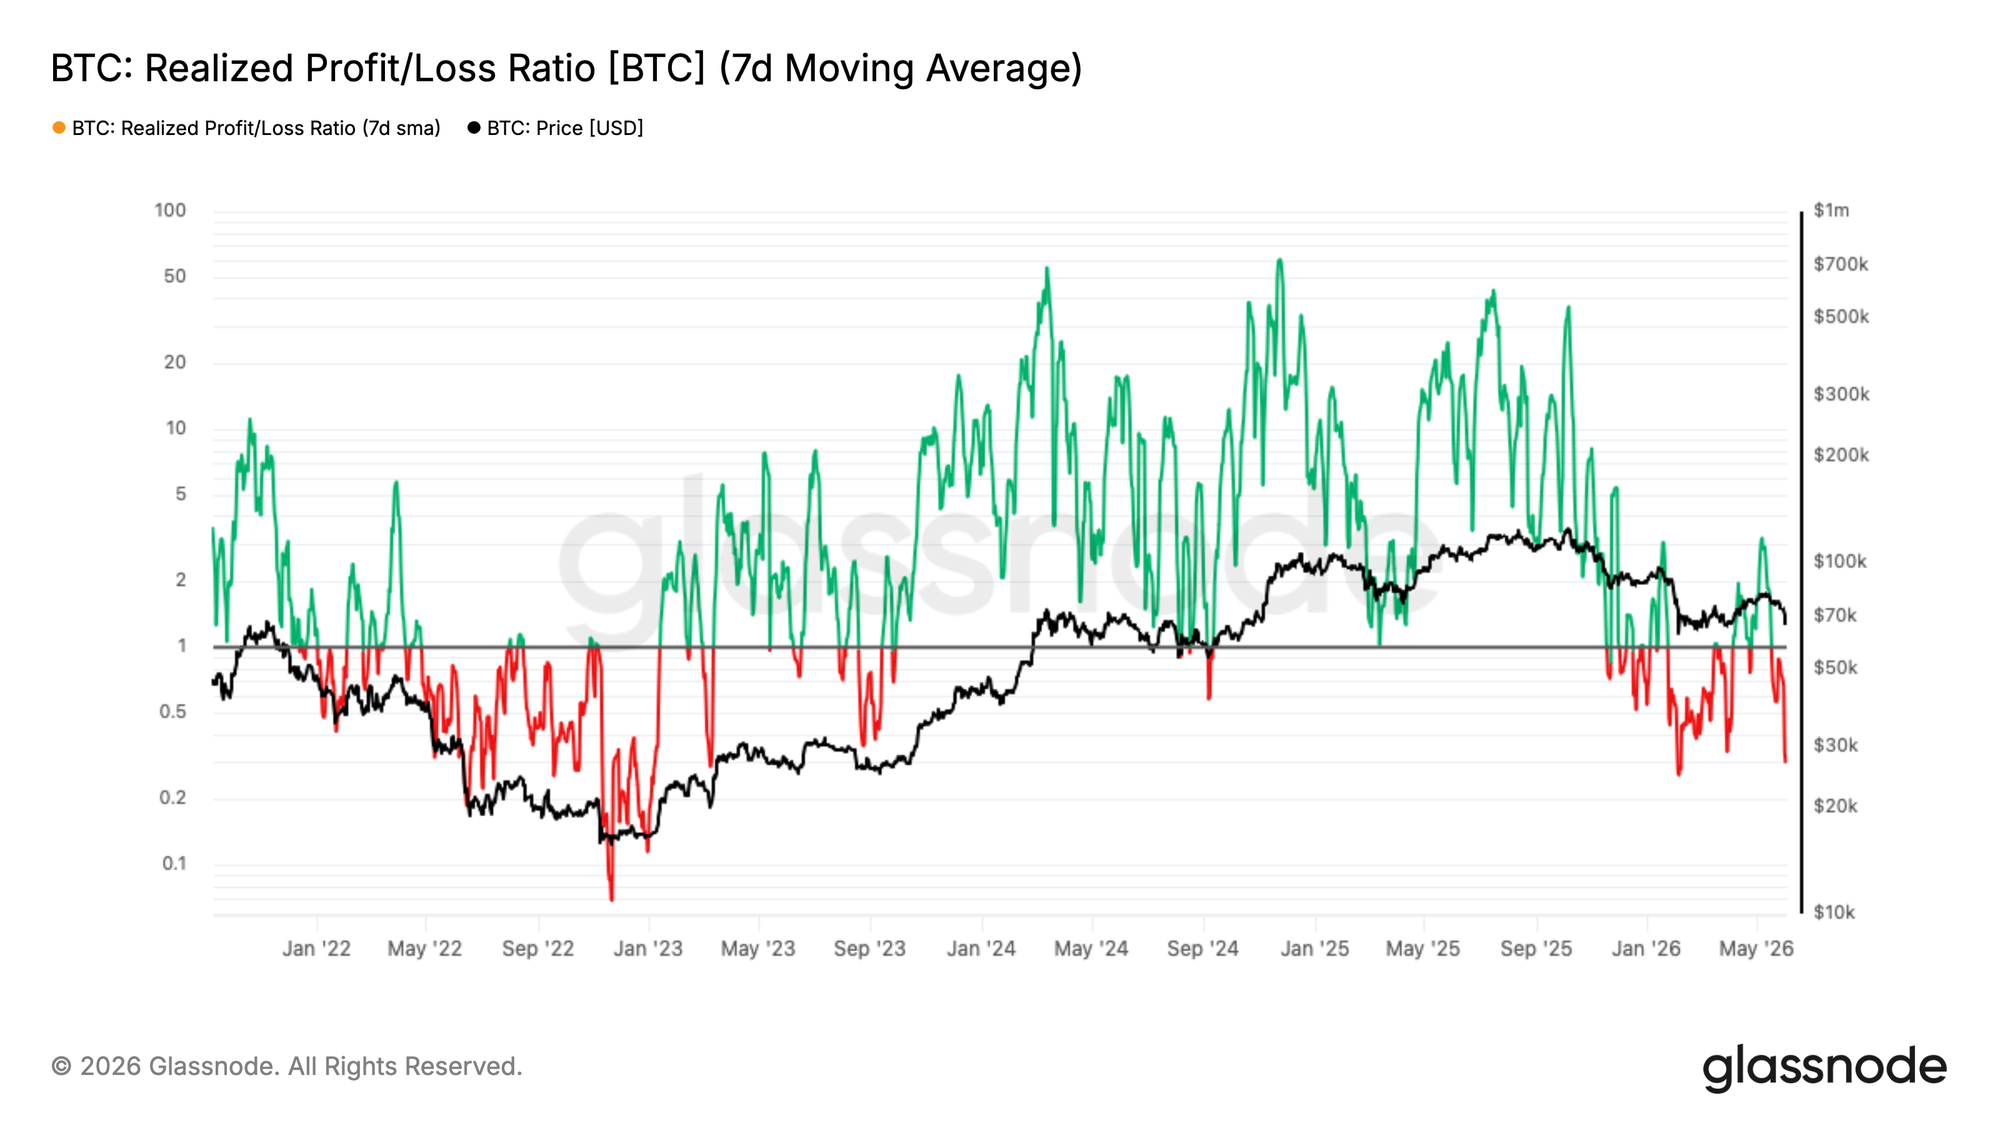
Building on the structural deterioration outlined above, the short-term capital flow environment has shifted sharply in response to the recent price decline. The 7-day SMA of the Realized Profit/Loss Ratio, which measures the near-term balance between profits and losses being realized on-chain, has contracted to 0.29, indicating that loss realization is now heavily dominating spending activity. This mirrors almost precisely the panic-driven wave seen in the first week of February. On May 7, the 7-day SMA had spiked to 3.16 as investors rushed to realize profits into the $82k rally, but the 90-day SMA never breached the 2 threshold associated with genuine bull market capital flow conditions. This divergence between short and longer-horizon readings was a telling signal that the rally lacked structural conviction, and the pattern is consistent with local top formation in a bear market rather than a credible regime transition. The subsequent collapse back to 0.29 confirms that reading.
New Buyers Under Pressure
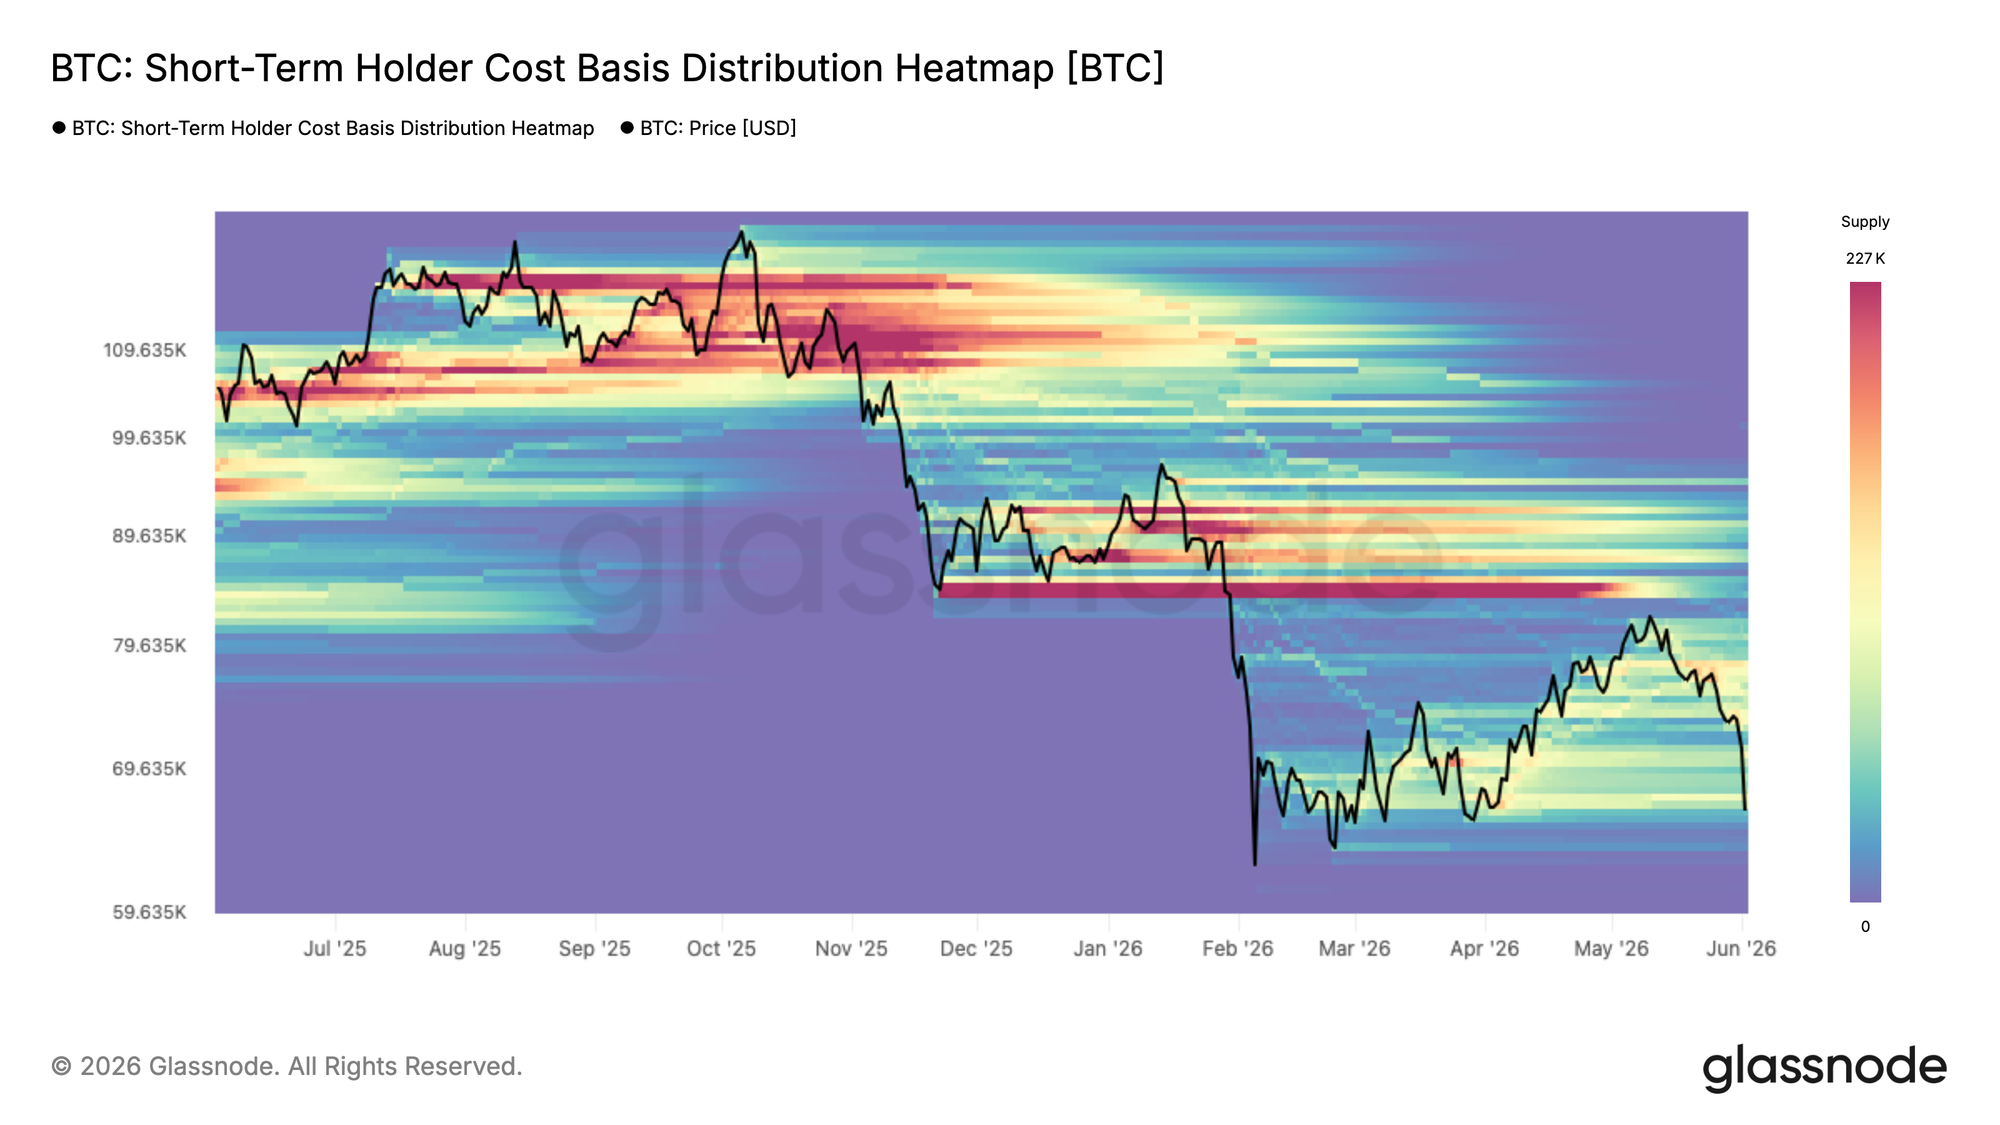
The rejection from the bear market ceiling has placed the most recently accumulated supply directly in the line of fire. The Short-Term Holder Cost Basis Distribution Heatmap visualizes the density of supply held by recent buyers across price levels, revealing where concentrations of short-term holder cost basis are clustered and therefore where behavioral pressure is most likely to emerge.
With price now pulling back toward $67k, it is approaching the lower band of the supply cluster accumulated since February, a zone where a meaningful volume of short-term holders are watching their unrealized gains compress toward breakeven or slip into loss. Those who accumulated between $78k and $82k near the local top are now facing the most immediate pressure, and whether they hold or capitulate will be a key determinant of whether current levels absorb the selling or give way to a deeper leg down.
Loss Realization Accelerates Across Cohorts
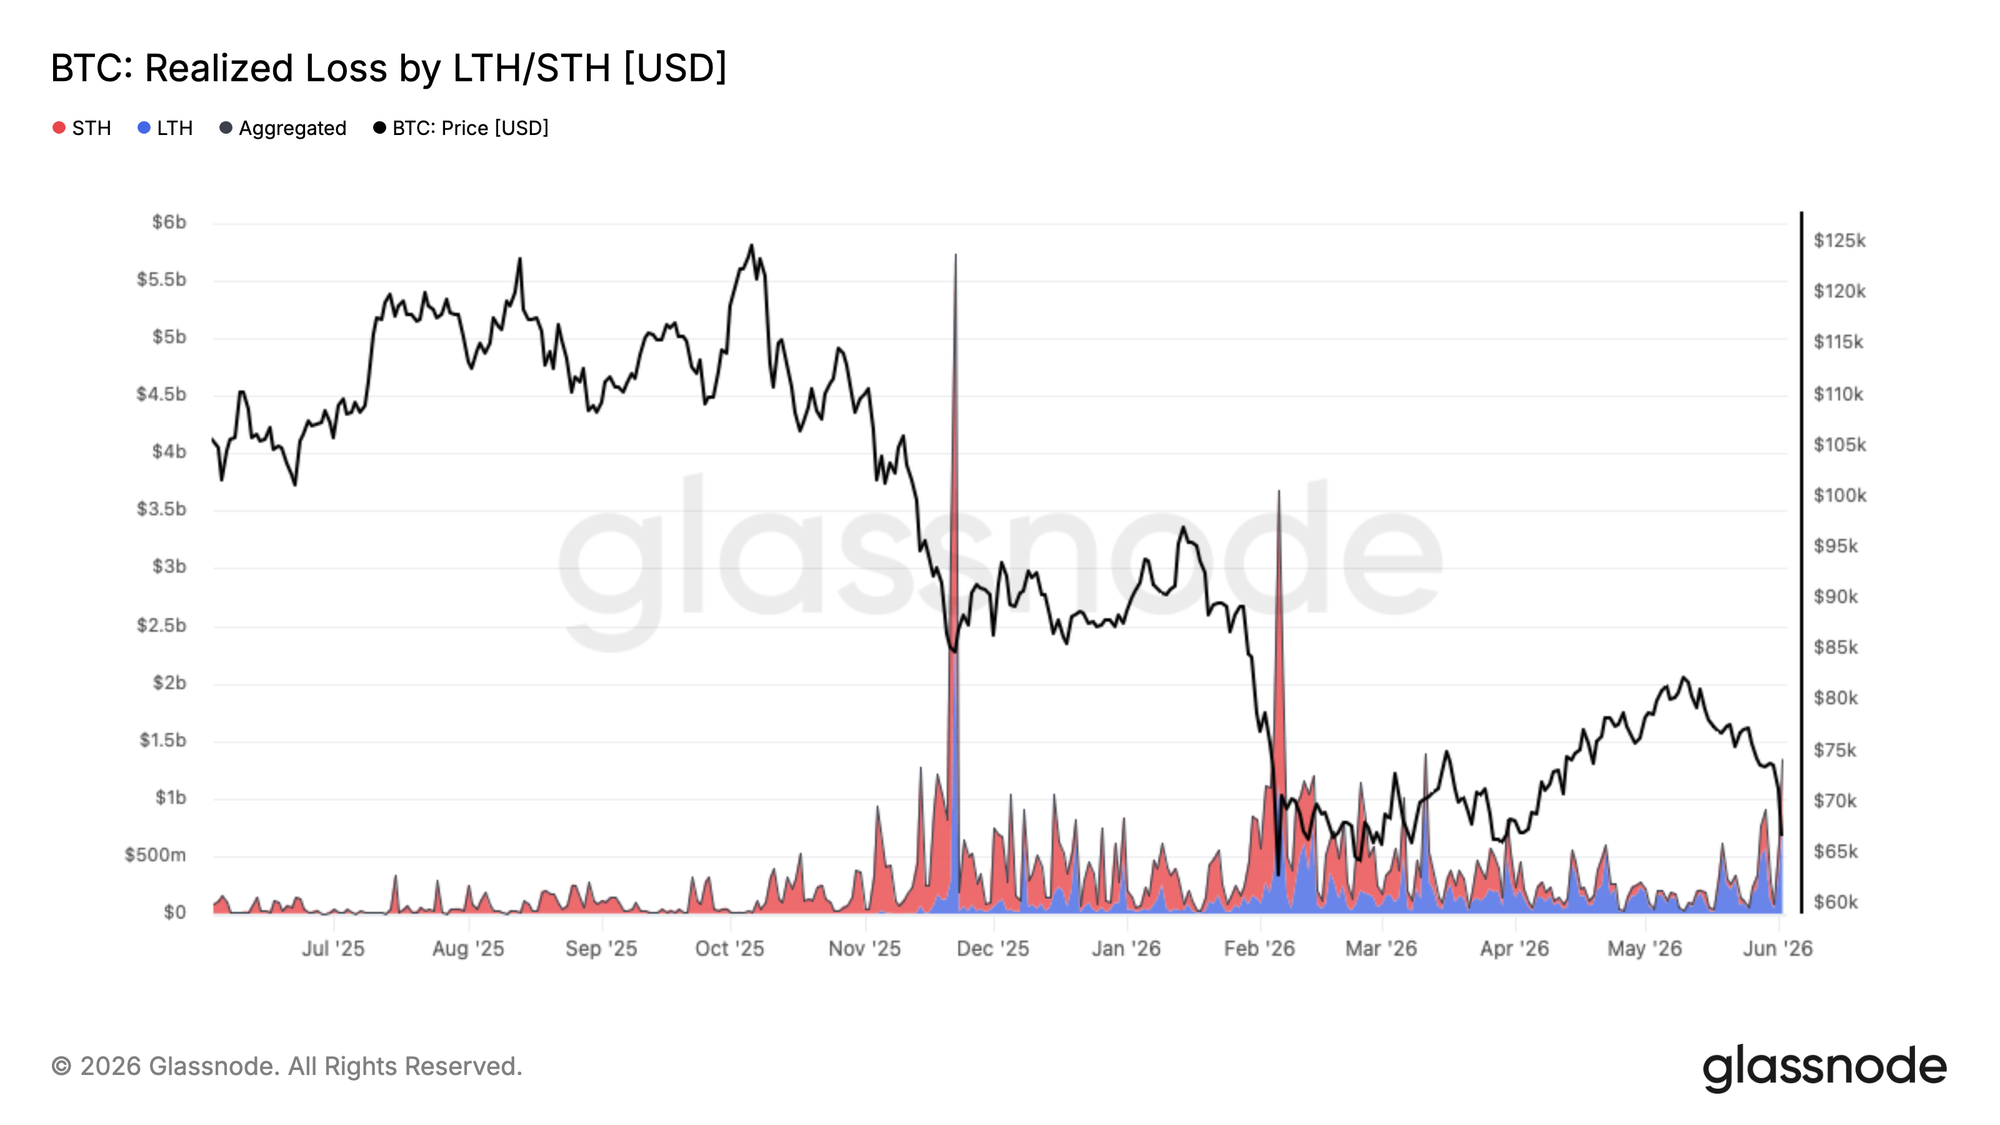
With recent buyers now facing compression back toward the lower band of the three-month range, the pressure on loss realization is broadening beyond just the most recently accumulated supply. The current correction to $67k has driven total Realized Loss to $1.35B per day, a sharp acceleration from the base levels seen during the preceding consolidation period.
Of this, $770M per day is being realized by long-term holders who acquired their coins prior to January 2026, reflecting the ongoing capitulation of cycle top buyers as the bear market extends in time. The remaining volume stems from recent buyers who accumulated between $67k and $82k throughout 2026, now being forced to exit at a loss as price undercuts their cost basis.
As the bear market matures, this pattern of long-term holder capitulation passing supply into new hands at lower prices is a recurring and necessary feature of cycle bottoming processes, though the current pace of loss realization suggests that process remains incomplete.
Off-chain Insight
Below ETF Cost Basis
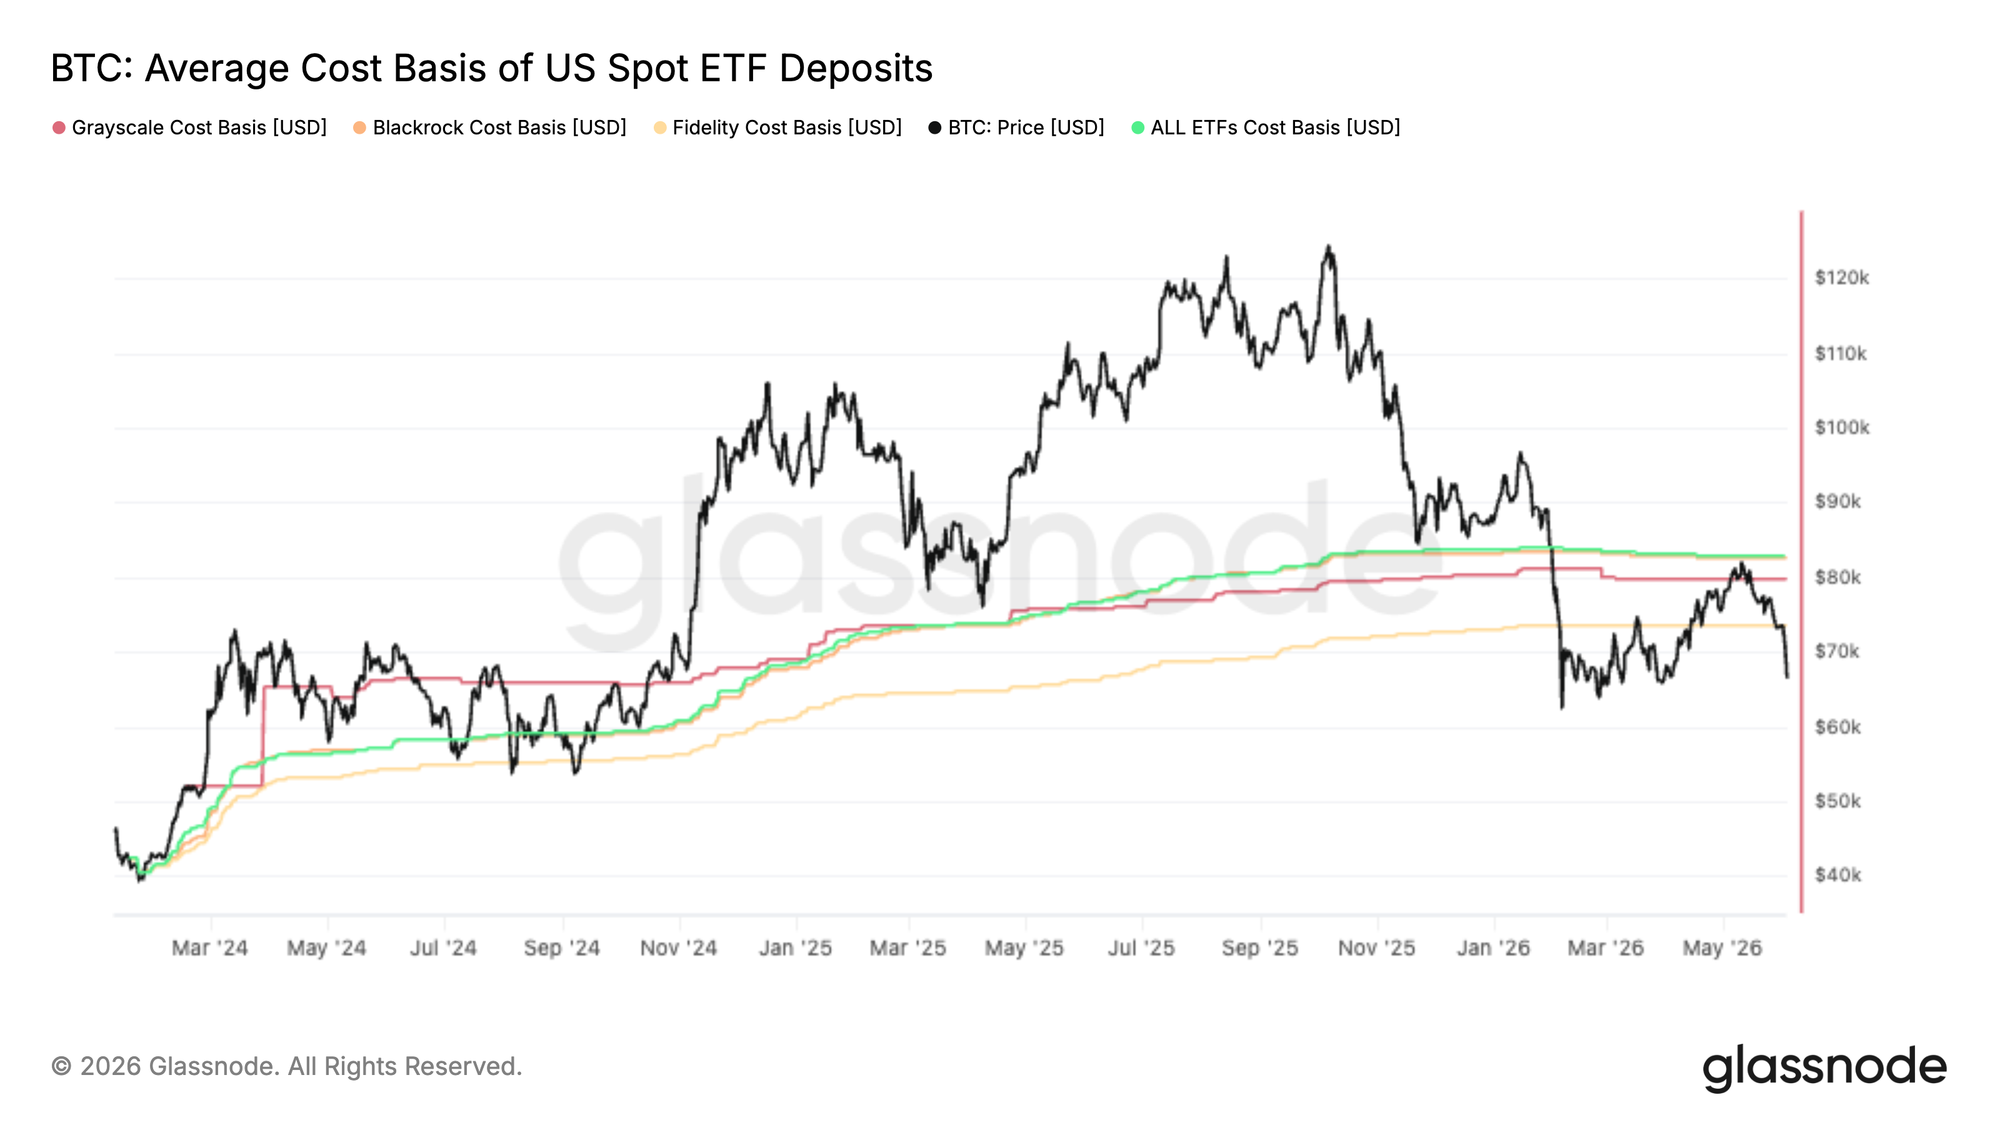
Bitcoin's latest rally stalled almost precisely at the aggregate US Spot ETF cost basis near $83K, turning what had previously acted as support into a clear area of resistance. This suggests a meaningful portion of ETF investors who were underwater used the recovery as an opportunity to reduce exposure or exit at breakeven.
The rejection is particularly noteworthy because ETF flows have been one of the dominant sources of demand throughout this cycle. When price struggles to reclaim the average holder's cost basis, it can signal that supply from trapped investors is outweighing new demand, creating overhead resistance.
Looking ahead, the aggregate ETF cost basis remains a key level to watch. A decisive reclaim would place the average ETF investor back into profit and likely improve sentiment across the cohort. Until then, the inability to hold above this level suggests ETF positioning remains a headwind, with investors still using strength to de-risk rather than accumulate.
Spot Bid Disappears
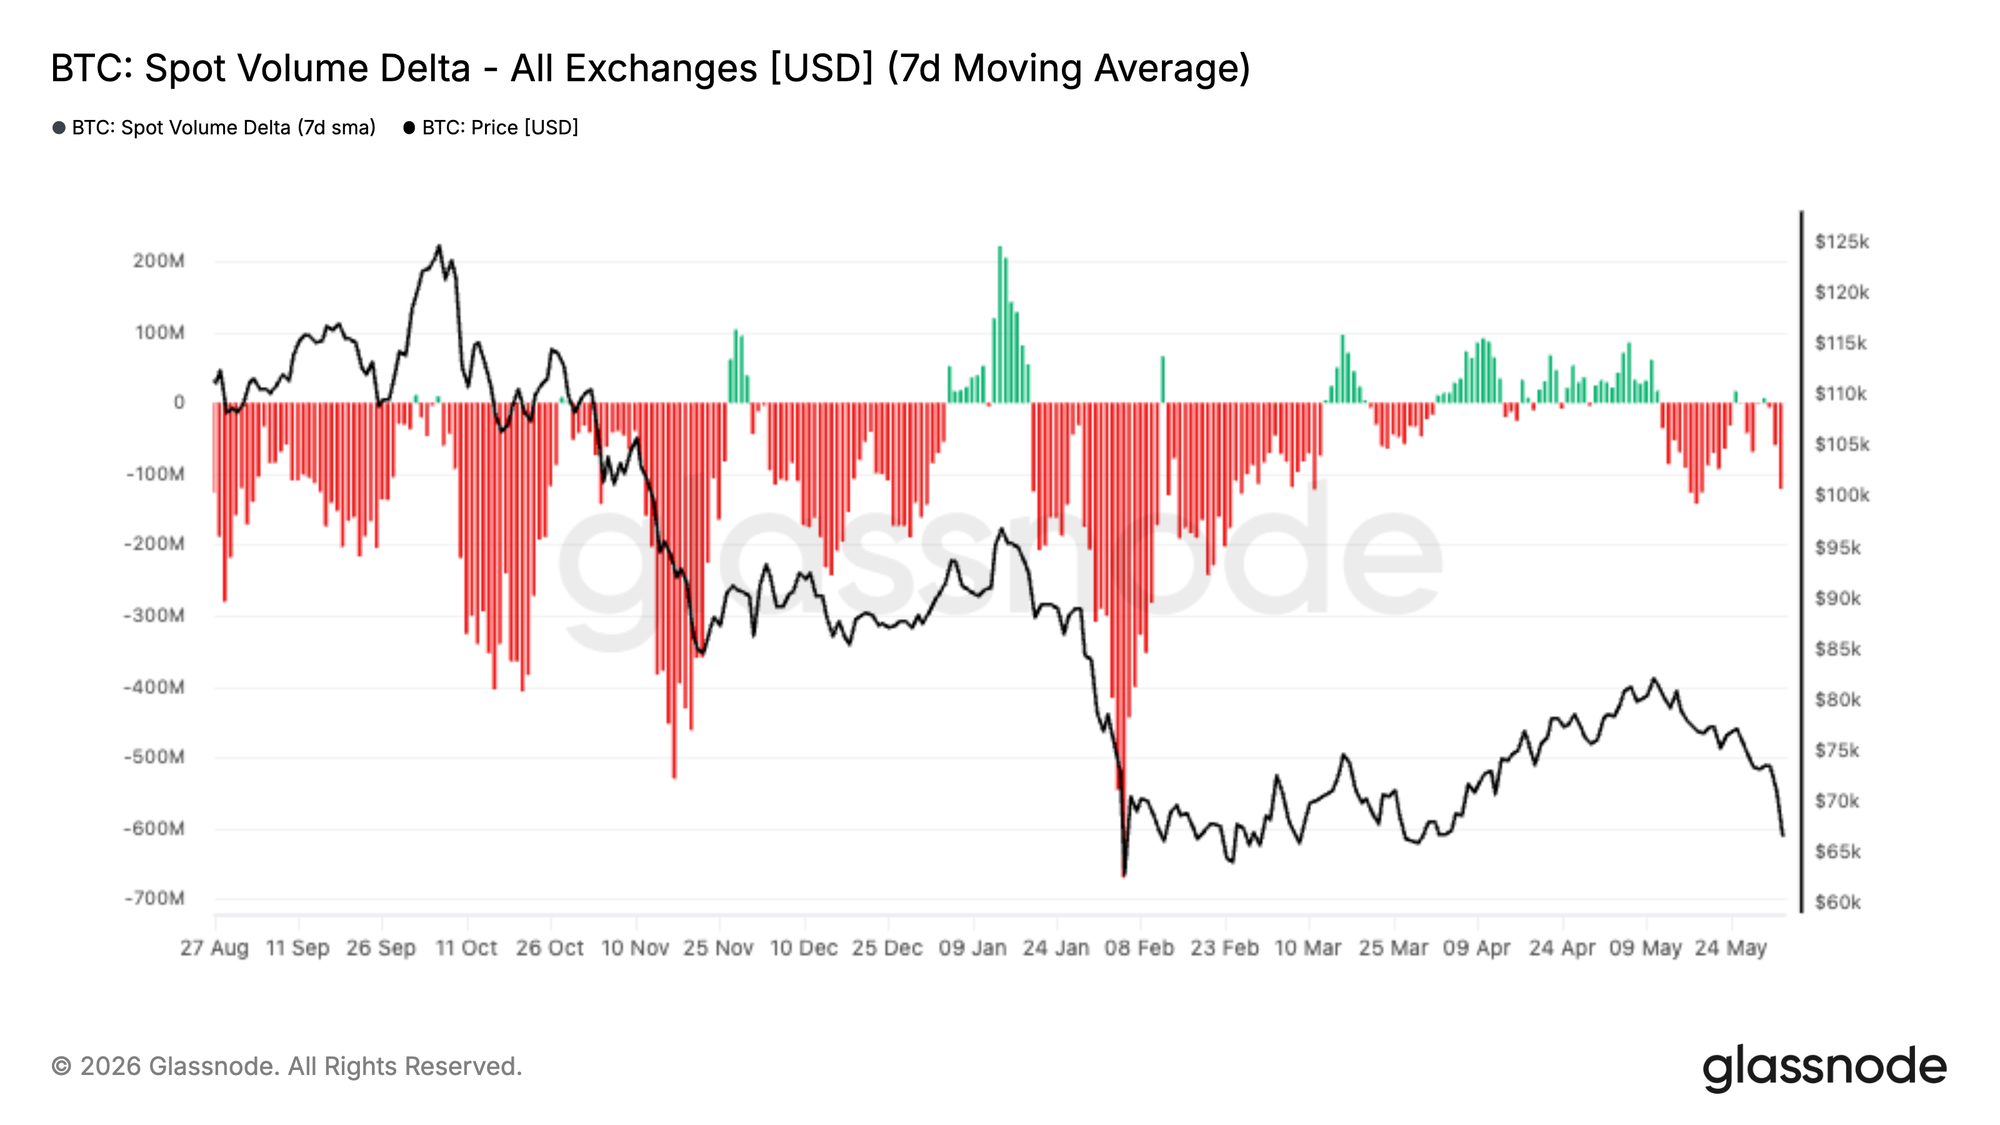
Spot market flows have deteriorated sharply over the last two weeks, with the 7-day Spot Volume Delta flipping decisively negative and reaching levels not seen since the February sell-off. This indicates that aggressive sellers are once again dominating spot order books, reinforcing the weakness observed in recent price action.
What makes the current move notable is that it follows a period of sustained spot-led accumulation throughout April and early May. During that advance, buyers consistently lifted offers and drove Spot Volume Delta into positive territory, helping fuel Bitcoin's recovery from the mid-$60Ks toward $80K. That demand impulse has now faded, with sellers regaining control as price failed to break higher.
Persistent negative Spot Volume Delta tends to accompany either capitulation events or the early stages of a broader trend reversal. For now, this suggests the market remains in a distribution phase, with spot participants using rallies to sell into strength rather than accumulate. A meaningful improvement in spot demand remains one of the key signals required to support a durable recovery.
Futures Liquidations
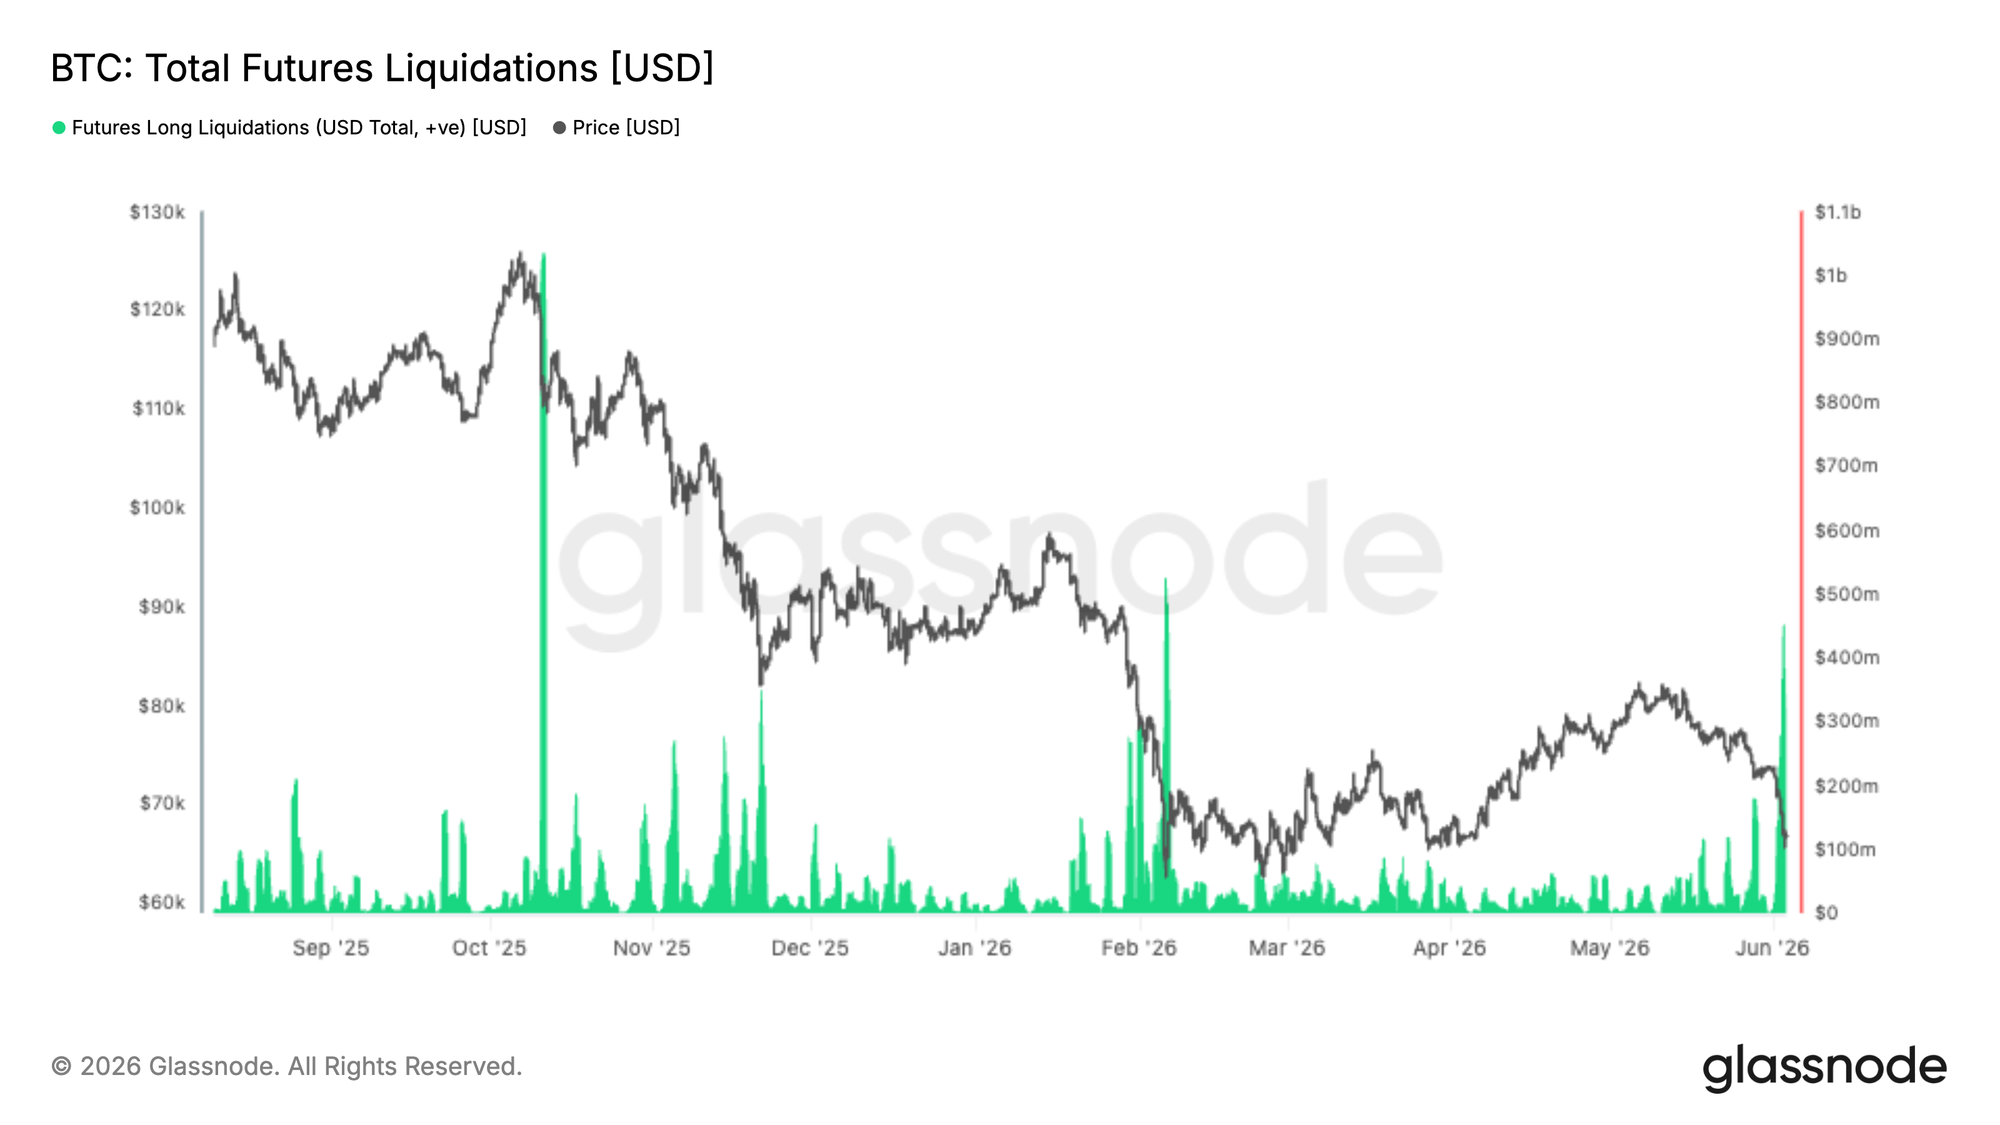
The latest market drawdown triggered one of the largest long liquidation events of the current cycle, with over $400M in leveraged long positions forcibly closed as Bitcoin sold off below $70K. While painful for late entrants, these events often serve to flush excessive leverage from the system and reset market positioning.
Notably, the magnitude of liquidations remains below the major wipeouts seen during the October 2025 and February 2026 corrections, suggesting leverage had not become as extended heading into this decline. Historically, large-scale long liquidations have coincided with local exhaustion points, as forced selling pressure cascades through derivatives markets and clears out weaker hands.
The key question going forward is whether spot demand steps in to absorb supply. If liquidation-driven selling begins to subside while spot buyers return, the market may be left with a cleaner positioning backdrop and reduced leverage overhang, creating conditions for a more sustainable recovery.
Implied Volatility Continues to Drift Lower
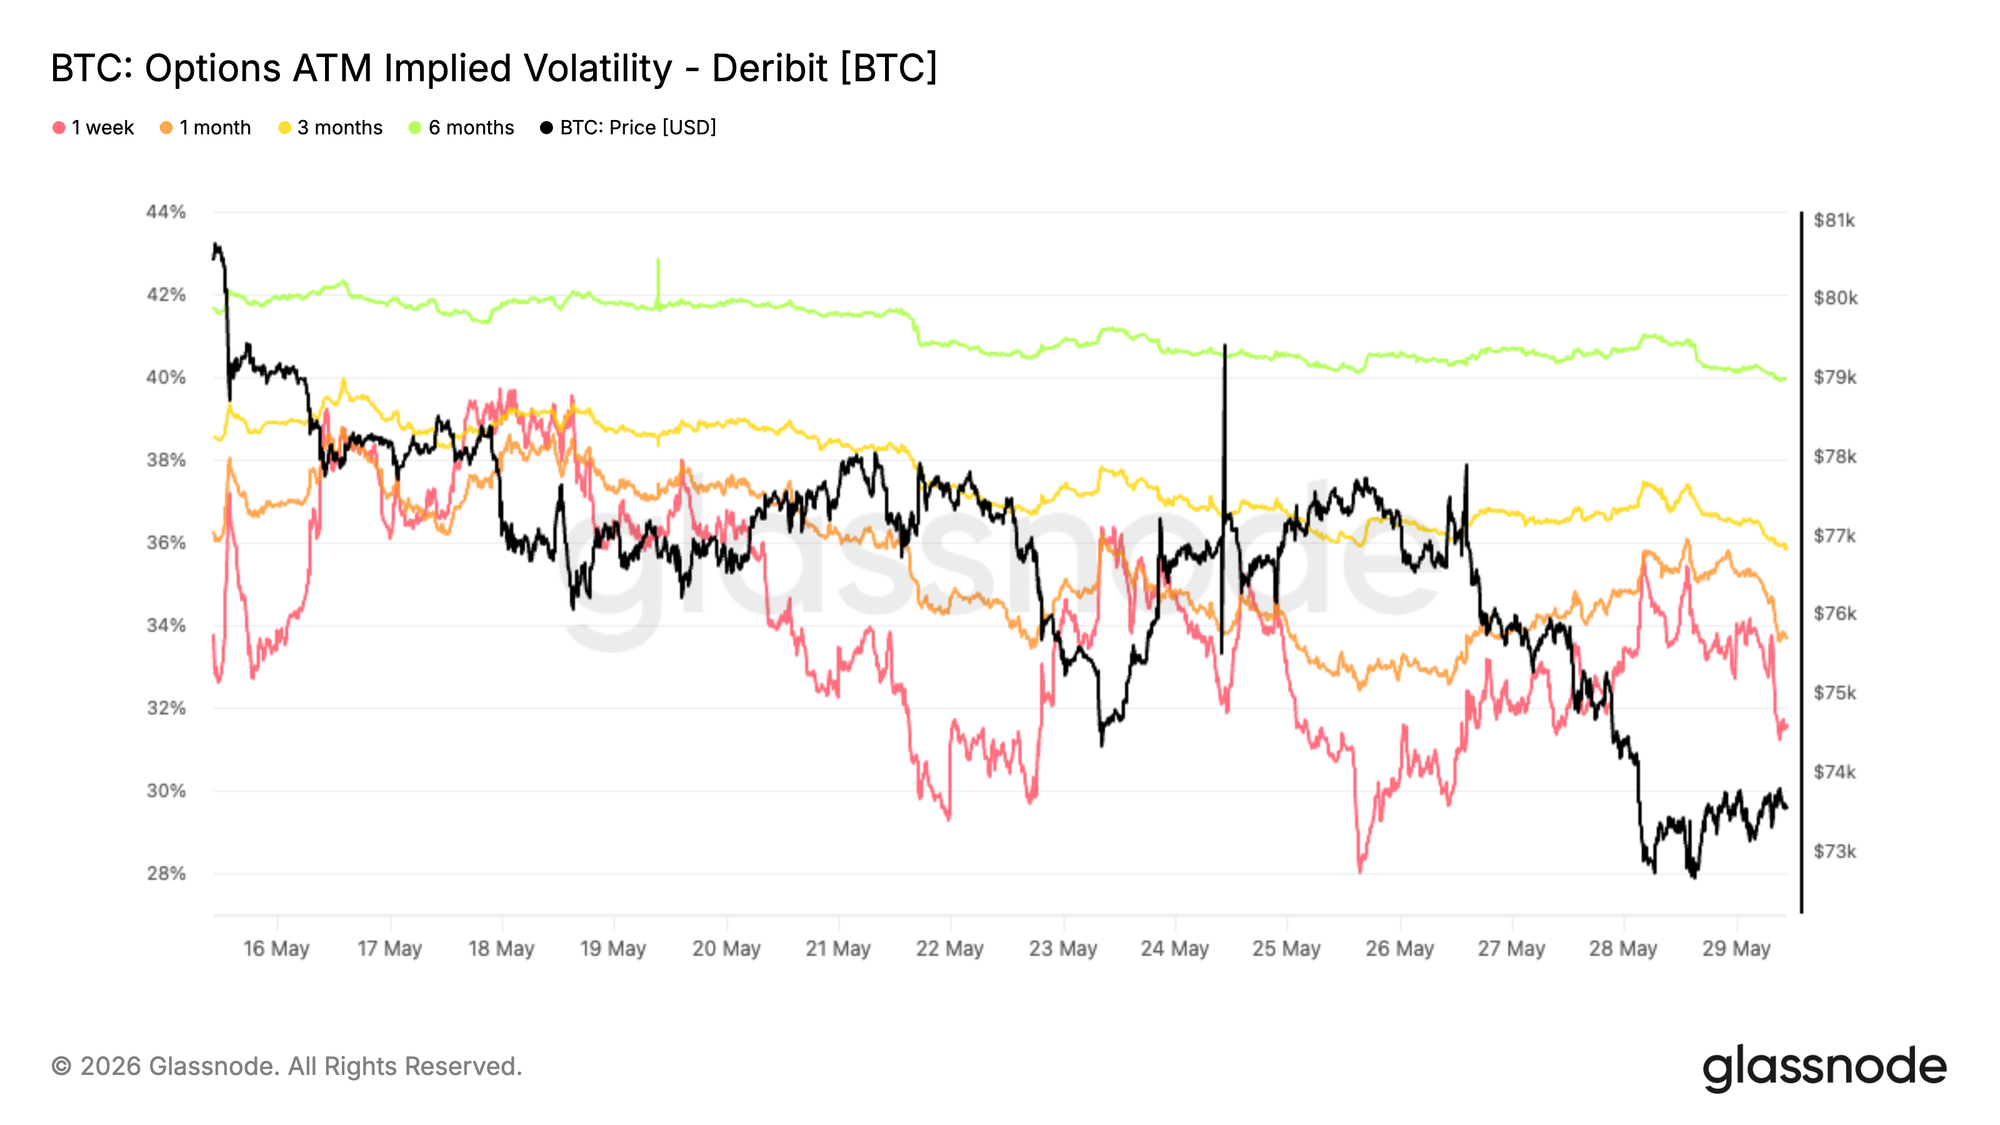
Starting with implied volatility, the dominant trend remains lower across the curve despite the recent breakdown in spot. The 1 month tenor has fallen from roughly 38% to 34%, while the 3 month and 6 month maturities have also compressed by around 3 volatility points over the past two weeks.
The move reflects a market that remains reluctant to pay up for optionality even as Bitcoin broke below the lower end of its recent range. While front end volatility saw brief reactions around sharp spot moves, these spikes were quickly sold, preserving the broader downtrend.
The term structure remains in contango, with longer dated volatility still trading at a premium to the front end. This suggests traders continue to view recent price weakness as a localized event rather than a catalyst for a broader repricing of volatility.
Volatility sellers remain in control, with demand for protection failing to accelerate despite weaker price action.
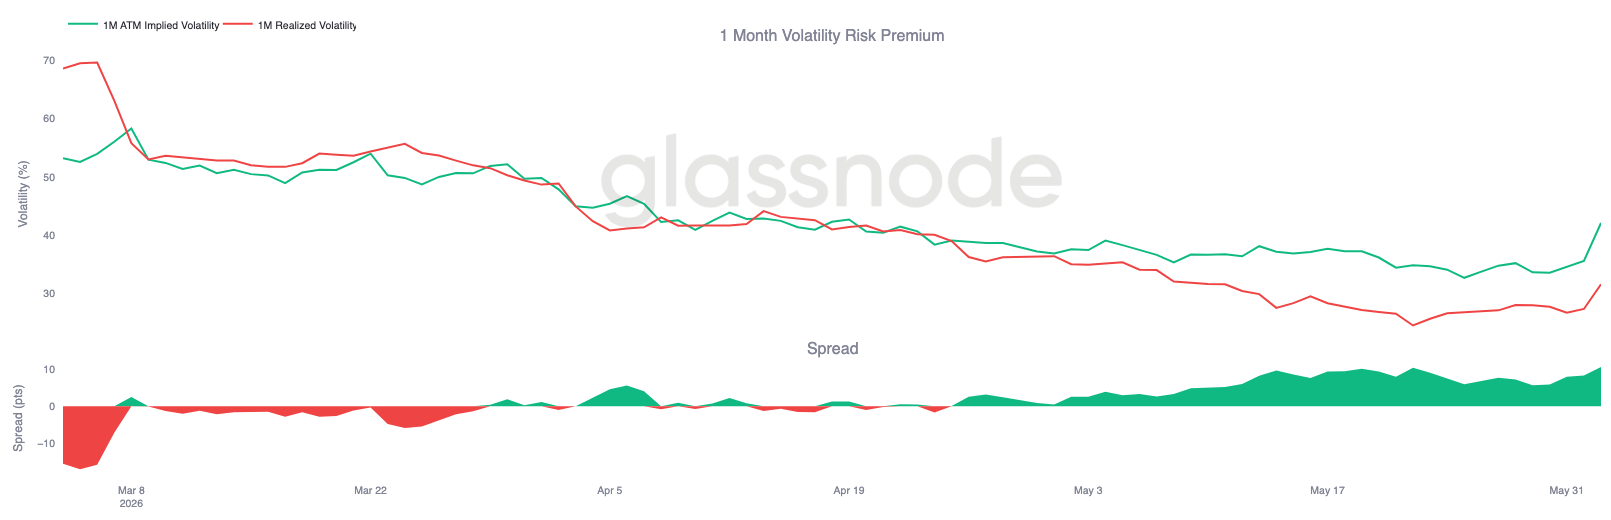
Volatility Premium Near Three Month Highs
Following the decline in implied volatility, the relationship between implied and realized volatility tells a different story. While Bitcoin has traded through a volatile period, options markets continue to price significantly more movement ahead than spot has recently delivered.
One month implied volatility has rebounded to roughly 42%, while realized volatility remains closer to 32%. As a result, the volatility risk premium has widened toward the highest levels observed over the past three months.
The move has been particularly noticeable during the recent selloff. Although realized volatility picked up as Bitcoin broke below key support levels, implied volatility rose even faster, reflecting renewed demand for optionality and protection.
Options markets continue to assign a higher probability of future volatility than recent price action alone would suggest, keeping the volatility premium firmly elevated.
Put Premiums Remain Elevated
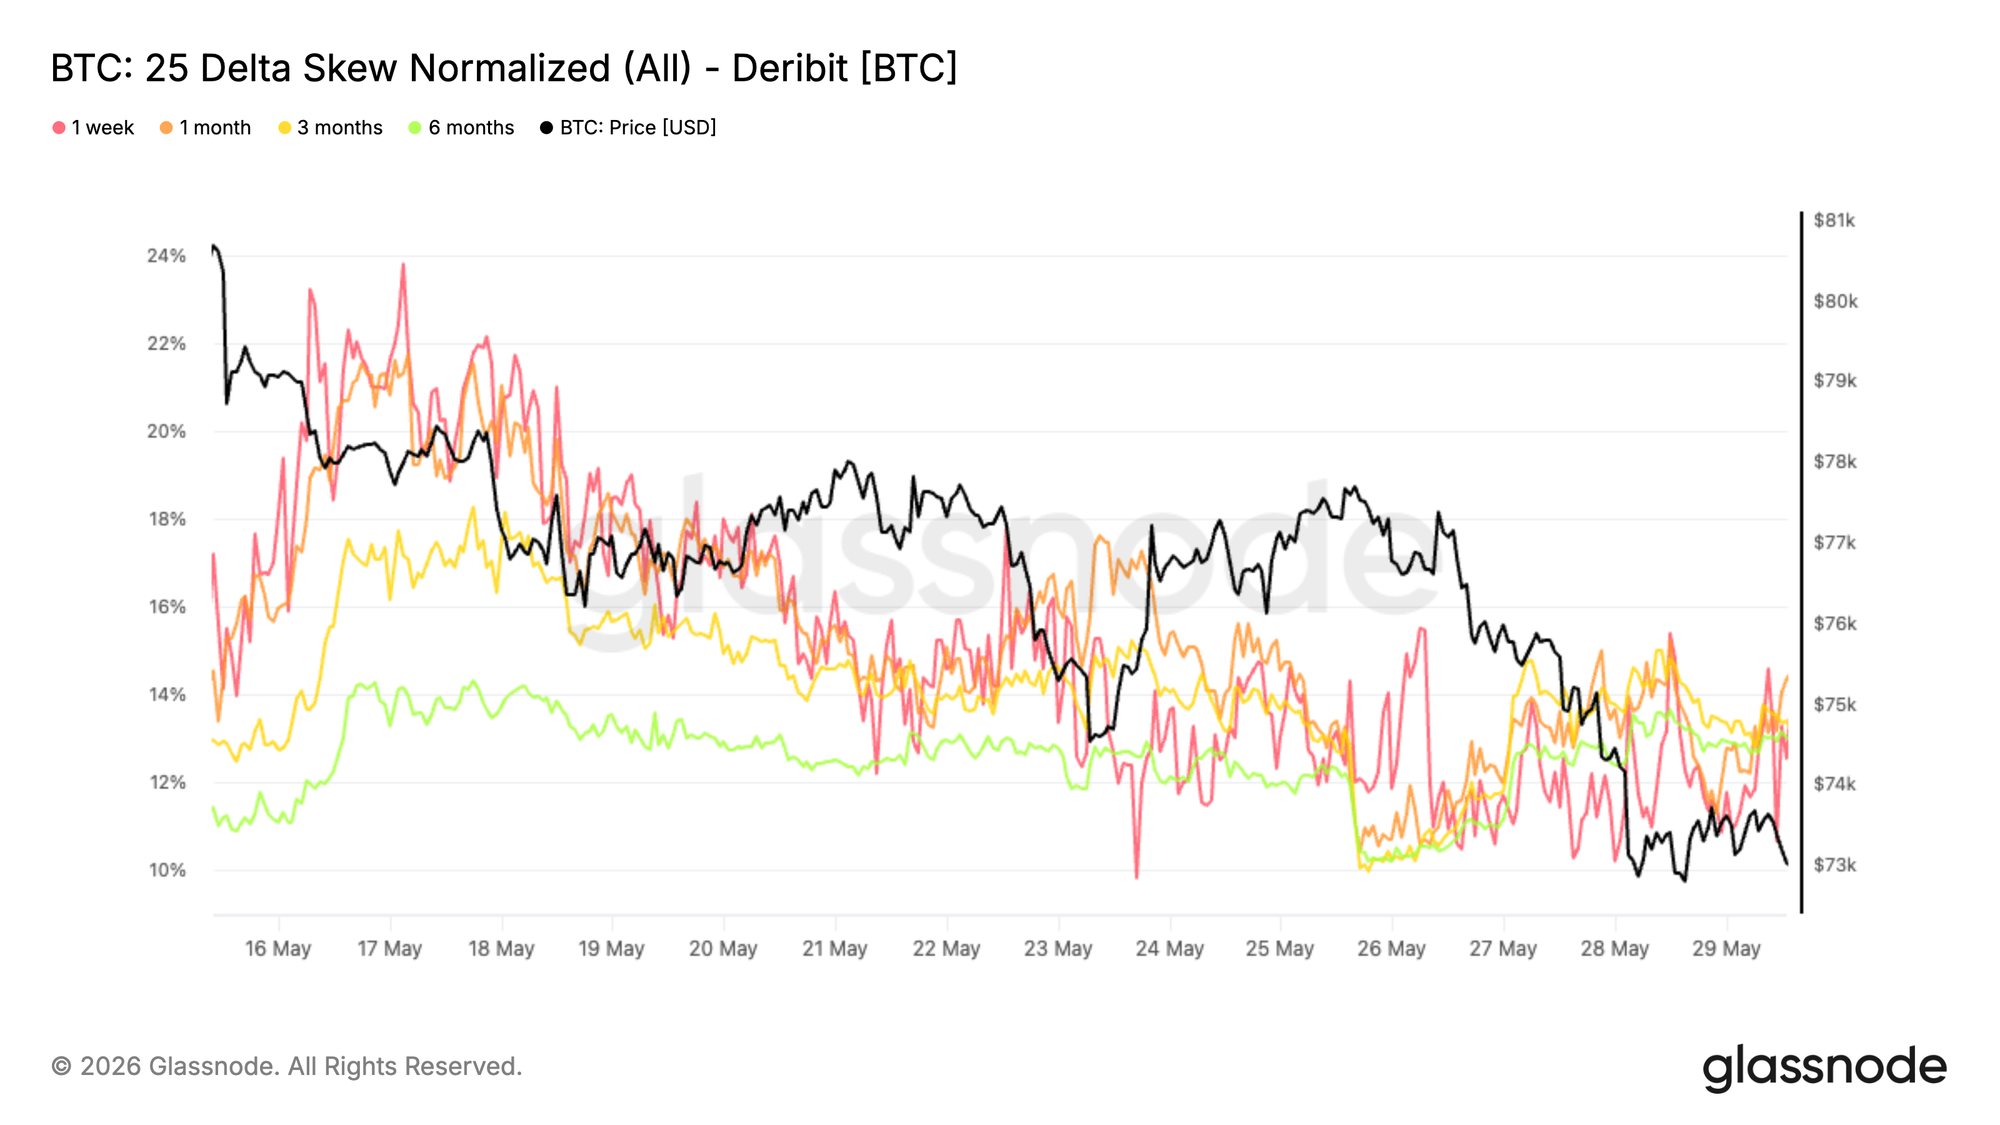
Following the widening volatility risk premium, skew shows where traders continue to concentrate that optionality demand. Despite the recent breakdown in spot, put options remain consistently more expensive than calls across the curve.
Since this skew is calculated as put minus call, the positive readings across all maturities indicate that downside protection continues to command a premium. The 1 month, 3 month, and 6 month tenors currently sit near 13% to 14%, remaining firmly in put territory despite the broader repricing lower from mid May highs.
Notably, the recent move below support failed to trigger a meaningful expansion in skew. Rather than aggressively chasing additional protection, traders appear to be maintaining existing defensive positioning as downside risks become increasingly reflected in market pricing.
Protection demand remains structurally elevated, but the absence of a sharp skew expansion suggests the recent selloff has not triggered a new wave of downside hedging.
Gamma Clusters Form Around Current Spot
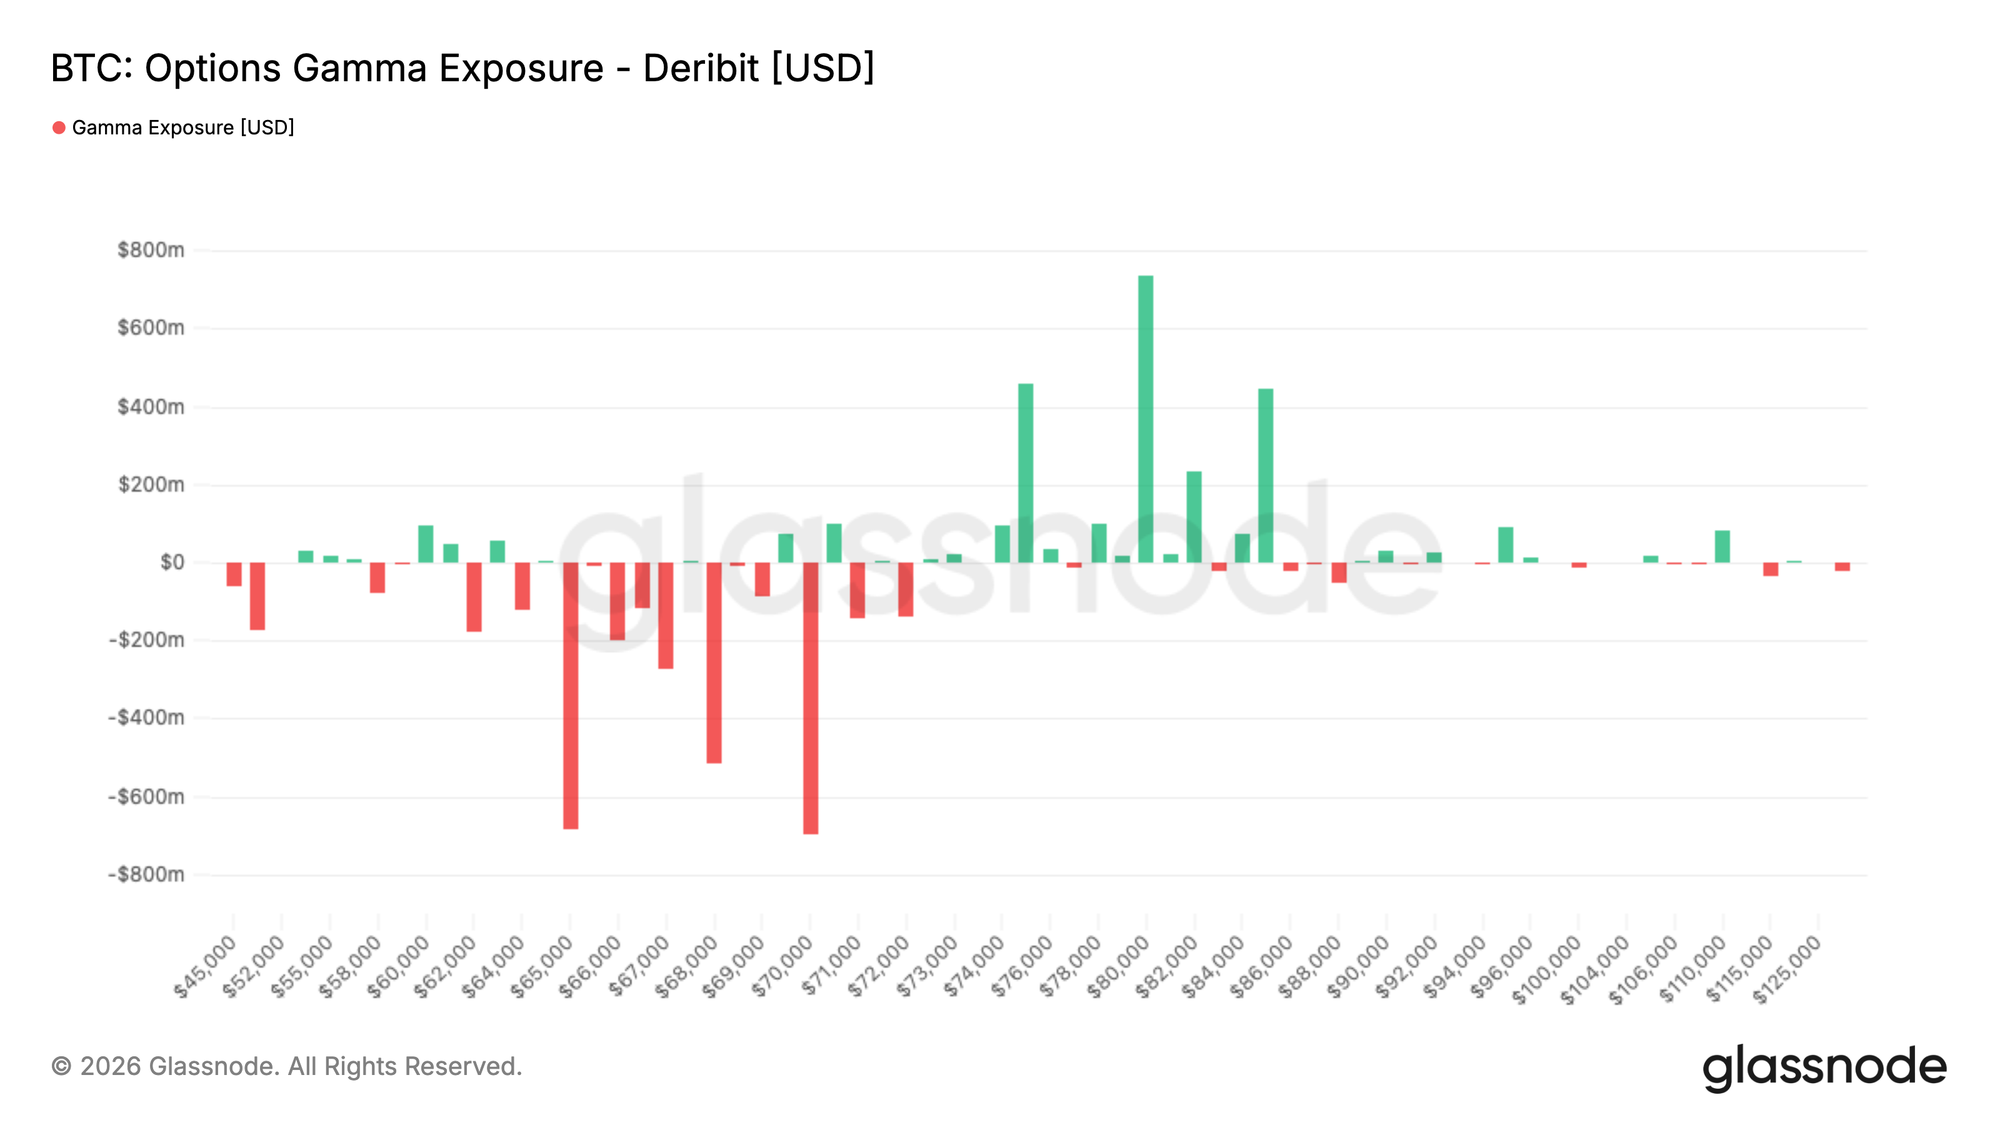
Following the persistent demand for downside protection, dealer positioning remains heavily concentrated around current market levels. The largest negative gamma clusters sit near 65K and 70K, while the strongest positive gamma exposure is out of reach for now.
With Bitcoin currently trading around 66.7K, spot sits directly on top of the largest negative gamma zone. In these areas, dealer hedging can amplify short term price moves as market makers are forced to trade with momentum.
Flow data helps explain this positioning. Over the past seven days, taker activity leaned defensive, with put buying representing the largest share of premium traded. The last 24 hours show a similar pattern, although call buying has increased alongside continued put demand, suggesting traders remain active on both sides of the market.
Options positioning remains concentrated around current spot, while taker flow continues to favor protection demand, reinforcing a cautious tone across the options market.
Conclusion
Bitcoin's latest decline has reinforced the view that the market remains in a fragile position, with weakness evident across profitability, investor behaviour, ETF positioning, and spot market demand. The rejection from the aggregate ETF cost basis near $83K highlights that many investors remain trapped above current prices, creating a source of overhead supply that continues to cap recovery attempts.
At the same time, realized losses have accelerated, long-term holders are beginning to distribute at scale, and spot order flow has shifted firmly back in favour of sellers. While the recent liquidation event has helped clear leverage from the system, there is little evidence yet that a durable demand response has emerged to absorb the resulting supply.
Options markets reflect a similar picture. Traders continue to pay for downside protection and future volatility, but without the degree of panic typically associated with major capitulation lows. Until spot demand strengthens, ETF investors reclaim profitability, and selling pressure begins to subside, the market is likely to remain vulnerable to further downside and continued consolidation within a broader bear market structure.
Disclaimer: This report does not provide any investment advice. All data is provided for informational and educational purposes only. No investment decision shall be based on the information provided here, and you are solely responsible for your own investment decisions.
Exchange balances presented are derived from Glassnode’s comprehensive database of address labels, which are amassed through both officially published exchange information and proprietary clustering algorithms. While we strive to ensure the utmost accuracy in representing exchange balances, it is important to note that these figures might not always encapsulate the entirety of an exchange’s reserves, particularly when exchanges refrain from disclosing their official addresses. We urge users to exercise caution and discretion when utilizing these metrics. Glassnode shall not be held responsible for any discrepancies or potential inaccuracies.






