Small-Cap Index Hits New High Again: Will History Predict This Crypto Bull Market?

比推Publicado a 2026-01-23Actualizado a 2026-01-23

Resumen

Small-cap stock index Russell 2000 has reached a new all-time high in early 2026, sparking discussions about its historical correlation with Bitcoin bull markets. The index, which tracks 2,000 smaller U.S. companies, is seen as a gauge of risk appetite, as these firms are more sensitive to interest rate changes due to their reliance on bank financing. Historical data shows that previous breakouts in Russell 2000—in 2016 and 2020—coincided with major Bitcoin rallies. In 2016, post-halving supply constraints and improved risk appetite fueled a bull run. In 2020, massive monetary easing and institutional adoption drove Bitcoin’s surge. However, the current cycle differs. Bitcoin had already reached $100,000 by November 2024, and its post-halving gains—around 50% since April 2024—are modest compared to previous cycles (5x and 27x). Factors like institutional involvement through ETFs, reduced volatility, diminishing halving effects, and earlier price peaks may explain the slower momentum. While some analysts link Russell 2000’s performance to crypto market movements due to shared sensitivity to macro liquidity, the correlation remains speculative with only two historical instances. Notably, despite the index’s rise, small-cap ETFs saw significant outflows in 2025, and many Russell 2000 companies reported negative earnings—raising questions about the sustainability of the risk-on narrative. The article concludes that while Russell 2000’s breakout is an interesting macro indicat...

Author: Deep Tide TechFlow

Original Title: U.S. Small-Cap Stock Index Hits Record High, An Overlooked Crypto Cycle Signal?


Three weeks into 2026, the Russell 2000 Index has risen 9%, breaking through 2700 points.

This U.S. small-cap stock index had been moving sideways for three years since its previous high at the end of 2021, only breaking through for the first time last November. It has now entered the "price discovery" phase, with no historical resistance levels to reference.

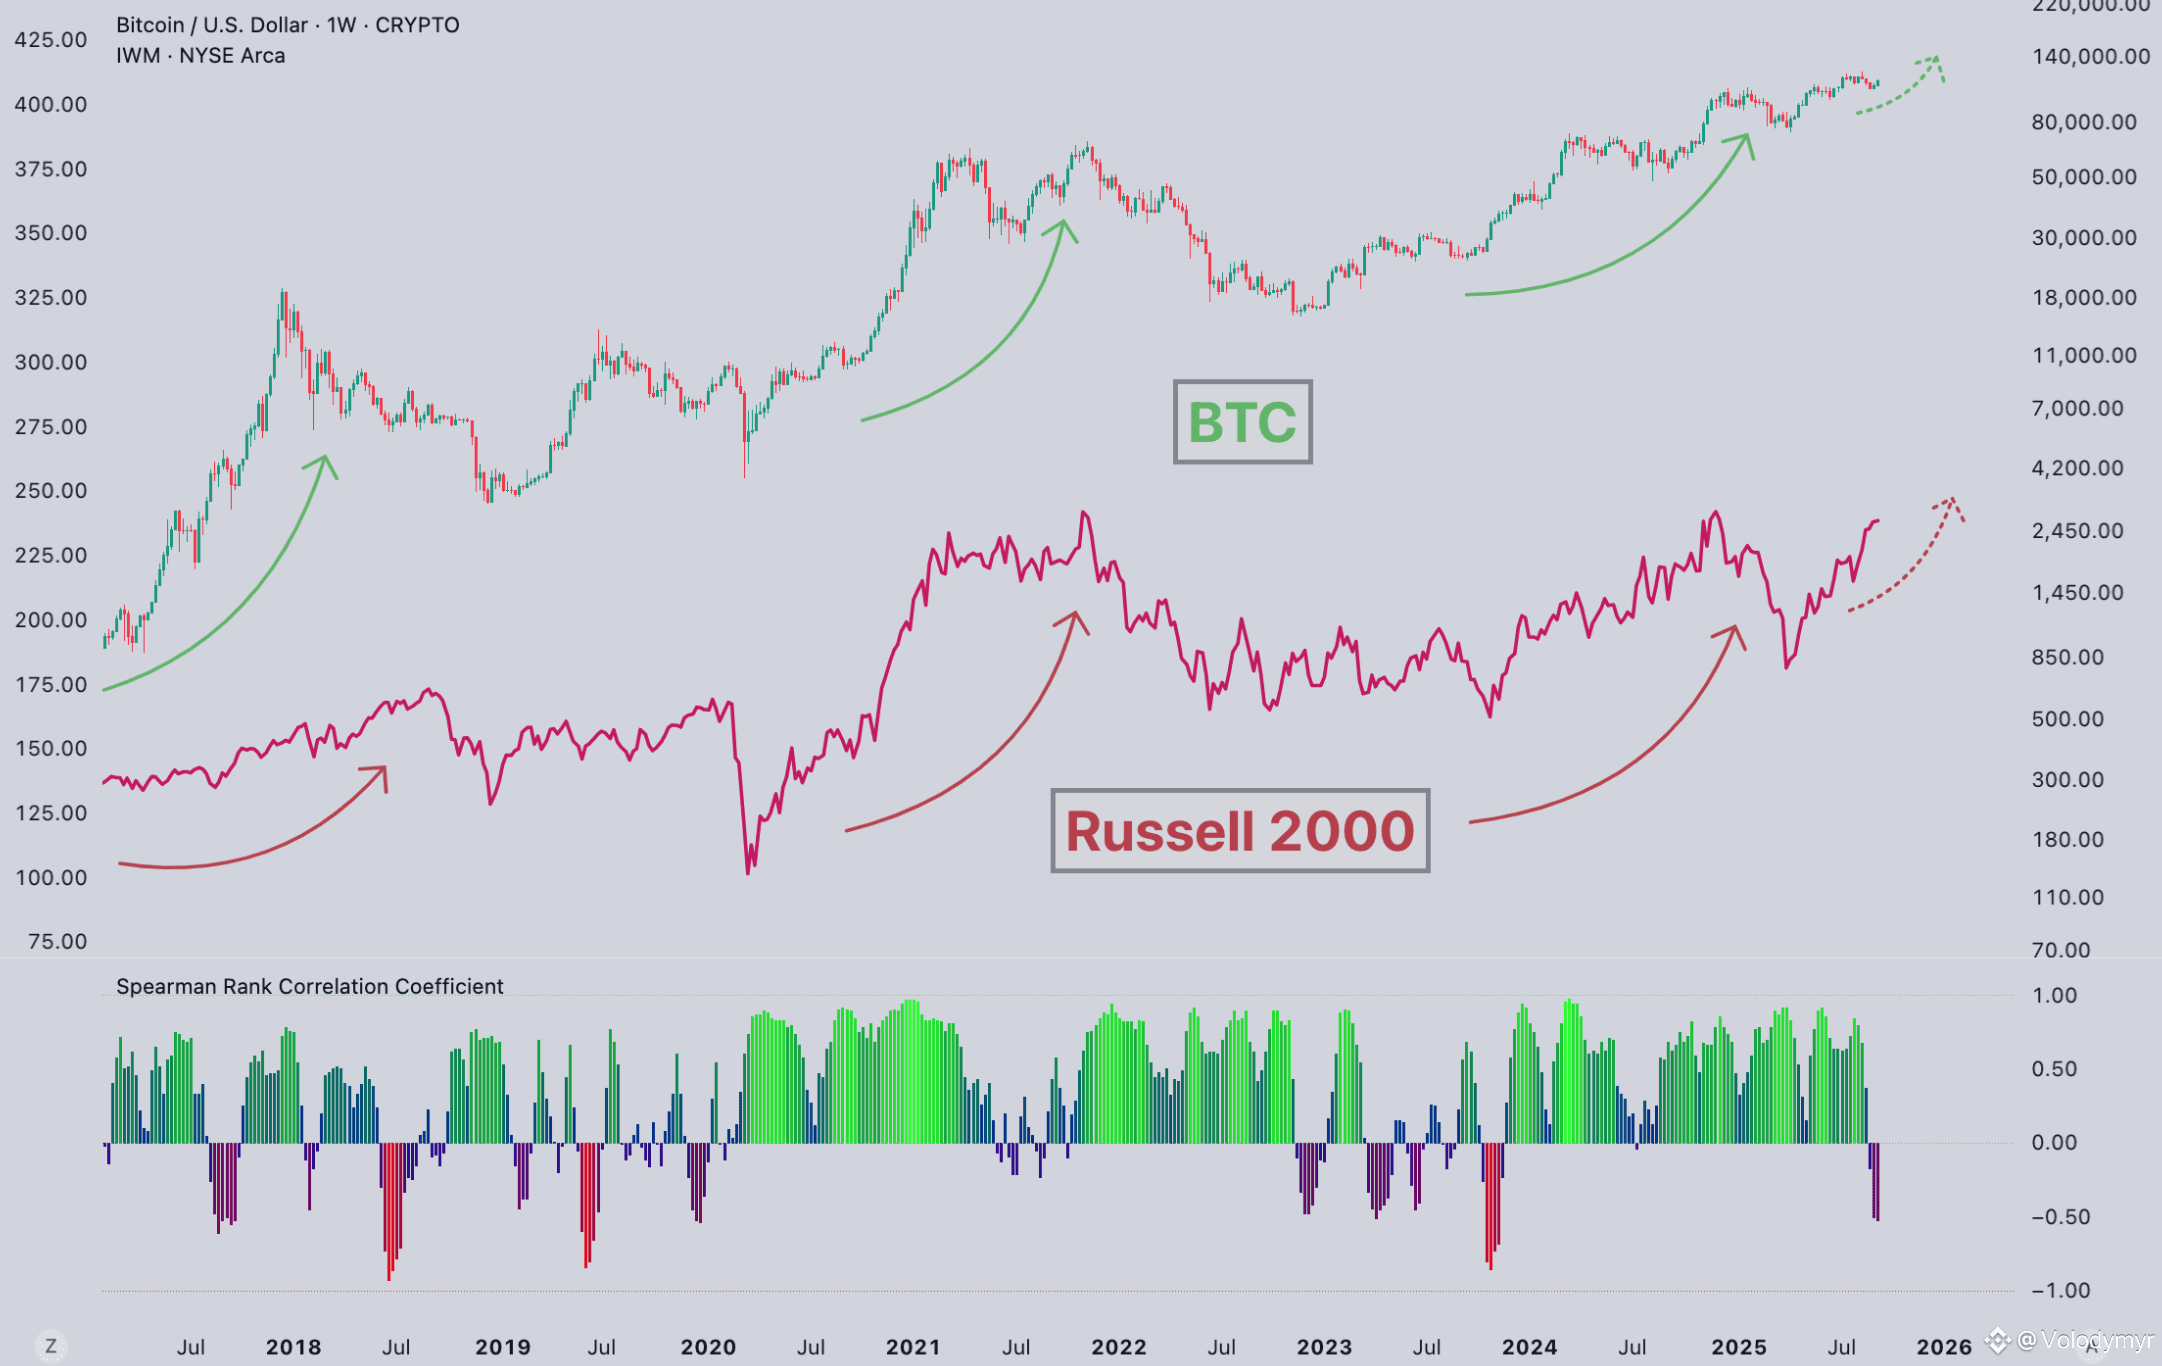
Recently, a view has been circulating: when the Russell 2000 broke out in 2016 and 2020, BTC also started a bull run, hitting both times. Now it has broken out again—will crypto follow?

Looking at the data, it does seem like a leading signal, at least historically validated.
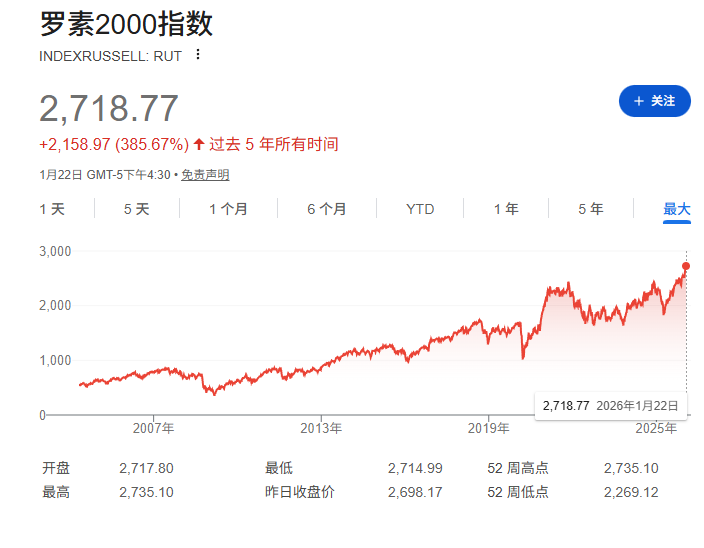
The Russell 2000 tracks the 2,000 smallest companies by market cap in the U.S. stock market, with a median market cap of just over $1 billion. Compared to star stocks like Apple and Microsoft in the S&P 500, these small companies share a common trait: they rely mainly on bank loans for financing, not bond issuance.

When interest rates rise, their financing costs are the first to suffer; when rates fall, they are the first to benefit.

Therefore, traders like to use the Russell 2000 as a "risk appetite thermometer." A new high indicates that the market is willing to put money into higher-risk assets.

There is another layer of logic. Small-cap stocks are concentrated in the U.S. domestic market, unlike globally diversified companies like Apple and Microsoft. A rise in the Russell 2000, to some extent, reflects the domestic economic sentiment in the U.S.

2016 and 2020: Two Breakouts in the Small-Cap Index, Two BTC Takeoffs

First, the data.

In 2016, the Federal Reserve was nearing the end of its rate-hiking cycle, and Trump's election brought expectations of tax cuts, boosting risk appetite. BTC had just undergone a halving, with supply contraction meeting rising demand, leading to the 2017 bull run.

The 2020 breakout was even stronger. The pandemic caused a major crash, and the Fed went all out with money printing, pushing rates to the floor. Institutions entered the market on a large scale for the first time, with MicroStrategy and Tesla buying heavily, driving BTC from over $10,000 to $69,000.

The timing of the Russell 2000 breakout and the BTC bull market确实 aligns in both cases.

But there are only two historical samples.

Looking back to November 2024, the Russell 2000 first broke through its 2021 high. At the same time, BTC was already near $100,000.

From the April 2024 halving, BTC rose from $63,000 to the current $90,000, a gain of about 50%. Sounds good, but compared to the 5x and 27x gains in the same period of the previous two cycles, the difference is significant.
A few possible reasons.

First, institutional entry has dampened volatility. After the ETF approval in January 2024, giants like BlackRock and Fidelity entered the market, with ETFs alone absorbing hundreds of billions of dollars. Institutional money doesn't chase pumps and dumps like retail, smoothing out volatility. The upside is that crashes are less severe, but the downside is the lack of vertical rallies like in 2017.

Second, the marginal effect of halvings is diminishing. After the fourth halving, BTC's annual inflation rate dropped from 1.7% to 0.85%. Sounds like a halving, but 94% of BTC has already been mined. The dilution of new supply on the存量 is getting smaller, and the "supply shock" from halvings is weakening each time.

Third, BTC broke its previous high in March 2024, the first time it has done so before a halving. ETF expectations提前释放了一波 demand, so by the time the halving arrived, the利好 was already priced in.

Coincidence, or the Same Liquidity Logic?

The Russell 2000 and BTC—one is a U.S. small-cap stock index, the other a crypto leader—why would they move in sync?

My understanding is that they are sensitive to the same macro signals.

When the Fed signals easing, money moves out along the risk curve. First to government bonds, then to blue chips, then to small caps, and finally to high-beta assets like crypto.

A Russell 2000 breakout is like a green light in the middle of that chain.

A JPMorgan study last year noted that BTC has the highest correlation with small-cap tech stocks in the Russell 2000. The reason is that crypto projects rely on VC funding, and blockchain innovation is concentrated in small companies rather than large tech giants. Essentially, the people buying small-cap stocks and those buying crypto have similar risk appetites.

But I hesitate to call this a causal relationship. Two samples aren't enough statistically.

Moreover, in 2016 and 2020, BTC itself had its own halving cycle. The Russell 2000 might just have been another macro signal appearing concurrently, not necessarily leading.

Additionally, an interesting phenomenon: although the Russell index is rising, money is flowing out.

In 2025, the Russell 2000 rose over 40%, but U.S. small-cap ETFs saw nearly $20 billion in net outflows for the year. This contrasts sharply with past bull markets—when the index rose, funds flowed in.
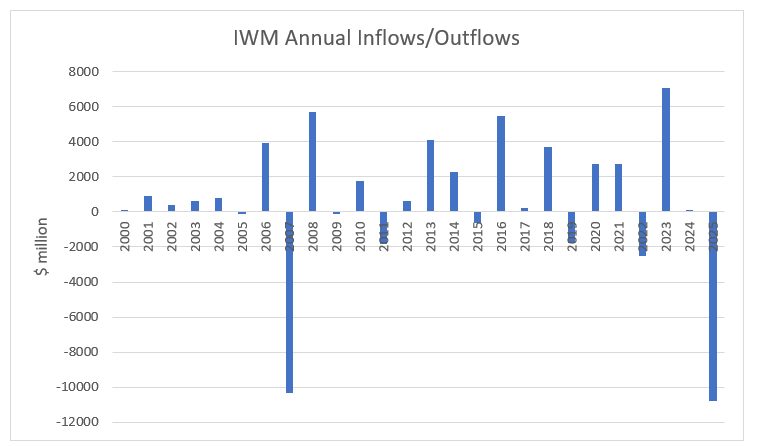
(Source: etf.com)

Another data point: about 40% of companies in the Russell 2000 reported negative earnings in Q3 2025, near a historical high. This proportion has more than doubled since 2007.

The index hits a new high, fundamentals are concerning, and money is still leaving.

How to explain this? One possibility is a few stocks driving the index; another is passive fund rebalancing. But either way, the "return of risk appetite" narrative takes a hit.

Lately, if you follow macro and finance content, you'll notice more voices on investment video blogs and crypto Twitter saying "the Russell 2000 breakout is a leading signal for BTC's rise."

The Russell 2000 breakout确实 was a signal present before the 2016 and 2020 crypto bull markets, and it's here again. It has value as an observation window, but my view is: don't use it as a trading signal.

Two samples can't establish causality, and this cycle has several variables different from before: ETFs changed the capital structure, volatility has been suppressed by institutions, and the halving effect is fading. The old script might not play out the same way.

The "resonance" between the Russell 2000 and BTC might only be answered once this cycle concludes.

Note:

Data sources: Yahoo Finance, TradingEconomics, JPMorgan Research, BeInCrypto. As of January 2026.


Twitter:https://twitter.com/BitpushNewsCN

Bitpush TG Discussion Group:https://t.me/BitPushCommunity

Bitpush TG Subscription: https://t.me/bitpush

Original link:https://www.bitpush.news/articles/7605542

Preguntas relacionadas

QWhat is the Russell 2000 index and why is it considered a 'risk appetite thermometer'?

AThe Russell 2000 index tracks the 2,000 smallest publicly traded companies in the U.S. stock market, with a median market capitalization of just over $1 billion. It is considered a 'risk appetite thermometer' because these small companies rely primarily on bank loans for financing, not bond issuance. When interest rates rise, their financing costs are the first to become unsustainable, and when rates fall, they are the first to benefit. Therefore, its new highs indicate that the market is willing to put money into higher-risk assets.

QAccording to the article, what historical correlation exists between the Russell 2000 index and Bitcoin's price?

AHistorically, there have been two instances where a breakout of the Russell 2000 index preceded a major Bitcoin bull run. The first was in 2016, which led into the 2017 bull market. The second was in 2020, which was followed by Bitcoin's price rising from over $10,000 to $69,000. The article notes, however, that this is only a correlation based on two data points and does not necessarily imply causation.

QWhat are the three reasons the article suggests for Bitcoin's more modest 50% gain post-halving in 2024 compared to previous cycles?

AThe three reasons are: 1) Institutional adoption through ETFs has dampened volatility, as large inflows from firms like BlackRock and Fidelity have a stabilizing effect that prevents the extreme price surges seen in retail-driven markets. 2) The marginal effect of the Bitcoin halving is diminishing; with 94% of BTC already mined, the supply shock from each halving is weaker. 3) Bitcoin's price reached a new all-time high in March 2024 *before* the halving, meaning much of the positive demand effect from the ETF approval was already priced in.

QDespite the Russell 2000 hitting new highs, what contradictory data points suggest the 'risk-on' narrative might be flawed?

AContradictory data includes: 1) U.S. small-cap ETFs saw net outflows of nearly $20 billion in 2025, even as the index rose over 40%, which is the opposite of typical bull market behavior where money flows into rising assets. 2) Approximately 40% of the companies in the Russell 2000 reported negative earnings in Q3 2025, a proportion that has more than doubled since 2007, indicating weak underlying fundamentals despite the index's performance.

QWhat is the article's final conclusion on using the Russell 2000 breakout as a trading signal for crypto?

AThe article concludes that while the Russell 2000 breakout is a valuable observational signal that has appeared before past crypto bull markets, it should not be used as a direct trading signal. The reasoning is that the correlation is based on only two historical samples, and the current cycle has key differences—such as the impact of ETFs, dampened volatility, and a weaker halving effect—that mean the 'old script' may not play out the same way.

Lecturas Relacionadas

Within Strategy's Framework, STRC's Dividend Yield Remains at 12% as Share Price Stays Below Par Value

Michael Saylor, Executive Chairman of Strategy (MSTR), confirmed that the dividend rate for its STRC perpetual preferred shares will remain at 12.00% through August 2026. The rate has increased from 9% at its July 2025 launch to the current high via a "ratchet" mechanism, which permanently raises the rate by 0.5% whenever the share price falls below $95. This mechanism is intended to push the price back toward its $100 par value and support Strategy's "at-the-market" (ATM) program for issuing new shares to fund Bitcoin purchases. However, the mechanism has not worked as intended. STRC shares closed at $89.46 on July 31, remaining about 10-11% below par value despite the record-high dividend. Competition from rival Strive's higher-yielding SATA securities has pressured demand. The persistent discount has forced Strategy to suspend new STRC issuances via its ATM program, limiting this funding channel for Bitcoin acquisitions. STRC's struggles reflect Bitcoin's own volatility, as the preferred shares historically move in tandem. Analysts have warned the ratchet structure carries long-term, one-way risk. A law firm is investigating Strategy's ability to maintain dividend payments if Bitcoin's price stays low. Retail investors own roughly 83% of outstanding STRC shares, a group seen as prone to panic selling during downturns. In response, Strategy has established financial reserves, including a liquidity cushion covering about 26 months of dividend/interest obligations, and a $2 billion share buyback program alongside a Bitcoin monetization framework, though the company emphasized it is not obligated to sell any Bitcoin.

cryptonews.ruHace 19 min(s)

Within Strategy's Framework, STRC's Dividend Yield Remains at 12% as Share Price Stays Below Par Value

cryptonews.ruHace 19 min(s)

Analyst: Bitcoin's Price Will Drop to $60k in August, Then Rebound to $70k

Financial analyst Andrey Poroshin has provided a new forecast for Bitcoin's price dynamics in August. Poroshin, an analyst at the Bitbanker exchange, expects the cryptocurrency market to experience a downturn this month, with prices retesting the $60,000 level due to a lack of supportive macroeconomic catalysts. He noted that the recent US Federal Reserve decision to hold interest rates did not significantly impact the market, while inflation remains above the 2% target. Poroshin stated that Bitcoin is ending July under pressure from moderate volatility and a lack of new macroeconomic stimuli, leading to continued market caution. According to his base scenario, Bitcoin will drop to a range of $60,000 to $62,000 before recovering to $70,000. He pointed out that even $70,000 remains below the cost of mining in the US, which has prompted some miners to shift towards AI data center operations. Poroshin cited the winding down of BitMEX's operations as a potential catalyst for a price rebound, suggesting the exit of weaker players often coincides with market reversals and reduced short-term selling pressure. He believes Bitcoin is currently less susceptible to geopolitical shocks, such as the Iran-US conflict, and does not expect significant market changes in August related to the pending CLARITY Act. Looking ahead, Poroshin forecasts that September will bring more active price fluctuations driven by potential Fed rate decisions and possible discussions or approval of the CLARITY Act.

cryptonews.ruHace 19 min(s)

Analyst: Bitcoin's Price Will Drop to $60k in August, Then Rebound to $70k

cryptonews.ruHace 19 min(s)

Trading

Spot
活动图片





