Q2 Wall Street Institutional Crypto Holdings: Most Institutions Increased Positions Against the Trend, ETH Exposure Outperformed BTC Across the Board

marsbitPublicado a 2026-08-19Actualizado a 2026-08-19

Resumen

In Q2 2024, despite a roughly 14.2% decline in Bitcoin's price, many Wall Street institutions increased their crypto holdings, revealing a divergence from ETF flow trends. Overall institutional Bitcoin exposure grew by 7.5% to ~536k BTC, while aggregate spot Bitcoin ETF holdings declined. Notably, exposure concentration increased, with fewer reporting institutions holding larger positions. A key trend was the significant outperformance of Ethereum (ETH) exposure growth over Bitcoin (BTC) among major banks. For instance, JPMorgan's ETH exposure surged 67.3% versus 12.2% for BTC, and Morgan Stanley's ETH exposure grew 18.6% versus 3.7%. Individual bank holdings of Ethereum ETFs like ETHA saw dramatic increases, even as the overall Ethereum ETF market experienced net outflows during the quarter. Trading firms like Jane Street significantly rebuilt its iShares Bitcoin Trust (IBIT) position, while several hedge funds, including Brevan Howard and Graham Capital, reduced spot ETF holdings but added substantial option positions (both calls and puts), indicating more complex strategies. Institutions showed diverging views on crypto-related equities: some sold shares of MicroStrategy (MSTR) after its announced Bitcoin sales, while others like Renaissance Technologies and BlackRock were buyers. New entrants like Spain's Santander Bank disclosed initial crypto ETF positions. Meanwhile, long-term holders like Abu Dhabi's sovereign wealth funds paused their accumulation, and Harvard's e...

August 14th was the statutory deadline for US SEC-required institutional investors to submit Q2 13F forms. After the centralized disclosure of these documents, Wall Street's crypto holdings were once again laid bare.

This quarter's institutional movements formed a stark contrast with price trends. Bitcoin price fell approximately 14.2%, yet institutional crypto holdings reported in filings increased instead.

According to Bitcoin Strategy's calculations based on 13F data, institutional Bitcoin holdings rose from approximately 498,000 to about 536,000 BTC, a quarter-on-quarter increase of 7.5%. In contrast, total ETF holdings decreased from about 1.297 million to roughly 1.211 million BTC during the same period.
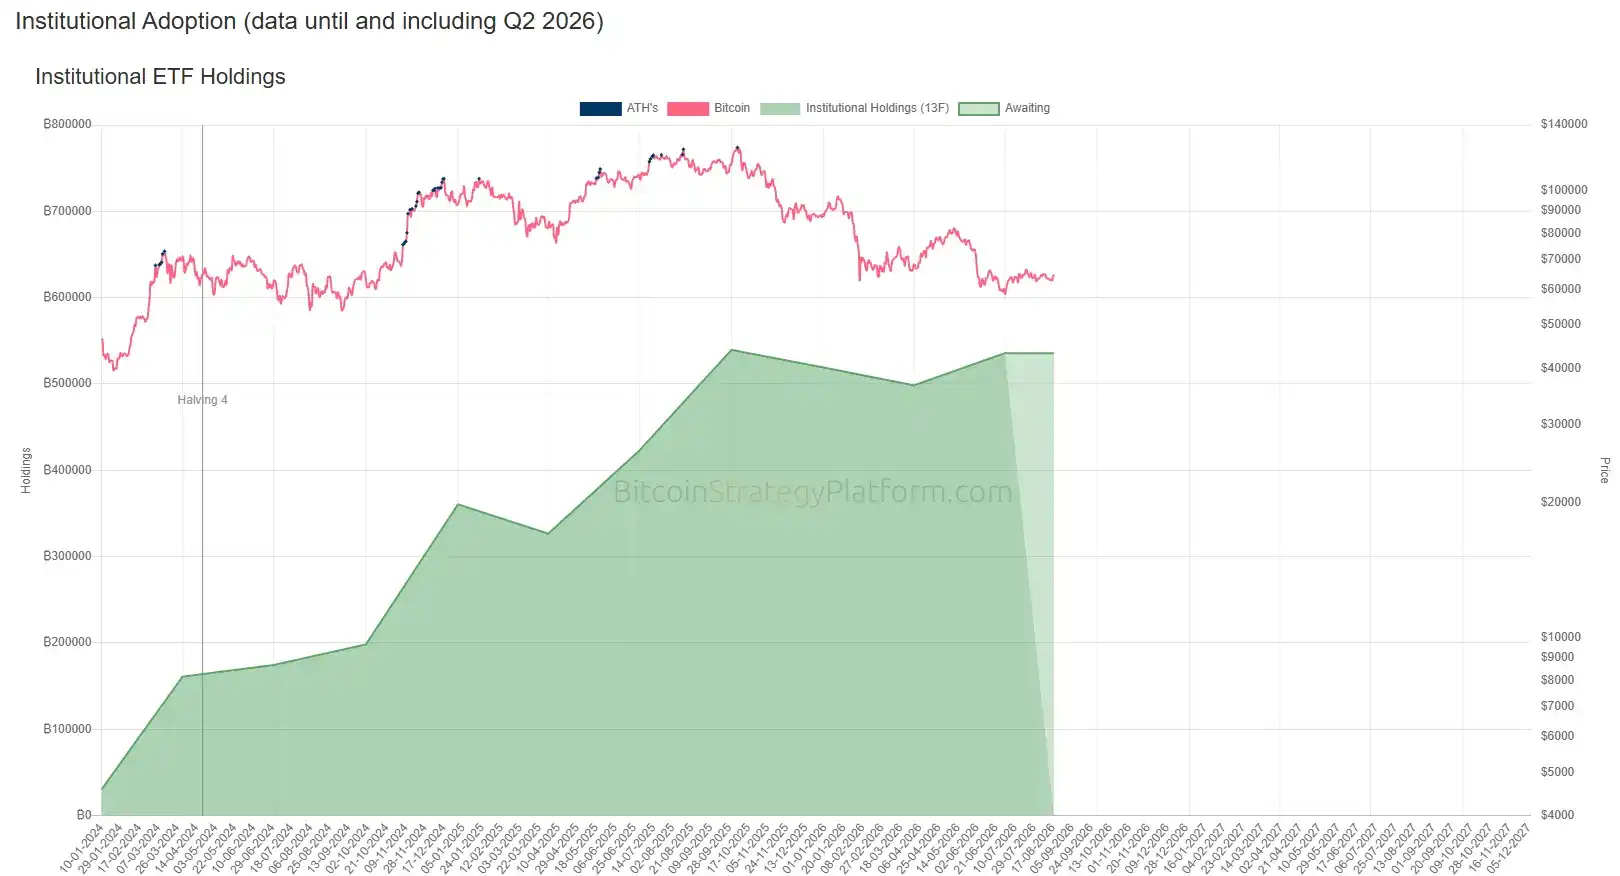
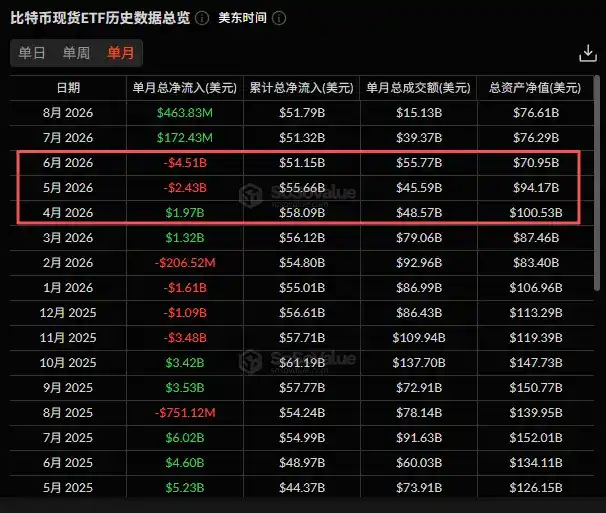
According to SoSoValue data, US spot Bitcoin ETFs experienced sustained net redemptions in Q2, with net outflows of approximately $2.4 billion and $4.5 billion in May and June respectively, with June setting the worst monthly record since launch. Spot Ethereum ETFs also saw cumulative net outflows of about $700 million during the same period.
Simultaneously, holdings are concentrating towards the top. The number of institutions reporting Bitcoin holdings decreased from about 2,000 to roughly 1,900. According to Bloomberg data, as of August 13, the iShares Bitcoin Trust (IBIT) alone had approximately 1,500 institutional holders and net assets of about $47.35 billion.

Ethereum Growth at Banks Outperformed Bitcoin Across the Board

Previously, ChainCatcher noted in its Q1 holdings summary: Institutional interest in Ethereum allocation was increasing, with Jane Street, Wells Fargo, and JPMorgan adding Ethereum ETFs during outflow phases. In Q2, this trend solidified on the banking side.

According to DWF Labs calculations based on corresponding crypto asset quantities, Morgan Stanley's Q2 BTC exposure grew 3.7% QoQ, while its ETH exposure grew 18.6%. JPMorgan's BTC exposure grew 12.2%, while its ETH exposure grew 67.3%. Both banks saw ETH growth rates significantly higher than BTC.

On an individual product level, it's more intuitive. Morgan Stanley's ETHA holdings increased by about 202% to 4.6 million shares, JPMorgan's ETHA increased by about 338% to nearly 1.17 million shares, and Bank of America's ETHA surged from about 67,500 shares to about 1.98 million shares, roughly 29 times the previous amount.

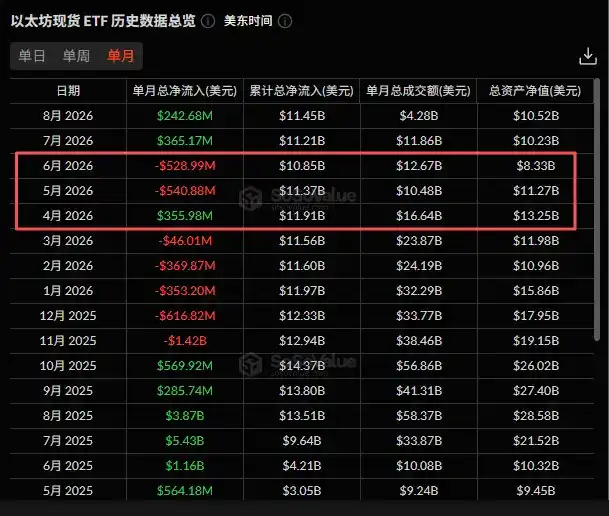
However, in reality, spot Ethereum ETFs saw net outflows overall in Q2. SoSoValue data shows that while there were about $356 million in net inflows in April, May and June saw net outflows of approximately $541 million and $529 million respectively, resulting in combined Q2 net outflows of about $714 million.
Jane Street Bought Back, Hedge Funds Moved Positions into Options

Last quarter, Jane Street cut its IBIT holdings by about 71%, leading the market to speculate it was bearish on Bitcoin. This quarter, it turned around and added back approximately 24.9 million shares of IBIT, a QoQ surge of about 324%, making it one of the largest buyers for the quarter. Currently, its spot Bitcoin ETF exposure is about $990 million, with approximately $828 million in IBIT.

As an authorized participant and market maker, its quarter-end inventory is related to creations/redemptions and hedging. A large addition in spot does not equate to a directional bet.

Notably, 13F only reports quarter-end spot long positions. If options are included, the profile of several institutions would also reverse.

Global macro hedge fund Brevan Howard cut its spot IBIT holdings from 24.3 million to 7.21 million shares in Q2, a reduction of about 70.4%. However, it simultaneously held call options corresponding to about 7.23 million IBIT shares and put options for 5.27 million shares.

Graham Capital reduced its spot IBIT holdings from about 926,000 to 259,000 shares during the same period, a cut of about 72%, yet held put options corresponding to approximately 1.74 million IBIT shares, with a reported value of about $57.94 million. Multi-strategy giant Millennium reduced its spot IBIT holdings from about 19.29 million to 9.69 million shares, a cut of about 49.8%.

UBS's directly held IBIT only increased by about 12% to 407,890 shares, while its call options exposure surged from 80,000 shares to about 1.95 million shares, a quarterly increase of over 24 times, while put options were reduced by about 53% during the same period.

In contrast, actions by Paul Tudor Jones's fund Tudor appear contradictory, increasing spot IBIT holdings by nearly 20% to 688,500 shares, ending nearly a year of reductions, while cutting IBIT-linked call options by about 85%, from 998,000 to about 148,000 shares.

Institutions Diverge on Crypto-Related Stocks

Our previous article noted that crypto-related stocks are becoming unavoidable allocation options for institutions. Among these, MicroStrategy (MSTR) is the most representative.

In Q2, MicroStrategy tore a hole in its "never sell Bitcoin" myth: at the end of May, it sold 32 bitcoins for the first time to pay preferred stock dividends, and on June 29, its board authorized a framework for bitcoin monetization of up to $1.25 billion.

The 13F snapshot is as of June 30; the actual larger sell-off occurred post-quarter, altering the narrative around BTC proxy plays.

Filings show Bank of America reduced its MSTR holdings from about 3.97 million to about 1.18 million shares, cutting about 70%. Renaissance Technologies, conversely, newly purchased 422,881 MSTR shares, increasing its total holdings to 2.55 million shares valued at approximately $242.3 million. BlackRock also added MSTR holdings to about 19.39 million shares, worth about $1.69 billion. However, as the world's largest index provider, BlackRock's addition may be more due to passive index-based allocation.

Renaissance Technologies newly purchased 422,881 shares of MicroStrategy, increasing its total holdings to 2.55 million shares with a value of $242.3 million, a 20% increase. Royal Bank of Canada (RBC) increased its MSTR holdings by 46,000 shares, now holding a total of approximately 385,000 shares with a total value of about $37.2 million, a 13.5% increase from before.

Additionally, Circle is one of the few related names receiving shared bullish sentiment. Morgan Stanley significantly increased its holdings from about 1.46 million to about 8.32 million shares, and ARK also slightly increased its holdings by about 1% to 4.56 million shares. Regarding Coinbase, the two institutions operated in completely opposite directions: Morgan Stanley reduced its holdings by about 550,000 shares, while ARK increased its holdings by about 5.8% to 2.51 million shares, while cutting Robinhood holdings by about 12.8%.

Notably, ARK's weighting of Circle in its portfolio dropped from about 3.34% in Q1 to 1.85%, but the actual share count slightly increased. The decline in weighting was mainly due to dilution after initiating a new position in SpaceX, which expanded the portfolio.

Furthermore, after significantly increasing its Circle holdings in Q2, Morgan Stanley cut its target price for CRCL from $106 to $38 in early August, citing that the contraction in USDC's scale exposed the sensitivity of Circle's reserve income, indicating a shift in revenue structure towards lower-margin transaction income.

New Money Enters for the First Time, Old Money Holds Steady

In Q2, Spain's Banco Santander disclosed Bitcoin and Ethereum ETF holdings for the first time, though the positions are minuscule relative to its over $10 billion US stock portfolio. UBS's crypto exposure is also rising quarter by quarter, this quarter adding a position worth about $1.5 million in the miner American Bitcoin Corp.

Morgan Stanley also newly established positions in Grayscale Solana Staking ETF and Fidelity Solana Fund in Q2, with market values of approximately $4.25 million and $2.26 million respectively; JPMorgan also established a new position in Bitwise Solana Staking ETF and bought back the XRP it had cleared in Q1, making small initial positions via Bitwise and Grayscale's XRP funds.

Additionally, investment advisory firm Edelman Financial Engines disclosed holdings of approximately $34 million in spot Bitcoin ETF positions, primarily allocated to BlackRock iShares Bitcoin Trust (IBIT) and Grayscale products. While this scale still represents a small portion of its overall portfolio, it already exceeds its holdings in Amazon, valued at around $25 million.

Abu Dhabi's Mubadala and the Abu Dhabi Investment Council maintained their IBIT holdings unchanged at approximately 14,721,900 and 8,218,700 shares respectively, totaling about $764 million, pausing their consecutive multi-quarter accumulation trend in Q2.

Harvard University Endowment's IBIT holdings remained precisely unchanged at about 3,044,600 shares, valued at approximately $101.4 million, ending two consecutive quarters of reductions. Its combined holdings in gold products iShares Gold Trust and SPDR Gold Trust total about $171.2 million, now exceeding its Bitcoin holdings.

Signals from Institutional Crypto Allocation Changes

Looking at this quarter's institutional actions collectively, several directional signals are taking shape.

First, ETF fund flows have decoupled from institutional behavior, indicating deepening institutionalization of crypto assets.

Second, institutional divergence on crypto-related stock names is growing, especially after MicroStrategy began selling bitcoin.

Additionally, Ethereum has become a clear buy-side focus among institutions, with Q3 fund flows also turning accordingly.

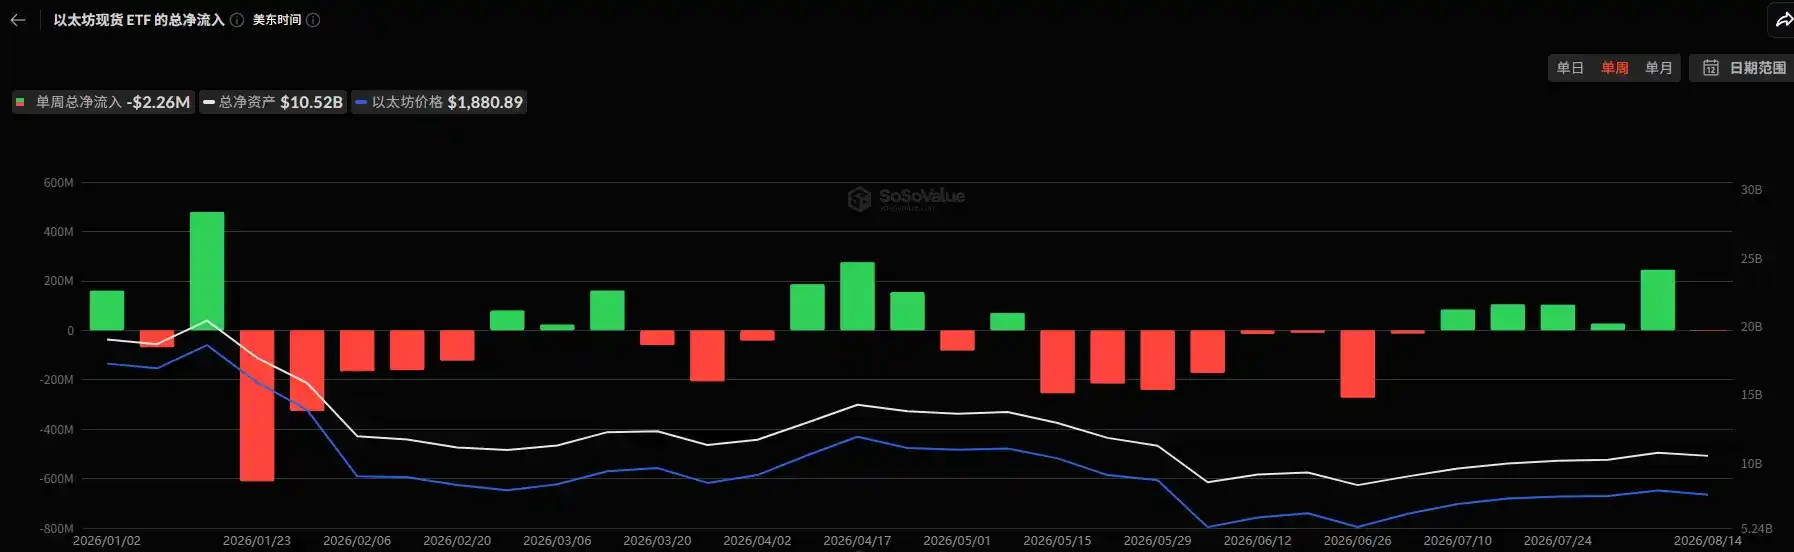
According to SoSoValue data, Ethereum ETFs saw net inflows of approximately $365 million in July and about $243 million so far in August, totaling over $600 million for the two months; ETH price has recovered from around $1,570 at the end of June to near $1,900 currently, a gain of about 20%.
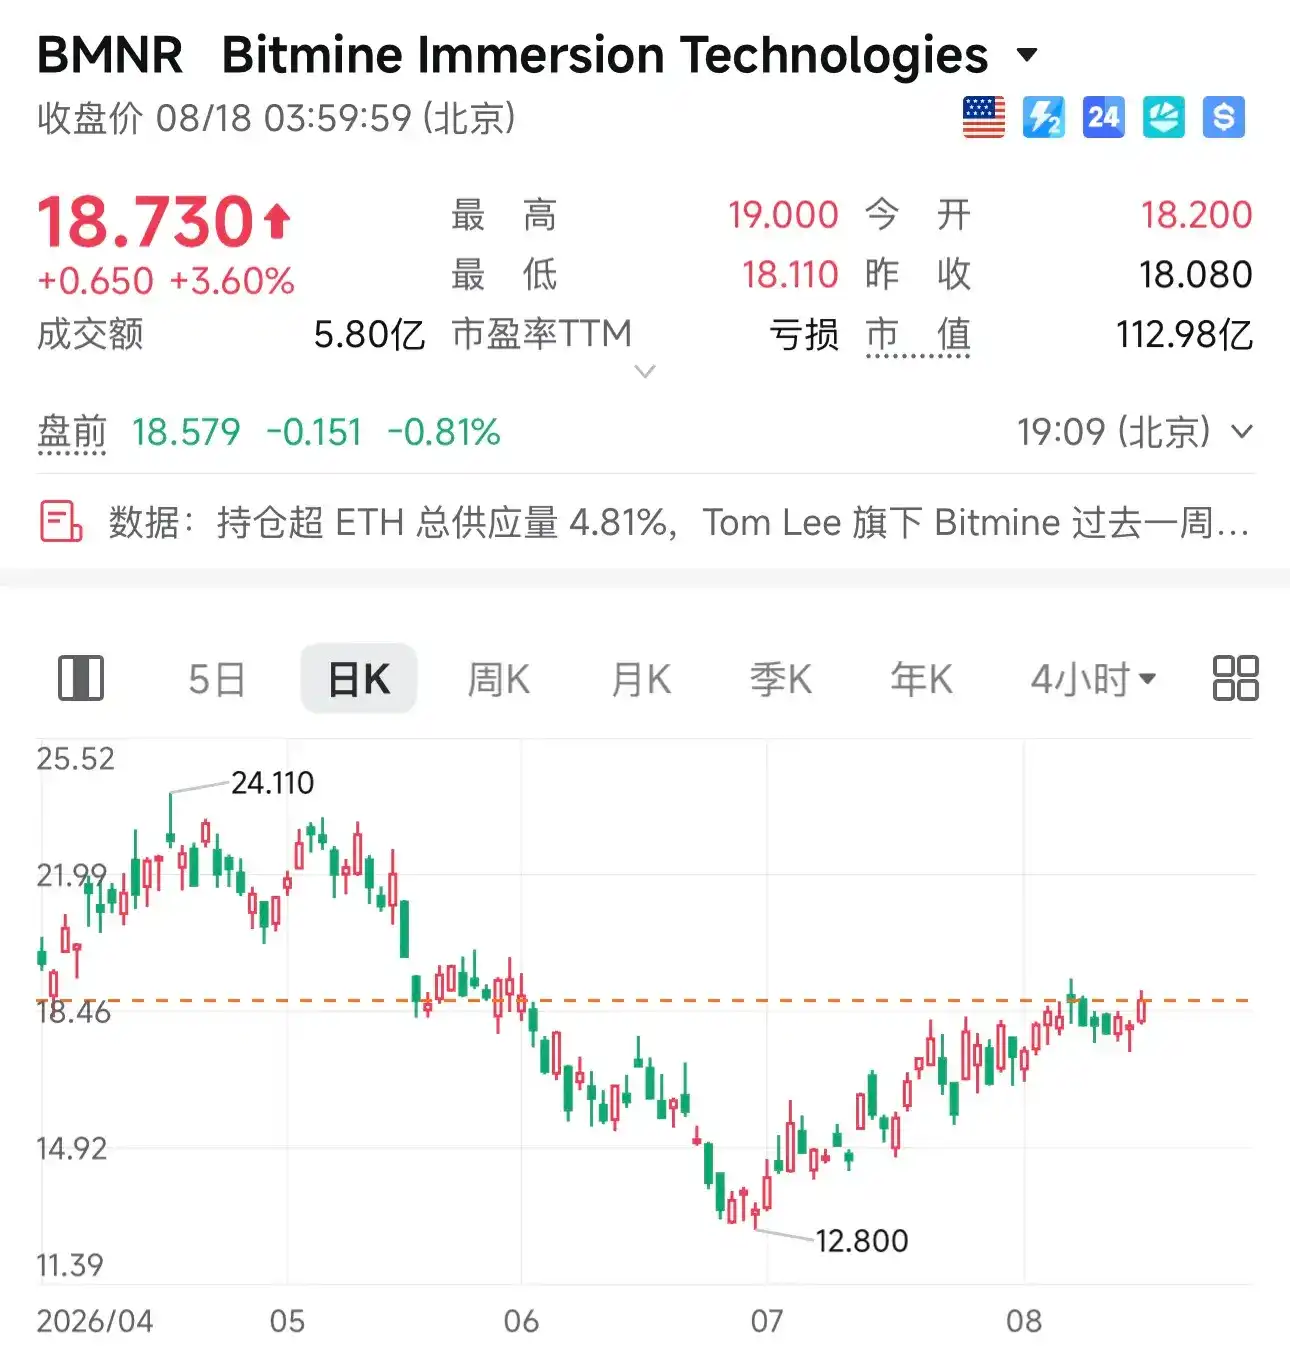
Even Ethereum treasury company BitMine has strengthened in sync, with its stock price rising from about $13.3 at the end of June to nearly $19, an increase of about 40%.
Preguntas relacionadas

QAccording to the article, what was the main trend in Wall Street institutions' Bitcoin holdings in Q2 compared to Bitcoin's price performance?

ADespite Bitcoin's price dropping approximately 14.2% in Q2, institutional Bitcoin holdings increased by about 7.5%, from roughly 498,000 to 536,000 coins, indicating institutions were buying against the trend.

QHow did the growth rates of institutional Ethereum (ETH) exposure compare to Bitcoin (BTC) exposure at major banks like Morgan Stanley and JPMorgan in Q2?

AAt Morgan Stanley, ETH exposure grew 18.6% compared to BTC's 3.7% growth. At JPMorgan, ETH exposure surged 67.3% compared to BTC's 12.2% growth, showing ETH's growth rate significantly outpaced BTC's at these banks.

QWhat significant action did Jane Street take regarding its IBIT (iShares Bitcoin Trust) holdings in Q2, and how should this be interpreted?

AJane Street increased its IBIT holdings by approximately 324% to about 24.9 million shares, making it one of the largest buyers for the quarter. However, as an Authorized Participant and market maker, this large addition in spot holdings is related to its creation/redemption and hedging activities and does not necessarily indicate a directional bet on Bitcoin.

QHow did the actions of some major hedge funds regarding Bitcoin exposure in Q2 differ when considering their options positions alongside their reported spot ETF holdings?

ASeveral hedge funds reduced their spot Bitcoin ETF holdings but simultaneously held significant options positions. For example, Brevan Howard cut its spot IBIT by 70.4% but held call options for ~7.23 million IBIT shares and put options for ~5.27 million shares. This shows a more complex, potentially hedged or tactical strategy than a simple reduction in exposure.

QWhat were the key directional signals regarding institutional cryptocurrency configuration identified from the Q2 13F data in the article?

AThe key signals were: 1) A decoupling between ETF fund flows (which were negative) and institutional holdings (which increased), signaling deepening institutionalization. 2) Growing divergence in institutional views on crypto-related stocks, especially after MicroStrategy's decision to sell Bitcoin. 3) Ethereum emerged as a clear buy-side target for institutions, with subsequent positive ETF inflows and price appreciation in Q3.

Lecturas Relacionadas

Token Economy Surges, Have Ordinary People Got a Slice of the Pie?

Token Frenzy: Is the Average Person Getting a Piece of the Pie? As AI adoption soars in China, daily Token consumption—the basic unit for AI text processing—has skyrocketed, exceeding 140 trillion. This "Token economy" is often measured like GDP, touted as a sign of progress. However, this metric primarily reflects supply-side activities: corporate investment, infrastructure scaling, and platform revenues. The crucial question of whether this growth translates into tangible benefits for ordinary citizens—higher wages, better jobs, improved public services, or increased leisure—remains largely unanswered. The article argues there's a fundamental mismatch. Policy, exemplified by subsidies in Beijing's Yizhuang district, often stimulates "demand" by incentivizing companies to consume more Tokens (an intermediate business cost), rather than by boosting household income or final consumer spending. This creates a closed loop where growth in Token usage justifies further production capacity expansion, without necessarily extending value to the broader population. Several disconnects are highlighted. High Token usage doesn't equal completed tasks, increased profits, or macroeconomic productivity gains. Even when corporate efficiency improves, the benefits may not trickle down due to existing economic structures favoring investment over household consumption. The risk is that AI, a genuinely productive technology, becomes another tool for supply-side expansion within a system adept at measuring output (like server capacity and call volumes) but less focused on distributing the gains widely. Drawing a parallel to Henry Ford's assembly line, the piece notes that Ford's revolution combined ruthless production efficiency with a social compact (higher wages, stability) that enabled mass consumption. Today's "Token economy" narrative enthusiastically champions the first part—process re-engineering and cost reduction—but lacks a credible mechanism for the second: ensuring that productivity gains lead to broader societal welfare. The ultimate challenge is not whether Tokens have value, but whether their economic benefits can escape a system that excels at building supply but struggles to cultivate its own demand.

marsbitHace 42 min(s)

Token Economy Surges, Have Ordinary People Got a Slice of the Pie?

marsbitHace 42 min(s)

Overnight Global Shock: Why Did AI Stocks Plunge Across the Board?

Overnight, U.S. AI-related stocks fell sharply, with the Nasdaq down 1.33% and the Philadelphia Semiconductor Index plunging nearly 5%. Panic spread globally, dragging down Asia-Pacific markets. Key negative drivers included: 1. **Geopolitical Tension & Macro Pressure:** Escalating U.S.-Iran tensions pushed oil prices higher, fueling inflation fears and expectations of prolonged high interest rates. Rising bond yields pressured high-valuation, capital-intensive AI stocks, especially as soaring AI infrastructure financing costs became evident. 2. **AI Commercialization Concerns:** OpenAI's Q2 results showed slowing revenue growth and widening losses, dampening market optimism about near-term AI application profitability. This shifted investor focus from pure capital expenditure narratives to actual commercial returns. 3. **Supply Chain Uncertainty:** U.S.-South Korea semiconductor investment disputes intensified. Market fears that Korean memory giants (Samsung, SK Hynix) face a dilemma—either divert capital to costly U.S. production or risk trade barriers—disrupted the critical HBM memory sector, amplifying sell-offs via leveraged ETFs. While long-term AI demand remains, the market is now scrutinizing real profitability, financing costs, and supply chain stability rather than paying premiums for unchecked growth stories. For markets like China's A-shares, the impact is primarily sentiment-driven, requiring distinction between short-term panic and fundamental deterioration.

marsbitHace 43 min(s)

Overnight Global Shock: Why Did AI Stocks Plunge Across the Board?

marsbitHace 43 min(s)

TSMC, Another Winning Bet

TSMC Gains Another Strategic Advantage as Samsung Delays 1.4nm Process Samsung Foundry has adjusted its advanced process roadmap, postponing the mass production timeline for its 1.4nm process from 2027 to 2029. This two-year delay signals a strategic shift from aggressively pursuing the next node to focusing on maturing and scaling its 2nm platform. Samsung plans to extend the commercial lifespan of its 2nm technology through derivative versions optimized for different applications, including those incorporating backside power delivery for AI and HPC chips. A notable aspect of this shift is Samsung's cautious approach toward High-NA EUV lithography. The company views it as essential for 1nm-class nodes and beyond but not as an immediate necessity for 1.4nm, opting instead to refine its existing Low-NA EUV-based processes. This highlights a broader industry trend where the competition is evolving beyond simply reaching the next node. Success now depends on achieving high yield, managing soaring costs, integrating new transistor architectures like GAA, and delivering a compelling overall package of performance, power efficiency, and area (PPA) at a viable cost. While Samsung consolidates its 2nm efforts, TSMC continues its advance. Its N2 node is in production, and the A16 node (post-2nm, ~1.6nm) is scheduled for mass production in the second half of 2026. A16 introduces TSMC's Super Power Rail backside power delivery technology, which is expected to deliver significant performance and power efficiency gains. TSMC's previously stated cautious stance on High-NA EUV appears validated by Samsung's roadmap adjustment. The delay underscores that the competition in leading-edge semiconductor manufacturing is entering a new phase. It is no longer just a race to smaller node numbers but a multifaceted contest involving process maturity, yield, cost, design-technology co-optimization (DTCO), and advanced packaging. Samsung aims to solidify its 2nm platform over the next three years. However, as it targets 1.4nm for 2029, the industry will be watching how far ahead TSMC and Intel have moved by then.

marsbitHace 1 hora(s)

TSMC, Another Winning Bet

marsbitHace 1 hora(s)

Trading

Spot
活动图片