
"Poor Man's Gold" Is No Longer Cheap!

marsbitPublicado a 2026-01-23Actualizado a 2026-01-23

Resumen

"Silver, once known as 'poor man's gold,' is undergoing a fundamental revaluation as it shifts from a financial derivative of gold to a critical industrial material facing a structural supply deficit. The market is no longer treating silver as just a cheaper alternative to gold. Since 2021, the global silver market has experienced a sustained physical deficit, not from financial cycles, but from booming industrial demand. Key drivers include the photovoltaic (PV) sector, where silver is essential and difficult to substitute, with demand reaching 198 million ounces in 2024. Electric vehicles and AI infrastructure further contribute to this inelastic, high-reliability demand. Crucially, supply cannot keep pace. Over 70% of silver production is a by-product of mining for base metals like copper, zinc, and lead, meaning its output is unresponsive to silver price signals. Mine production grew less than 1% in 2024. With visible inventories covering only 1-1.5 months of consumption—below the 3-month safety threshold—the market is moving from cyclical shortage to structural tightness. Silver has shed its identity as gold's shadow and is now a strategically consumed industrial commodity, making its historic undervaluation a thing of the past."

Author: Yan Wai Zhi Yi, Wall Street Insights

In the past, silver was called "poor man's gold" not because it was truly cheap, but because the market never took its scarcity seriously.

Ample supply, adjustable inventories, and dispersed uses—for a long time, the market firmly believed that no matter how demand fluctuated, silver could always be quickly replenished. Because of this, it could be repeatedly traded as a shadow of gold but was almost never seriously allocated.

But this premise has been shattered by reality.

Since 2021, the global silver market has experienced a physical supply-demand deficit for several consecutive years. Unlike the short-term tightness amplified by previous financial cycles, this deficit stems directly from the industrial side: demand for silver in key sectors such as photovoltaics, electrification, and high-end electronics is expanding rapidly and simultaneously, while supply can hardly keep pace.

More critically, silver's supply system is highly unresponsive to price signals.

Over 70% of global silver production comes as a by-product of other metals, with production rhythms determined by the investment cycles of copper, lead, and zinc, not by the price of silver itself. This means that even if prices rise, supply cannot quickly increase; when buffer inventories are continuously depleted, the market faces not temporary fluctuations but sustained constraints.

It is at this moment that silver truly begins to break free from the "poor man's gold" narrative. It is no longer just a cheap alternative when gold rises but is becoming a material that is continuously consumed by key industries and is difficult to replace.
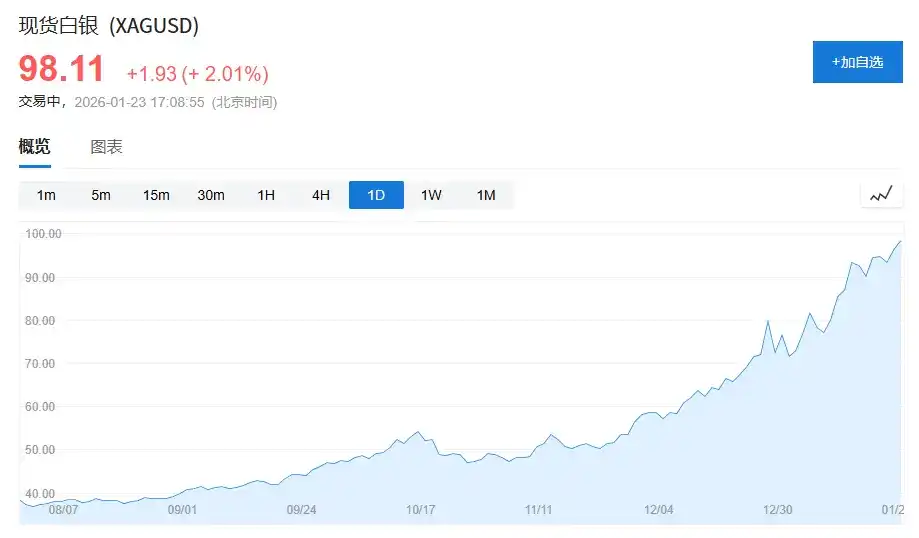
(Silver prices approach $100 per ounce. In mid-October last year, silver was only $50/ounce, nearly doubling in 3 months.)

1. Silver's "Identity Dilemma": Stuck Between Gold and Industrial Metals

To understand why silver has long been undervalued, one must first understand its "identity dilemma."

In the modern commodity system, assets can be broadly divided into two categories:

One is credit-based assets, typically represented by gold. Gold's value anchor does not come from industrial use but from the credit system and reserve demand. Even in the weakest years of demand, global central banks' net gold purchases still account for 15%–25% of total demand, providing a stable foundation for its price.

The other is growth assets, such as copper, crude oil, and iron ore. These metals have almost no financial attributes; their prices are mainly driven by economic cycles, infrastructure, and manufacturing investment.

Silver, however, is stuck between these two.

According to the "World Silver Survey 2025," global silver demand in 2024 was 1.164 billion ounces (approx. 36,200 tons), of which:

Industrial demand was 681 million ounces, accounting for about 58%;

Jewelry and silverware demand was 263 million ounces, accounting for about 23%;

Investment demand (bars, coins, ETFs) was about 191 million ounces, accounting for about 16%.

The problem is that these three types of demand have completely different behavioral patterns:

Industrial demand relies on the industry cycle, jewelry demand is highly price-sensitive, and investment demand is highly susceptible to macro sentiment.

This structural split has long left silver without a stable, single, dominant pricing anchor.

The result is reflected in the price: silver has long been forced to price itself relative to gold.

A clear indicator is the gold-silver ratio. Over the past half-century, the historical average of this ratio has been roughly 55–60; but between 2018–2020, it once exceeded 90, and at the peak of the pandemic shock, it even approached 120.

Even against the backdrop of silver's industrial demand hitting a record high in 2024, the gold-silver ratio has long remained in the 80–90 range, significantly higher than the long-term average.

This is not because silver is "useless," but because the market is still pricing silver using gold's financial logic.

2. Silver's Repositioning: From "Dispersed Use" to "Locked In by Industry"

The real change did not start in the financial markets but occurred quietly on the industrial side.

To summarize the current change in one sentence: Silver is shifting from an industrial metal with dispersed uses to a functional material locked in by key industries.

1. Photovoltaics: Silver Becomes "Indispensable" for the First Time

Photovoltaics are the most critical factor in the change of silver's demand structure.

In 2015, global new PV installations were about 50GW; by 2024, this number exceeded 400GW, an increase of over 8 times in less than a decade.

The industry is indeed continuously "de-silvering." Silver usage per watt has dropped from about 0.3 grams in the early days to around 0.1 grams with current mainstream technology.

But the expansion speed of installation scale is far faster than the decline in unit usage.

According to the "World Silver Survey 2025," the actual demand for silver from the PV industry in 2024 reached 198 million ounces, an increase of over 160% compared to 2019, accounting for about 17% of global silver demand.

More critically, silver's position in photovoltaics is not "easily replaceable." In terms of key indicators such as conductive efficiency, long-term stability, and reliability, silver remains the optimal choice overall. Technological progress changes the method of use, not the status.

This gives silver, for the first time, a source of demand that is large-scale, fast-growing, and price-inelastic.

2. Electric Vehicles and AI Infrastructure: Usage Not Exaggerated, but Extremely Difficult to Substitute

If photovoltaics bring certainty in demand scale, then electric vehicles and digital infrastructure bring a change in the nature of demand.

A traditional internal combustion engine vehicle uses about 15–20 grams of silver on average; a new energy vehicle typically uses 30–40 grams.

Against the backdrop of limited overall growth in global auto sales, the penetration rate of new energy vehicles has risen from less than 3% in 2019 to nearly 20% in 2024, structurally increasing silver demand.

Meanwhile, the demand for silver from data centers, AI servers, and high-end electronic devices is reflected more in its irreplaceability than in absolute volume.

In 2024, silver demand from electrical and electronic related fields reached 461 million ounces, setting new historical records for many consecutive years.

These application scenarios are relatively price-insensitive but are extremely sensitive to supply stability.
3. The Reality on the Supply Side: Silver Is Not a Metal That "Can Increase Production Just Because Prices Rise"

In stark contrast to the certainty on the demand side is the rigidity on the supply side.

In 2024, global silver mine production was approximately 820 million ounces, with a year-on-year growth rate of less than 1%.

More importantly, over 70% of global silver production comes as a by-product, mainly依附于 (attached to) lead, zinc, copper, and gold mines. This structure has hardly changed substantially over the past two decades.

Primary silver mine production is only about 228 million ounces, accounting for less than 30%, and is still in a long-term downward trend.

This means that silver production is not determined by the silver price but is主导 (led) by the investment cycles of base metals.

4. From Cyclical Shortage to Structural Tightness

Looking back at history, silver has experienced bull markets before, but past rallies were mostly derivatives of financial cycles.

The difference is that since 2021, the silver market has experienced a physical supply-demand deficit for several consecutive years.

According to the "World Silver Survey 2025," the average annual physical deficit in the global silver market from 2021–2024 was about 150–200 million ounces, with a cumulative deficit接近 (approaching) 800 million ounces.

And silver's visible inventories themselves are not ample. Current global流通 (circulating) inventories can only cover about 1–1.5 months of consumption, significantly below the 3-month safety line typically considered for commodities.

Once a large amount of silver enters PV modules, electrical equipment, and infrastructure, it is difficult to return to the流通市场 (circulating market).

5. Silver Is No Longer Just Gold's Shadow

Silver has not suddenly become scarce; it is just the first time it simultaneously satisfies three conditions:

Demand scale is real and sustained

Key uses are difficult to替代 (substitute)

Supply growth is highly constrained

In the past, these three points never appeared simultaneously.

While the market still understands silver as "poor man's gold," the industrial chain has already begun to re-examine it by the standards of a key functional material.

Silver may still be volatile, but it is certain that it is no longer just gold's shadow.

And this is the most important, yet most easily underestimated, underlying change in this round of market activity.


Preguntas relacionadas

QWhy has silver historically been called 'poor man's gold' and what has changed recently?

ASilver was called 'poor man's gold' because it was seen as a cheaper, more accessible alternative to gold, and the market never took its scarcity seriously, assuming supply could always meet demand. This has changed because the market is now experiencing a sustained physical deficit driven by industrial demand from sectors like photovoltaics, electrification, and high-end electronics, while supply remains constrained and unable to keep pace.

QWhat is the main reason silver supply cannot quickly respond to price increases?

AOver 70% of global silver production comes as a by-product of mining other metals like copper, lead, and zinc. This means silver output is determined by the investment cycles of these base metals, not by the price of silver itself, making supply highly inelastic to silver price signals.

QWhich industry is the most significant driver of the new structural growth in silver demand, and why is it so important?

AThe photovoltaic (solar) industry is the most significant driver. It is important because, despite efforts to reduce silver use per watt (de-silverization), the massive expansion in global solar installations (from ~50GW in 2015 to over 400GW in 2024) has caused demand to surge. Silver's role is also crucial as it remains the optimal material for conductivity and reliability in solar cells, making it difficult to replace.

QHow does the 'identity dilemma' of silver affect its pricing in the commodity market?

ASilver's 'identity dilemma' refers to its split between being a credit asset (like gold, with financial and store-of-value properties) and a growth asset (like copper, driven by industrial cycles). This split means it lacks a single, stable pricing anchor. Consequently, its price has historically been heavily influenced by and correlated with gold (as seen in the gold-silver ratio), rather than being driven solely by its own industrial fundamentals.

QWhat evidence suggests the current silver market deficit is structural rather than just a cyclical shortage?

AThe evidence includes: 1) The deficit has been persistent, lasting for multiple consecutive years (2021-2024) with an average annual shortfall of 150-200 million ounces. 2) The deficit is driven by fundamental, long-term industrial demand growth (e.g., photovoltaics, EVs) rather than short-term financial speculation. 3) Supply is structurally rigid and cannot be quickly increased due to its by-product nature. 4) Once used in industrial applications like solar panels, silver is effectively 'consumed' and removed from the market, reducing available above-ground stocks.

Lecturas Relacionadas

As Consensus Accelerates, What Are Young Investors Betting On?

Title: As Consensus Forms Faster, What Are Young Investors Betting On? In the rapid evolution of tech investment, a new generation of young investors is navigating a landscape where AI, robotics, commercial aerospace, and quantum computing are advancing simultaneously. Traditional investment logic based on financial models is giving way to a need for deep technical understanding and the ability to act before industry consensus forms. An analysis of trends from the "WAIC FUTURE TECH" list of young investment leaders reveals key shifts in focus. The first major trend is the movement of AI from the digital screen into the physical world. Investment is shifting from large language models and chatbots towards embodied AI, robotics, AI hardware, and edge computing. While demonstrations generate excitement, the real challenge lies in achieving scalable, reliable, and cost-effective delivery in complex real-world environments like factories and logistics. Success depends not just on algorithms but on the integration of sensors, actuators, and control systems. Second, the competitive focus for large models is moving beyond raw capability toward building an "intelligence flywheel." The goal is to create self-reinforcing systems where user interaction generates data, improving the model, which in turn enhances the user experience and attracts more engagement. Companies that successfully embed AI into workflows to create these closed-loop systems can build lasting value that isn't easily erased by the next model upgrade. Third, facing a potential bottleneck in high-quality human-generated data, investors are looking at new underlying technologies. Reinforcement learning and self-play, as demonstrated by AlphaGo Zero, offer paths for AI to generate its own experience. Scientific foundation models, which aim to build general AI capabilities for fields like life sciences and materials discovery, represent a non-consensus direction that could unlock new frontiers of knowledge and data. Finally, in deep-tech areas like quantum computing, commercial aerospace, and space-based infrastructure, patient capital is essential. These fields have long, uncertain development and validation cycles involving complex engineering, supply chains, and regulations. Investment here requires a long-term view, focusing on foundational team capabilities and the eventual emergence of market demand, even if commercial returns are distant. Collectively, these trends illustrate how young investors are adapting to a new era. They are learning to make earlier, technically-informed judgments, balance hype with real-world viability, and provide the patient capital needed to build the deep-tech foundations of the future.

marsbitHace 28 min(s)

As Consensus Accelerates, What Are Young Investors Betting On?

marsbitHace 28 min(s)

Can Japan Buy Growth with AI? Will the Bond Market Believe It?

Japan's cabinet has introduced the 2026 Basic Policy on Economic and Fiscal Management and Reform, shifting its primary fiscal target. The new framework moves away from the traditional annual primary balance goal and instead prioritizes a stable reduction of the debt-to-GDP ratio. This change is tied to a strategy of increased "responsible proactive fiscal" spending, aiming to boost long-term growth through investments in strategic sectors like AI, semiconductors, energy, and robotics. The government estimates total public and private investment in 62 key technologies could exceed 370 trillion yen by 2040. The market reaction has been mixed and cautious. While equity markets may respond to policy signals, bond markets are focused on fiscal credibility. Concerns center on whether the weakening of the clear primary balance anchor could lead to looser fiscal discipline. If investors doubt that these strategic investments will generate sufficient productivity gains, tax revenue, and nominal growth to outpace rising interest costs, they may demand higher yields on Japanese Government Bonds (JGBs). Recent volatility in the yen and JGB yields, with the 10-year yield briefly reaching 2.9%, reflects this skepticism. The success of this new framework hinges on two factors: whether Japan can achieve a nominal growth rate consistently higher than its long-term interest rates, and whether future budgets demonstrate disciplined control over bond issuance. The government's narrative is that strategic investment is essential to break Japan's cycle of low growth, aging, and labor shortages. However, the bond market will continuously assess the credibility of this plan, pricing the risk that it may represent fiscal expansion rather than a viable growth strategy.

marsbitHace 1 hora(s)

Can Japan Buy Growth with AI? Will the Bond Market Believe It?

marsbitHace 1 hora(s)

Misjudged A-Shares: Resilience, Expectations, and Confidence

China's A-share market recently faced selling pressure, especially in tech sectors, initially triggered by a global tech sell-off that began in South Korea. However, the article argues this is a case of "mistaken injury" and highlights the market's underlying resilience. This resilience stems from three main pillars: **1) Tech Sector Fundamentals:** Unlike Korea's market dominated by a few memory chip stocks, China's tech sector is diversified across computing, communications, electronics, and semiconductors, supported by dual narratives of global AI supply chains and domestic substitution. Core areas like optical modules and fiber optics continue to show strong earnings growth. **2) "National Team" Support:** State-backed institutions and large corporations have made significant market purchases and announced buybacks, providing liquidity and signaling confidence. This is seen as a stabilizing policy signal, often associated with market bottoms. **3) Broader Market Pillars:** Other major sectors are showing endogenous recovery momentum. Consumer stocks benefit from stabilizing CPI and signs of sector recovery (e.g., liquor price hikes). Cyclical sectors like aluminum have high earnings, potential price increases due to tight supply, and low valuations. The financial sector offers stable dividends and low valuations. The conclusion is that the sell-off was driven by external contagion, not a collapse in fundamentals. With strong policy support and recovering momentum across key sectors, the A-share market possesses the toughness to regain stability.

marsbitHace 1 hora(s)

Misjudged A-Shares: Resilience, Expectations, and Confidence

marsbitHace 1 hora(s)

Trading

Spot
活动图片




