Peace Talks Hit an Impasse Again, U.S. Stocks Retreat from Highs, Can Bitcoin Hold the $80,000 Level?

marsbitPublicado a 2026-05-09Actualizado a 2026-05-09

Resumen

Peace Talks Stalemate Sinks Stocks, Tests Bitcoin's $80K Support Optimism over a potential U.S.-Iran peace deal, which briefly propelled the S&P 500 and Nasdaq to record highs, evaporated within 24 hours. Iran dismissed key U.S. proposals regarding uranium enrichment and Strait of Hormuz access, reversing market sentiment. U.S. stocks fell, led by semiconductors and small caps, while oil prices whipsawed violently. The core narrative is a binary market bet on war or peace, creating extreme volatility. The probability of a deal by mid-May dropped to 20%. Oil (Brent) briefly crashed 12% before recovering to around $100, but a shift in its market structure hinted at ample physical supply despite geopolitical risk. Bitcoin fell roughly 1.56%, finding support near $80,000. The pullback was considered structurally healthy, backed by strong institutional inflows into U.S. ETFs and rising long-term holder conviction. Ethereum gained on positive U.S. crypto regulation hopes. In equities, major indices declined with the Russell 2000 hit hardest. The "Magnificent Seven" tech stocks were a rare bright spot, but the semiconductor sector sold off sharply. Notably, high-beta momentum stocks suffered dramatically worse losses than the broader market. Upcoming U.S. non-farm payrolls data is the next key catalyst. Treasury yields rose with oil, the dollar was steady, and gold/silver gained on a mix of inflation and safe-haven demand. European markets also fell. The situation in the Strait...

The prospects for U.S.-Iran peace talks have once again fallen into uncertainty.

Following an exclusive report by Axios the previous day suggesting "both sides were close to reaching an agreement," the market was briefly immersed in optimism, with the S&P 500 hitting a record high and the Nasdaq setting a new record in sync. On Wednesday, the S&P 500 surged 1.46% to 7,365.12, and the Nasdaq skyrocketed 2.02% to 25,838.94, both touching all-time closing highs.

This positive sentiment failed to last 24 hours.

An Iranian Foreign Ministry spokesperson stated on Wednesday that Washington's proposed peace plan "is still under review," with two core demands—suspending uranium enrichment and reopening the Strait of Hormuz—remaining unresolved. Iran's red line on uranium reserves remained firm. The bullish confidence accumulated the previous day was rapidly drained by this news. Risk sentiment subsequently reversed. All three major U.S. stock indices closed lower, with the semiconductor sector leading the decline and small-cap stocks under particular pressure.

Core Narrative: Peace Agreement Still a Long Way Off

The market's interpretation of this war has become highly binary: either a deal is reached, or the fighting continues.

This week's diplomatic rhythm created significant volatility beats. On Monday, Trump announced a pause to the "Project Freedom" maritime escort mission, and Pakistani intermediaries released positive signals. On Tuesday, Saudi media even predicted a breakthrough on passage rights through the Strait of Hormuz "within hours," sending oil prices plummeting, with WTI crude briefly falling over 5% intraday and Brent dipping below $97.

However, Iran quickly tempered expectations. The Iranian Foreign Ministry explicitly stated that uranium enrichment is a red line, not a bargaining chip. Concurrently, the Islamic Revolutionary Guard Corps announced it would establish a new "control system" for the Strait of Hormuz, hinting that even if passage is opened in the future, it would be a selective opening under Iran's leadership, not an unconditional restoration.

Simultaneously, the U.S. Treasury Department announced additional sanctions on Iranian-related oil networks that same day, and U.S. forces reportedly used force against an Iranian oil tanker violating the blockade within the strait. This parallel pursuit of economic pressure and military deterrence shows the U.S. government has not loosened its grip.

Polymarket data shows the probability of a peace deal being reached before May 15 has fallen to 15%, and was around 20% at the time of writing.
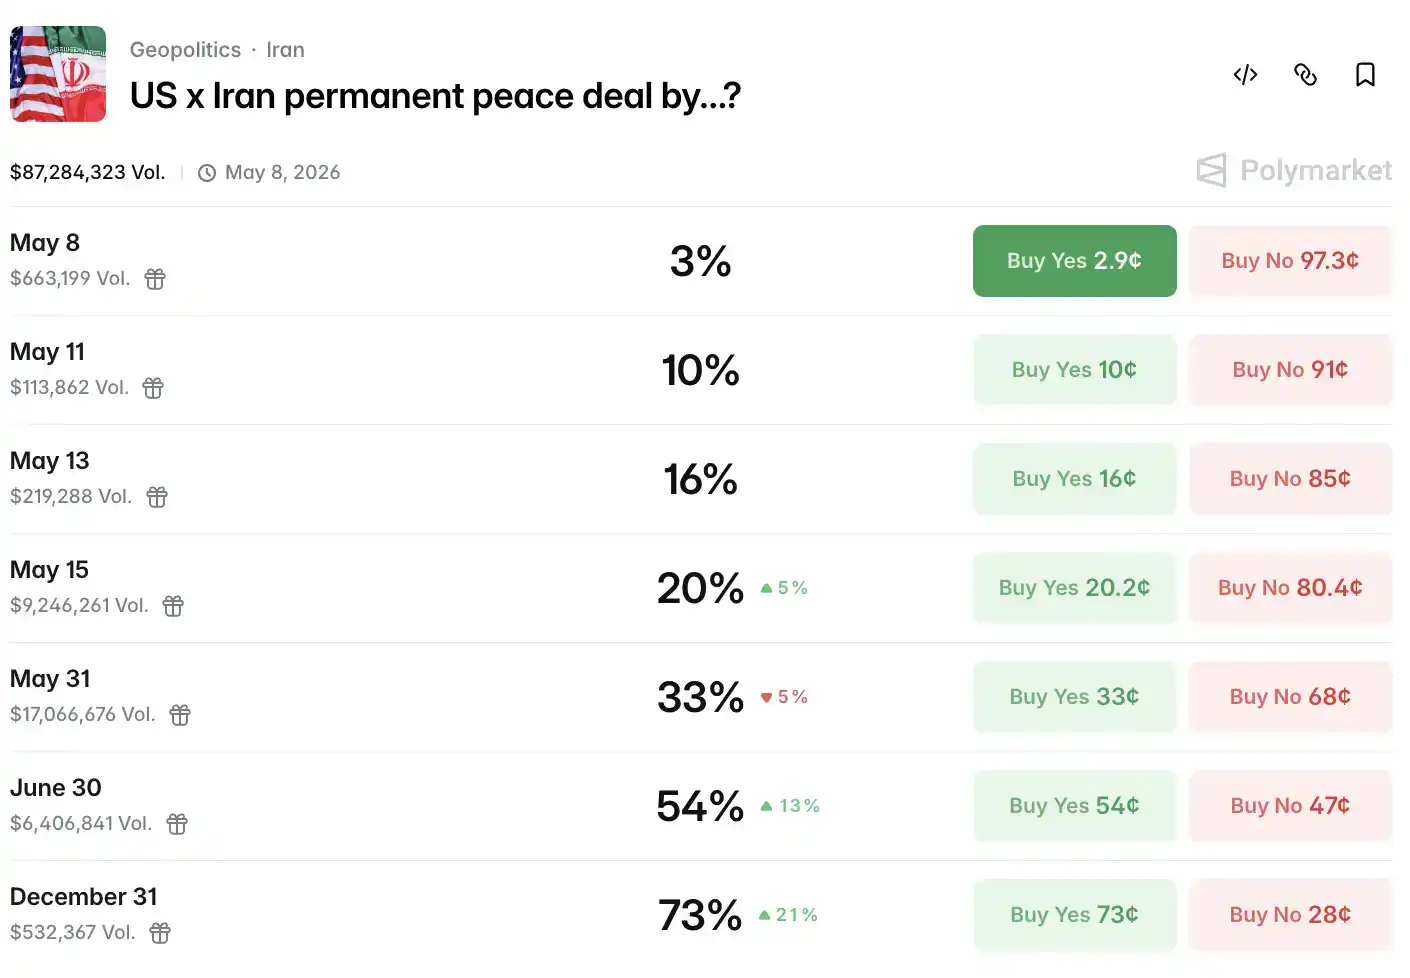
Consequently, oil prices traced a dramatic V-shape.

Intraday, Brent futures once fell to $96.73, a drop of over 12%. As the peace talk news gradually soured, bulls re-entered the market. Brent closed near $100, and WTI closed around $90.5, both barely holding key round-number levels.

Notably, Dated Brent (spot) has fallen below the Brent front-month futures contract, a reversal signal of the backwardation structure, hinting that physical crude oil supply is relatively ample at present, forming a structural divergence from the geopolitical risk priced into the futures market.

Outside the Strait, U.S. crude oil exports hit a record high last week, with global buyers accelerating their shift to U.S. supply sources to avoid Middle East transportation risks.

BNP Paribas' head of energy strategy, Aldo Spanjer, has simply abandoned trading the energy market: "The outcome is too binary, headlines are enough to trigger stop-losses, this has happened five times this week already, it's almost untradeable." TP ICAP energy analyst Scott Shelton called the current situation a "risk desert," with only hedging positions left in the market.

Can Bitcoin Hold the $80,000 Level?

Now, turning to the asset of most interest to crypto enthusiasts: Bitcoin.

Bitcoin continued to face pressure in this context, with spot Bitcoin falling about 1.56% on the day, finding support near the $80,000 level.

Unlike previous rounds of panic selling, this pullback structure is relatively healthy. On-chain data shows the proportion of long-term holder supply has risen to 78.3% of the circulating supply, exchange balances have fallen consecutively to a 7-year low, and whale addresses have net purchased about 270,000 BTC over the past 30 days. BlackRock's Bitcoin ETF holdings have grown to about $62 billion, indicating a stabilizing institutional holding structure.

Regarding Ethereum, sentiment this week overall benefited from rising expectations for U.S. crypto regulatory legislation to be enacted. ETH rose approximately 5.6% over five days, oscillating in the $2,360–$2,412 range, with its market cap maintaining around $2.33 trillion.

It's worth noting that April of this year was the strongest month for net inflows into U.S. spot Bitcoin ETFs since October 2025, with net inflows reaching $2.44 billion. The institutional pipeline continues to open, forming an internal echo with Bitcoin's relatively resilient performance amidst current macro turbulence.

From a narrative logic perspective, the impact of the Middle East situation on the crypto market is showing structural differentiation. Surging oil prices and rising inflation expectations lead to increased probability of Fed rate hikes, thus pressuring Bitcoin; but simultaneously, capital from some Middle Eastern regions is accelerating the transfer of assets into decentralized channels to evade potential sanction risks and liquidity constraints within the banking system. On the same day the U.S. Treasury added sanctions on Iranian-related oil networks, on-chain data showed slight abnormal movements in anonymous mixing transaction volumes. This is not a conclusion, but a signal worth continuous observation.

On the crypto legislation front, market expectations for the enactment of a U.S. regulatory framework are also supporting sentiment. Stablecoin and digital asset market structure bills are advancing in the U.S. Senate and House of Representatives. If passed within the year, they would provide compliance support for institutions to further expand allocations.

U.S. Stocks Fluctuate Near Highs, Semiconductors Catch Down

Thursday was the second directionless trading session of the week.

The S&P 500 closed down 0.38% at 7,337.11 points; the Dow fell 313.62 points (-0.63%) to 49,596.97 points; the Nasdaq's decline was relatively restrained, closing down just 0.13% at 25,806.20 points. The Russell 2000 small-cap index fell 1.63%, the largest decline among major indices for the day.

All sectors closed lower, with the energy sector suffering the heaviest losses and consumer staples showing relative resilience.

Divergence was evident within the tech sector. Tesla rose 3.28%, Nvidia rose 1.76%, Microsoft rose 1.68%, Meta rose 0.64%; Apple fell 0.03%, Alphabet fell 0.01%, Amazon fell 1.39%. The "Magnificent Seven" combined index rose a slight 0.69% overall, one of the few bright spots of the day.

Semiconductors were the hardest hit. The Philadelphia Semiconductor Index (SOX) closed down 2.72%, with AMD down 3.07% and TSMC's ADR down 1.28%. Stronger-than-expected earnings from Qualcomm and Fortinet, and Datadog's analyst day providing some support to the software sector—potentially marking a fourth consecutive weekly gain for the software index—could not conceal the systemic selling pressure in the chip sector.

Data from Goldman Sachs' trading desk provides a more telling dimension: their high-beta momentum basket fell a sharp 8% on the day, while the S&P 500 and Nasdaq 100 fell less than 0.5%. This spread is among the top ten extreme single-day values of the past five years, and this marks the fifth such occurrence so far in 2026.

Furthermore, the VIX fell 1.78% to 17.08, showing a rare divergence from the stock market decline. Typically, when stocks fall, the fear index rises; their concurrent downward movement suggests the market may already be waiting for tomorrow's (Friday) Non-Farm Payrolls data, unwilling to place directional bets in the short term.

Recent U.S. stock earnings reports are also highly representative. Arm Holdings reported its FY2026 Q4 earnings after the close on May 6th, with adjusted EPS of 60 cents and revenue of $1.49 billion, both slightly surpassing analyst expectations. Licensing revenue grew 29% year-over-year, royalty revenue grew 11%.

The report itself wasn't bad. But on the earnings call, management mentioned that the company's latest AGI CPU data center chips face supply bottlenecks, with an additional $1 billion in demand temporarily unable to convert into revenue. Raymond James analyst Simon Leopold wrote directly: "Supply constraints led management to temper revenue guidance increases."

The stock surged as much as 13% after hours, only to give back all gains and then some, falling over 10% after Thursday's open, becoming one of the heaviest decliners among tech giants for the day. This is the third time in the past year Arm has seen "better-than-expected earnings" followed by a "next-day plunge."

After Arm's performance, CoreWeave took the stage after hours. Its Q1 actual revenue beat expectations, its revenue backlog has ballooned to $99 billion, and Nvidia injected another $2 billion during the quarter. However, its Q2 revenue guidance fell short of market expectations, while its full-year 2026 capital expenditure guidance was raised to $31-35 billion, more than doubling the $14.9 billion in 2025. Its stock fell over 10% after hours.

CoreWeave's losses are real, its debt is real, but its orders are also real: a $99 billion revenue backlog, and Nvidia's continuous backing. But clearly, everyone is doubting whether this future money can outrun today's capital expenditures.

Fed Leans Hawkish, Friday's Non-Farm Payrolls Data

Finally, on the Federal Reserve front, slight hawkish shifts appeared in the short-term interest rate market that day, with the probability of an unexpected rate hike before year-end rising to about 20%. But the market largely viewed this as noise, as labor data remains strong. Weekly initial jobless claims only edged up to 200,000, showing no substantial cracks yet in the job market.

The 10-year U.S. Treasury yield rose about 4.8 basis points to 4.393%, moving higher in sync with the rebound in oil prices.

Offshore Chinese yuan briefly broke through 6.80 per dollar, hitting a four-year high, before retreating slightly, closing the New York session at 6.8078. The U.S. Dollar Index rose 0.08% to 98.10.

Regarding gold, spot gold touched above $4,700 per ounce intraday, a two-week high, closing up 0.22% at $4,701.61. The tug-of-war between inflation worries fueled by oil prices and safe-haven demand amid peace talk expectations found gold its place. Silver saw larger gains, with COMEX silver futures closing up 3.02% at $79.64 per ounce, and spot silver briefly breaking above $82 intraday.

In European markets, the pan-European STOXX 600 fell 1.02%, the UK's FTSE 100 fell 1.55%, France's CAC 40 fell 1.17%, and Germany's DAX fell 0.99%.

The variable of the Strait of Hormuz is not yet cleared. And the next market trigger is Friday's Non-Farm Payrolls data. This week's initial jobless claims slightly rose to 200,000 but remained below the market expectation of 206,000, indicating continued mild layoff pressure in the labor market. With the probability of a Fed rate hike this year rising to about 20%, this also means the jobs data will become the next coordinate for repricing.


Preguntas relacionadas

QWhat was the primary reason for the sudden reversal in market sentiment regarding the US-Iran peace talks?

AThe reversal was primarily triggered by statements from an Iranian Foreign Ministry spokesperson on Wednesday. The spokesperson indicated that the US-proposed peace plan was still 'under review' and that key demands—pausing uranium enrichment and reopening the Strait of Hormuz—remained unresolved. Crucially, Iran emphasized that its uranium enrichment was a 'red line' and not a negotiation chip.

QAccording to the article, what are two key factors that provide underlying support for Bitcoin's price near the $80,000 level?

ATwo key factors providing support are strong institutional demand and positive on-chain fundamentals. 1) Institutional demand: April saw the strongest net inflows ($24.4 billion) into US spot Bitcoin ETFs since October 2025, with BlackRock's ETF holdings reaching ~$62 billion. 2) On-chain fundamentals: The proportion of BTC held by long-term holders rose to 78.3% of the circulating supply, exchange balances hit a 7-year low, and whale addresses were net buyers of ~270,000 BTC over the past 30 days.

QDescribe the unusual divergence observed in the VIX (Volatility Index) on the day of the market decline.

AOn the day of the market decline, the VIX (often called the 'fear gauge') fell 1.78% to 17.08, moving in the same downward direction as the falling stock indices (S&P 500, Nasdaq). This is considered unusual because typically, when stocks fall, the VIX rises as market fear and expected volatility increase. The article suggests this divergence might indicate the market is in a holding pattern, waiting for the upcoming non-farm payrolls data before making a directional bet.

QWhy did Arm Holdings' stock price fall significantly despite reporting quarterly earnings that beat analyst expectations?

AArm Holdings' stock fell because, during its earnings call, management disclosed that its latest AGI CPU data center chip was facing supply constraints. This bottleneck meant that an additional $10 billion in demand could not be converted into immediate revenue. Analysts noted that these supply constraints caused management to refrain from raising revenue guidance, which outweighed the positive impact of the earnings beat.

QWhat contradictory signals does the article highlight in the crude oil market regarding the current physical supply versus futures market pricing?

AThe article highlights a structural divergence: the spot price of Brent crude oil has fallen below its front-month futures price. This reversal from the typical 'backwardation' structure (where spot prices are higher than futures) suggests that physical oil supply in the market is currently relatively abundant. This stands in contrast to the elevated prices seen in the futures market, which are still pricing in significant geopolitical risk premiums related to the Middle East tensions.

Lecturas Relacionadas

After Three Consecutive Quarters of Decline, Can the Crypto Market Find a Window for Stabilization in Q3?

The cryptocurrency market has just concluded its worst-performing quarter since 2022, with total capitalization dropping 12.6% to $2.1 trillion. All core metrics indicate capital is leaving the sector, not just rotating within it. Bitcoin fell 14.2% and Ethereum dropped 25.4% in Q2, breaking their previous correlation with US tech stocks. A key driver is the reversal in US spot Bitcoin ETF flows, which saw a net outflow of approximately $4.67 billion in Q2, including a record monthly outflow near $4.5 billion in June. While recent data suggests long-term holders are accumulating again, sustained ETF outflows mean continued selling pressure. Market focus is now singularly on the Federal Reserve. The upcoming July FOMC meeting is seen as the most critical event for Q3. A dovish signal could support Bitcoin reclaiming a $68,000-$84,000 range, while a hawkish stance might establish a new trading band around $50,000-$56,000. Additionally, regulatory uncertainty persists, with the progress of the crucial *CLARITY Act* stalling in the Senate, reducing its perceived 2026 passage probability to 40-45%. Despite the broad downturn, a few sectors showed growth. Prediction markets saw nominal volume surge 48.7% year-over-year to $113.8 billion, and tokenized collectibles transaction volume rose 143% quarterly to $1.4 billion. The Real-World Asset (RWA) tokenization sector also continued steady growth, now representing ~$28.1 billion in on-chain value. The market's foundation for an extreme crash appears limited, with Bitcoin price hovering near its 200-week moving average. However, the trading paradigm has shifted from narrative-driven speculation to decisions based on price action, policy developments, and interest rate expectations, making a broad sentiment-driven rally unlikely in the near term.

marsbitHace 12 hora(s)

After Three Consecutive Quarters of Decline, Can the Crypto Market Find a Window for Stabilization in Q3?

marsbitHace 12 hora(s)

BIT Trading Moment: BTC Still Suppressed by Weekly 200 EMA, Rejection May Restart Decline; Storage and Semiconductors that Surged Last Night Begin Falling in Evening Trading

**Crypto & Stock Market Wrap: Bitcoin Tests Resistance, Stocks Retreat After AI Surge** Bitcoin consolidates around $66,000, facing key resistance near $68,000—an area seen as a major psychological and technical hurdle where previous rallies have failed. Analysts note the cryptocurrency is caught between its 200-week moving average (~$63,333) and 200-week EMA (~$68,328). A clear break above $68k is needed to signal a stronger bullish trend, while a rejection could lead to a retest of $63k support. Market sentiment remains cautious, with low futures open interest pointing to a low-liquidity rebound rather than a full bull market. Bitcoin spot ETFs saw another $203 million inflow. US stock futures pointed lower after a strong Tuesday session led by a massive rebound in semiconductors and memory stocks. The rally was fueled by renewed optimism about AI-driven hardware demand, with Micron, SanDisk, and SK Hynix surging. However, those gains reversed in pre-market trading. Super Micro Computer (SMCI) soared over 20% after hours on strong guidance and a record backlog. Other standouts included Rocket Lab and nuclear energy plays Oklo and X-Energy. Rising oil prices (Brent above $91) and climbing Treasury yields (10-year near 4.64%), however, are reigniting inflation concerns and acting as a headwind for equities. In Asia, markets were mixed. South Korea's KOSPI pared early gains to close slightly higher as semiconductor stocks like SK Hynix gave back initial surges. Japan's Nikkei edged lower as the yen hit a fresh 38-year low against the dollar, raising fears of potential market intervention. Key events to watch include the Samsung Galaxy launch, AMD's AI event, and a slew of major tech earnings from Alphabet, Tesla, and IBM after the close on Wednesday, followed by the ECB meeting and Intel's earnings on Thursday.

marsbitHace 13 hora(s)

BIT Trading Moment: BTC Still Suppressed by Weekly 200 EMA, Rejection May Restart Decline; Storage and Semiconductors that Surged Last Night Begin Falling in Evening Trading

marsbitHace 13 hora(s)

Former CFTC Chairman, Circle President Tarbert: Preaching Long-Termism While Cashing Out $30 Million Himself

Former CFTC Chairman and Circle President Heath Tarbert has consistently advocated for a long-term vision in public, urging patience from investors as Circle’s stock price has fallen significantly from its peak. However, it has been revealed that since Circle’s IPO, Tarbert has continuously sold his CRCL shares through pre-arranged trading plans, cashing out approximately $30 million, without making any public market purchases. This contrast between his public messaging and personal actions has drawn criticism. Tarbert joined Circle in July 2023 as Chief Legal Officer, leveraging his regulatory experience to help guide the company through its IPO and expansion. Despite promoting stablecoins as long-term infrastructure, he established a 10b5-1 trading plan just before Circle went public, leading to substantial stock sales over the following year. In March 2026, he initiated another plan to sell more shares. His career trajectory highlights a pattern of moving between high-level regulatory roles and influential positions in the financial sector. After resigning as CFTC Chairman in early 2021, he joined Citadel Securities as Chief Legal Officer just 27 days later, during a period of intense regulatory scrutiny for the firm. He later joined Circle, aiding its efforts to navigate regulatory challenges for its public listing. While Tarbert's expertise in policy and compliance is valuable to companies like Circle, his actions—advocating long-term confidence while personally divesting—raise questions about the alignment between his public statements and his private financial decisions, leaving investors who followed his advice to bear the market risks.

marsbitHace 13 hora(s)

Former CFTC Chairman, Circle President Tarbert: Preaching Long-Termism While Cashing Out $30 Million Himself

marsbitHace 13 hora(s)

Gate Research Institute: The 'Wall Street-ization' Wave of Crypto Financial Products – Competition or Integration?

The article titled "Gate Research Institute: Are Crypto Financial Products Sparking a 'Wall Street' Wave—Competition or Convergence?" explores the evolving relationship between the crypto ecosystem and traditional finance (TradFi). The piece begins by reflecting on Bitcoin's original 2009 vision of decentralization, disintermediation, and moving away from banks. It then contrasts this with the 2024 landscape, where key crypto assets like Bitcoin are increasingly held through Wall Street products like ETFs issued by giants like BlackRock. The article questions whether this signifies that TradFi is systematically taking over the rights to issue, price, custody, and distribute crypto financial assets. The core argument is that this is not a zero-sum takeover but rather a bidirectional convergence where each side addresses the other's weaknesses. Crypto offers 24/7 global markets, programmable settlement, and open access but lacks compliant channels, institutional-grade custody, deep fiat liquidity, and mainstream distribution. TradFi possesses these but is constrained by legacy systems, limited operating hours, and slow settlement. Two primary convergence paths are highlighted: * **Path A (CEX to TradFi):** Exemplified by Gate, which has progressed from offering tokenized stocks and CFDs to providing direct, real stock trading (US, Hong Kong, South Korea) within its platform, using USDT. * **Path B (TradFi to Crypto):** Exemplified by Robinhood, which has integrated crypto trading, acquired exchanges like Bitstamp, and is moving traditional assets like stocks onto the blockchain via tokenization and its own Layer 2. Both paths are ultimately competing to become the next-generation, unified financial account—a "super account" where users can seamlessly trade cryptocurrencies, stocks, ETFs, RWA (Real World Assets), and tokenized treasury products in one interface. The growth of RWA and tokenized treasuries (e.g., BlackRock's BUIDL) is presented as the asset-layer fusion, providing stable, yield-bearing assets on-chain and acting as a bridge between the two worlds. In conclusion, the "Wall Street-ization" of crypto is framed as a mutual transformation. Decentralized ideals persist in the protocol layer, while at the application layer, a more efficient, global, and accessible unified capital market is emerging from this convergence. The future competition lies not between crypto exchanges and stockbrokers, but between platforms vying to offer the most comprehensive asset coverage, liquidity, and user experience within a single account.

marsbitHace 13 hora(s)

Gate Research Institute: The 'Wall Street-ization' Wave of Crypto Financial Products – Competition or Integration?

marsbitHace 13 hora(s)

Trading

Spot
活动图片




