Written by: Daii
A stablecoin curator managing $2.2 billion. Its most conservative vault has provided depositors with an average 7-day APY of 3.96%; another vault under the same curator's name has a 7-day average of 5.09%, while the pool into which it has placed nearly $10 million yields around 7.7% on a 7-day average.
The few percentage points of difference aren't pocketed by anyone; they are the price you pay for "not having to make decisions yourself" and "not having to bear the collateral risk yourself"; the door to that pool is closed by default in the main interface.
This mismatch won't disappear because subsidies run out; it will gradually be arbitraged away as more and more people push that door open.
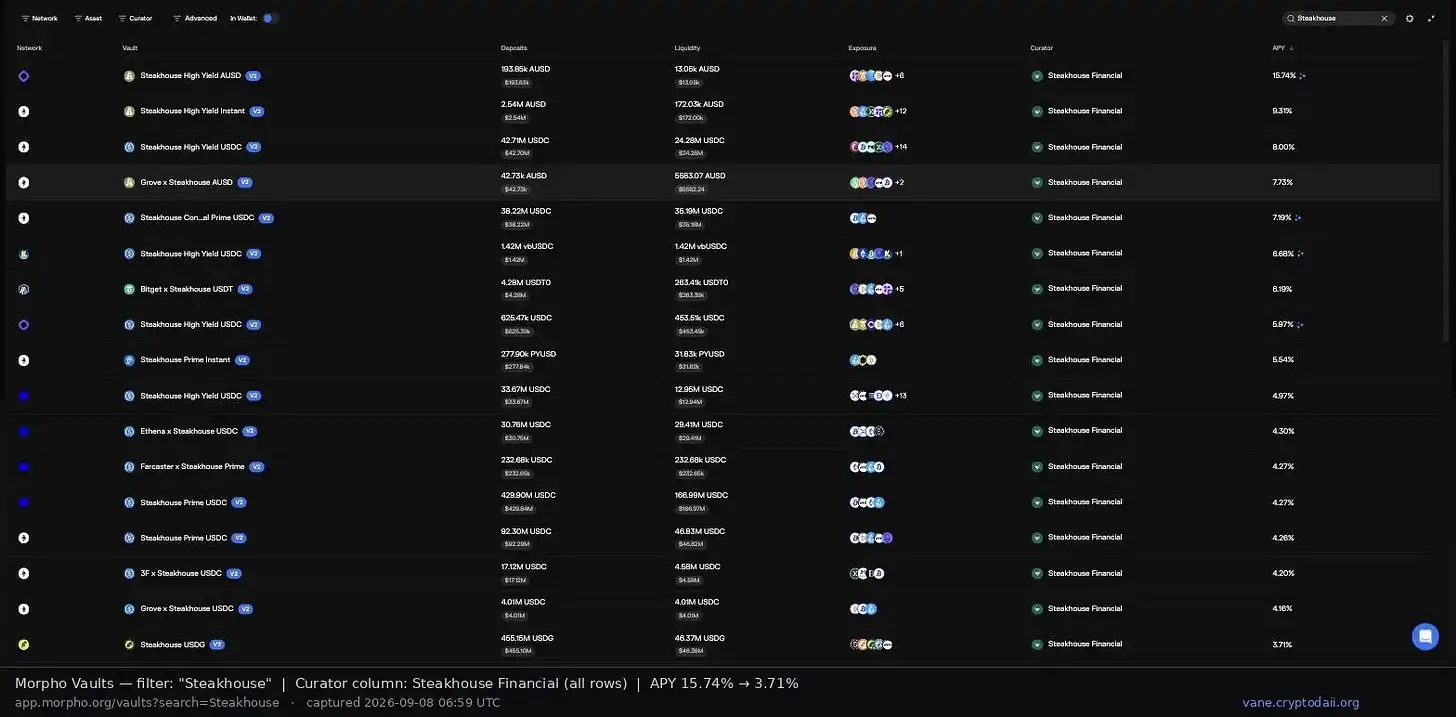
Figure 1: Morpho's official vault list, searching for Steakhouse. The entire Curator column is the same entity. The APY column ranges from 15.74% down to 3.71%.
1. Where Does This Extra Yield Actually Come From?
Let's be absolutely clear: There are no token emissions, no points, no airdrop expectations here. All the numbers above are real interest paid by borrowers—the cleanest type of yield in this system. Precisely because it's clean, it won't suddenly drop to zero like subsidies; but also because it's clean, it won't be given to you for free.
In these permissionless lending systems, depositors actually have three paths, not two.
The first is the default path: entrust your funds to a conservative vault managed by a professional team. The team selects pools for you, diversifies, monitors, and repositions during crises. What you receive is a blended average return, after deducting the team's performance fee and the drag from idle funds held for redemption readiness.
The second path, many don't know exists: The same team often also operates a vault with a higher risk tolerance. It's still monitored and diversified, but the list of eligible pools is broader. In Figure 1, that entire Curator column belongs to the same entity, yet yields range from 3.71% up to 15.74%—the difference isn't about who manages money better, but about what each vault is allowed to touch.
The third is depositing directly into a specific pool. No middleman, no performance fee, no cash drag; you get the full interest rate of that pool at that moment. The problem is, the default interface usually doesn't give you an entry point for this path—not due to technical limitations, but by deliberate design choice. This design objectively protects the vast majority, at the cost of also taking away the right to "choose your risk level."
Therefore, the essence of this yield spread is not that someone is hiding your money, but this: You are bearing the collateral risk that the professional team is unwilling to expose their conservative vault to, and the market pays you a premium for it. This sentence is the only thing you need to remember from this article.
2. The Surface Number Is Not What You'll Get
This is the easiest place to lose money on details, worth its own section. And this time, I don't even need to explain it—the official interface says it all.
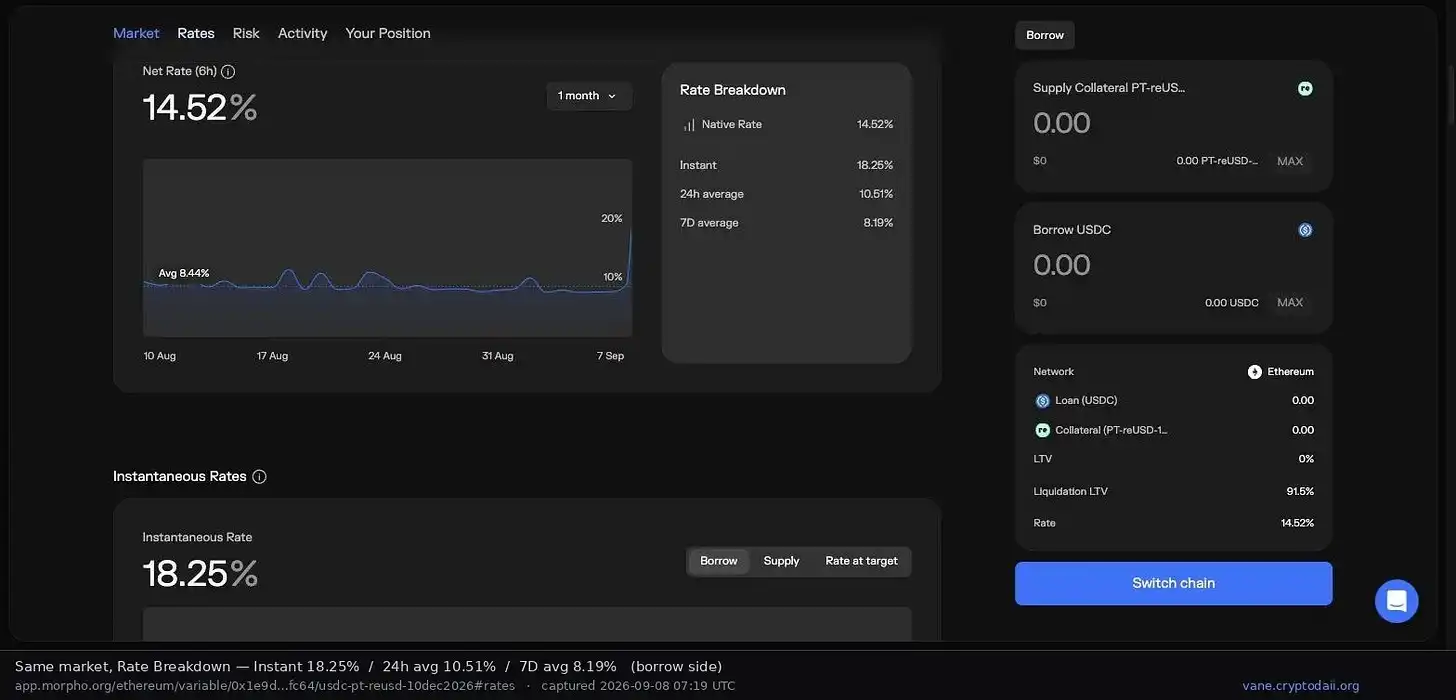
Figure 2: For the same pool, at the same moment, the official page displays three metrics side-by-side—Instantaneous 18.25%, 24h Average 10.51%, 7-Day Average 8.19%.
These three numbers are different representations of the same pool at the same second. If you see someone elsewhere touting 18.25%, they aren't fabricating data; they're just picking the metric most favorable to their story. From the title to net yield breakdowns, this article exclusively uses the 7-day average, because only this metric allows for post-fact verification.
Why is there more than a twofold difference? Rates in these pools are determined by utilization: the higher the proportion lent out, the higher the rate, and it rises steeply past a target line. Simultaneously, the moment your funds are deposited, the denominator increases, utilization is immediately depressed, and the rate drops accordingly. In other words, the enticing number you see on the list is from before you enter; the moment you enter, it's no longer that number. Larger positions depress it more.
The most typical pitfall I've seen looks like this: a pool shows an APY in the thousands, but upon inspection, the withdrawable liquidity is less than one dollar. The sign isn't lying; it's just that sign never belonged to those who enter later.
Therefore, what you must do before entering isn't to look at the sign, but to plug your intended capital size into the rate curve and calculate the realized rate. This was the original reason I built that tool; Section 6.2 will give the specific methodology.
3. When Will This Door Close?
Structural arbitrage doesn't have a hard expiry date, but it will be arbitraged away. Three paths, in my estimated order:
First, crowding. More people depositing directly into the pool dilutes utilization, naturally bringing the high-yield pool's rate closer to that of the vaults. This is the gentlest and most certain path.
Second, productization. The day the default interface opens a direct entry, or a better third-party interface appears, friction costs drop, and the spread will be rapidly eaten away.
Third, fee reduction. Custodians, to retain capital, proactively lower performance fees; the service fee segment will disappear first.
Thus, the window I suggest is to review weekly, not chase daily. The real risk isn't that it disappears tomorrow, but that you continue bearing the risk corresponding to the original risk premium after the spread has already been arbitraged away.
Three Risks You Must Accept First
First, you lose diversification and oversight. The diversification, daily monitoring, and emergency repositioning during crises performed by the professional team are gone once you take this path. You are taking a concentrated exposure to a single pool. This is the primary consideration for this premium.
Second, you might not be able to exit. For the pool in this example, the total size is about $83 million, but the immediately withdrawable liquidity is only $4.16 million, about 5% of total supply. If you want to exit and borrowers haven't repaid, and others are also rushing to exit, you'll have to queue. This isn't a bug; it's inherent to the nature of lending.
Third, the collateral itself might go bad. Structured assets with maturity dates, yield-bearing stablecoins, cross-chain wrapped assets each have their own depeg and maturity risks; oracles can also fail during extreme market conditions. Once bad debt occurs, losses are shared among all suppliers; you may never get your full principal back.
Only if you accept all three, read on. This article does not constitute investment advice, does not provide safety endorsements, and does not promise any returns.
4. Laying It Out: Which Protocol, and What Did I Do?
A necessary disclosure upfront: The tool Vane mentioned below is something I built and deployed myself (https://vane.cryptodaii.org/). I am its author, and it charges a small fee per transaction. This constitutes a conflict of interest. Therefore, in this section, I will try to explain things to the point where you can complete the process yourself even if you never touch this tool.
The protocol is Morpho. Its markets are permissionlessly created; anyone can create a pool, so pool quality varies greatly. Its official interface guides depositors to curator vaults; the path of directly supplying to individual markets has no entry point in the default interface, though it's fully open at the protocol level.
All data in this article is from the Morpho official interface on 2026-09-08. Each screenshot includes the original URL and capture time; you can click back to verify each one. If you are reading this days later, please treat these numbers as a demonstration of the method, not as current quotes.
Three tiers, using the 7-day average metric.
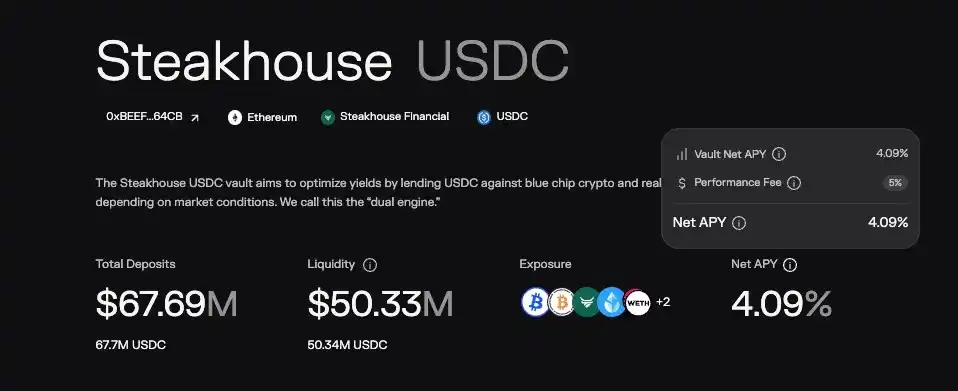
Figure 3: Steakhouse USDC, Curator Steakhouse Financial, total deposits $67.69 million, performance fee 5%. The 7-day average APY in the Returns column is 3.96% (large number in image is instantaneous).
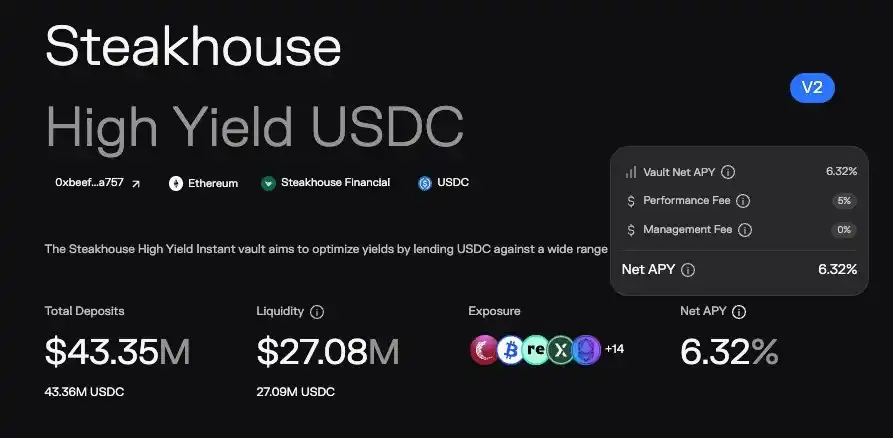
Figure 4: Steakhouse High Yield USDC (Ethereum, deposits $43.35 million) under the same curator, 7-day average APY 5.09% (large number in image is instantaneous).
The third tier is direct pool deposit. The target pool is USDC / PT-reUSD-10DEC2026 on Ethereum.
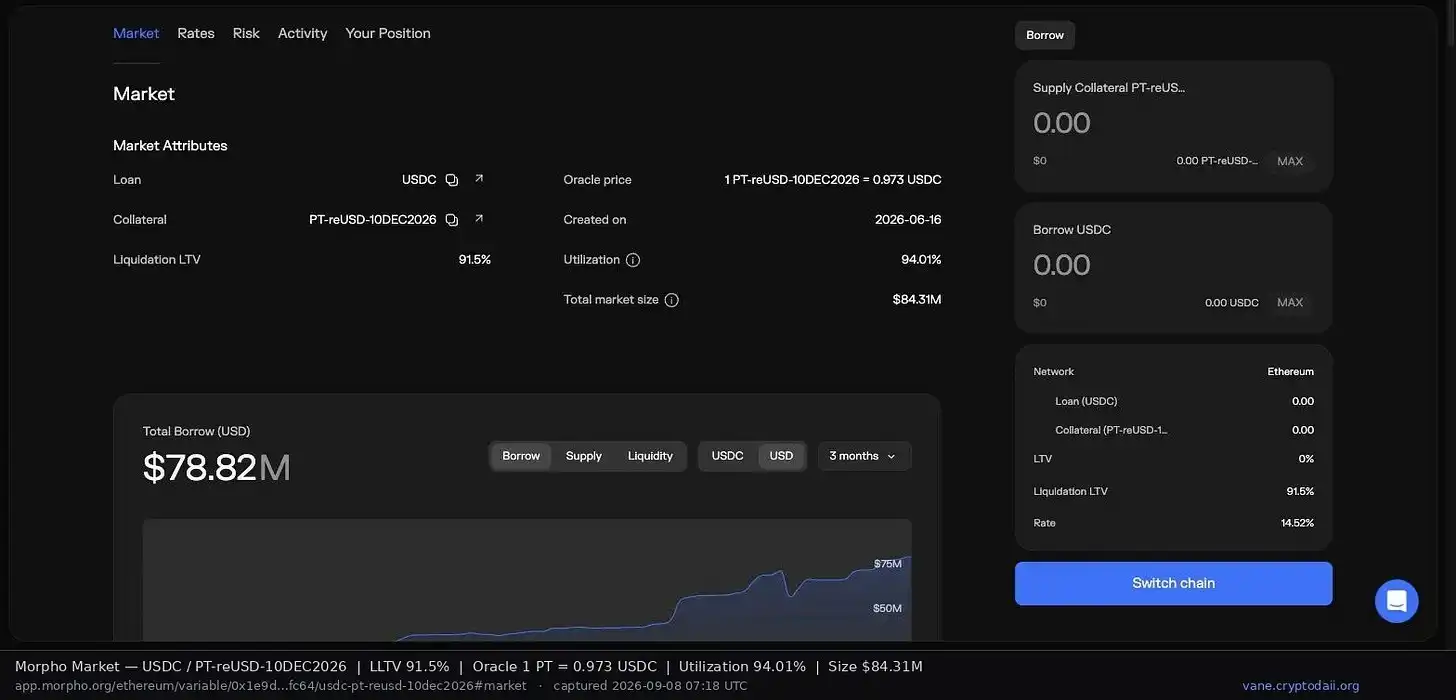
Figure 5: Liquidation threshold 91.5%, oracle quote 1 collateral token = 0.973 USDC, creation date 2026-06-16, utilization 94.01%, total size $84.31 million.
The supply-side 7-day average is not directly printed on the page, so I'll lay out the calculation: Borrower-side 7-day average is 8.19% (Figure 2), multiplied by utilization 94.01%. The market itself doesn't take a cut, yielding a supply-side 7-day average of approximately 7.7%. You can verify this yourself; no need to trust me.
Putting the three tiers together: conservative vault 3.96%, the same curator's aggressive vault 5.09%, direct deposit into that pool ~7.7%. Each step up is not free.
5. My Own Exclusion Method: First, See How Many Are Willing to Touch It
Not screening is a premise of this approach, but not screening doesn't mean entering blindly. I don't use a scoring system; I use exclusion—only to veto, not to endorse. The most useful signal is: How many verified curator vaults have actually allocated real capital to this pool?
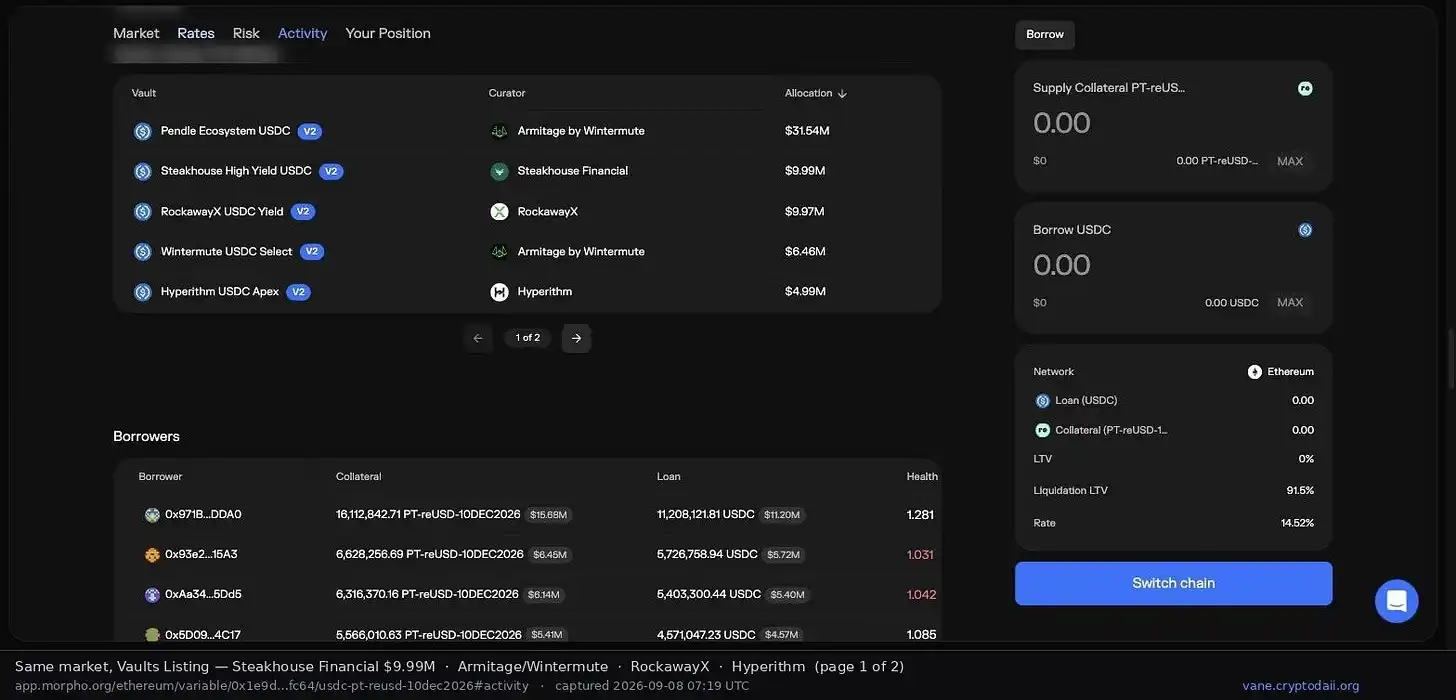
Figure 6: First page of the list of vaults supplying to this pool. Armitage by Wintermute two vaults total $38 million, Steakhouse Financial $9.99 million, RockawayX $9.97 million, Hyperithm $4.99 million.
This chart answers two things simultaneously. First, this pool has been independently evaluated and deemed worthy of capital allocation by at least six verified curators. Second—note the second row—the conservative vault offering you 3.96% and the vault that placed $9.99 million into this ~7.7% pool belong to the same curator. The title is not rhetorical.
Now contrast with the opposite. On the same market list, some other pools show four-digit APYs, the "Trusted By" column has only one icon, withdrawable liquidity is less than a dollar, and total borrows are only a few tens of dollars. Those extra percentage points often correspond to the absence of five professional teams willing to vouch for it. This is the most practical criterion I believe is worth taking away. Note it can only be used to veto: endorsement by six doesn't guarantee safety, it only indicates the pool has been evaluated by six teams independently. A pool with no endorsements but a high rate can basically be crossed off.
Another subtler but more informative signal: Look at the allocation cap the curator sets for this pool. The aggressive vault in Figure 4 has an absolute cap of $10 million for this pool; it's already allocated $9.99 million, maxed out. Simultaneously, this pool only constitutes 23% of its total portfolio. A professional team willing to allocate capital but explicitly unwilling to allocate more is more valuable to reference than a team going all-in—you want to copy their upper limit, not their lower limit.
Beyond this, I also hard-veto these types: single-source or upgradable oracles; collateral lacking sufficient on-chain depth to be liquidated; pool borrow amounts so small they indicate no real demand; and pools with excessively low withdrawable liquidity as a percentage of total supply. This last point itself is a drawback for the pool in this article—5% is not ample.
A technical detail for checking data: Morpho now has two vault generations; newer chains mostly have V2, with curators listed in a different field. Checking only the old field might show a misleading "No Curator"—my own tool missed a clearly endorsed pool this way a few days ago, now fixed. If you're writing your own script, check both generations.
6. Step-by-Step Operation
6.1 Select a Pool and Verify Parameters On-Chain
First, decide on the asset (suggest starting with a familiar mainstream stablecoin for your first time), then filter candidate pools using the exclusion method from the previous section. Once selected, before sending any transaction, you must read five parameters of this pool (loan asset, collateral asset, oracle, rate model, liquidation threshold) directly from the blockchain and cross-check them with what the interface displays.
New risk: Any interface data can be stale or mismatched. Skipping this step could lead you to deposit into a different pool than you think. My tool forces an on-chain parameter read and cross-check before every approval and deposit, refusing execution on mismatch; if you're doing it manually, you must do this step yourself.
6.2 Calculate the Realized Rate, Don't Just Look at the Sign
Plug in the amount you intend to deposit, calculate the pool's utilization and corresponding rate after your deposit, and compare that with the number you see now.
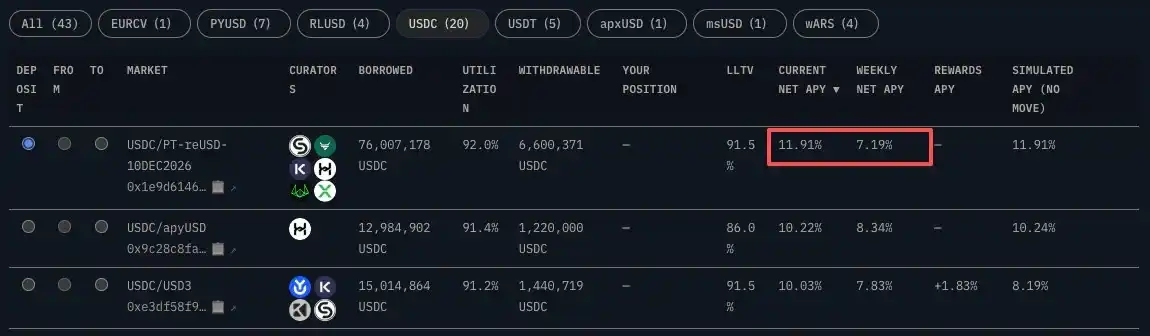
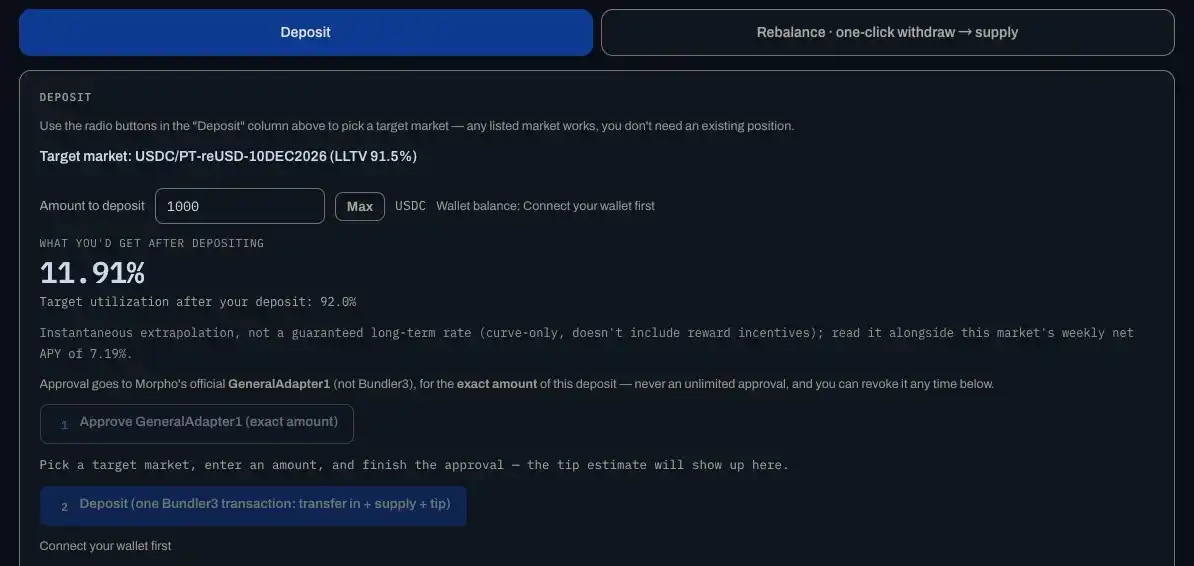
Figure 7: Vane calculates the realized APY before deposit, displaying it side-by-side with the sign's weekly average APY, and gives an explicit warning if the difference is extreme.
For my own judgment criteria: Using the 7-day average metric, if the realized rate improvement over your current vault is not more than two percentage points, I don't act. Below that, the transaction fees and extra risk undertaken aren't worth the move. In this article's example, 7.7% vs. 3.96% is a 3.7 percentage point improvement, barely qualifying; but as you'll see next section, qualifying doesn't automatically mean it's worthwhile.
New risk: This realized number is an instantaneous extrapolation based on the public rate curve; it does not simulate rate adaption over time, nor is it an official protocol number. It only addresses the "sign is deceiving you" problem; it does not guarantee your long-term yield.
6.3 Execute, and Write Down Your Exit Conditions Immediately
Depositing involves one approval transaction and one deposit transaction. Key point: The approval should be granted to the protocol's official adapter contract, not something else, and should be for the precise amount of this transaction—do not give infinite approvals. This way, even if the frontend is compromised, the single loss is capped at that amount.
If you later want to move between pools, note that swapping requires a one-time approval covering your entire position on that chain, with much broader permissions than a simple deposit. Be absolutely sure before signing. My tool hardcodes this approval object to the protocol's official adapter and lists all the official contract addresses for that chain on the page, along with a link to the official address list for character-by-character comparison—this is the strongest evidence of trust I can provide; you shouldn't trust me just because I say it's safe.
New risk: Approvals themselves are an attack vector. Infinite approvals, approvals to unknown contracts, and signing on the wrong chain are the three most common ways to lose money on this path.
7. Net Yield Breakdown: The Threshold Is Much Lower Than You Think
Using that pool, $10,000 principal as an example. First, lock in the holding period: Collateral maturity is December 10, 2026. According to the rules in the trigger points section, you must exit at least 2 weeks early, so the usable window is about 2.5 months; I'll calculate based on 2 months, leaving a buffer. This order cannot be reversed—first, determine how long you can hold based on the trigger point, then calculate if it's worthwhile, not the other way around.
Nominal side, using the 7-day average metric: Direct pool deposit ~7.7% APY, for 2 months ~$128.3; leaving the same $10,000 in the conservative vault at 3.96% APY for 2 months yields ~$66.0. The gross difference is $62.3. There are no emission tokens to liquidate here, so there's no issue of "whether the tokens you receive can be sold without slippage." This is one of the most comfortable aspects of this opportunity compared to airdrop-type opportunities.
Deductions consist of 4 items. I'll state all assumptions; you can recalculate with your numbers on the day.
1. Gas. The whole journey requires 3 on-chain transactions: approval for entry, deposit for entry, withdrawal for exit. On Ethereum mainnet on September 8, 2026, Etherscan showed a gas price of 0.051 gwei, with ETH price around $2,470. Based on actual transaction experience, each transaction costs about $0.3, totaling ~$0.9 for 3 transactions.
2. Tool fee, charged as a fixed percentage of gas cost, with a minimum amount. At the gas level above, the entire journey is on the order of less than $0.3 per transaction.
3. Slippage. This type of operation has no swap component, so it's 0.
4. Opportunity cost, already accounted for in the "compared to the vault" metric, not double-counted.
Thus, total journey cost ~$1.5, net excess ~$61.
So, what is the minimum viable position size? The excess APY is 3.74 percentage points, which over 2 months equals 0.62% of principal. Divide the cost by this to get the break-even principal:
At today's actual fee (journey ~$1), the threshold is around $160. If gas returns to 10 gwei, the threshold rises to ~$1,800; if it returns to 30 gwei, it rises to ~$5,400—which was precisely the number I estimated in my previous version, corresponding to a gas environment that doesn't exist today.
In other words, the threshold is entirely determined by the gas price on the day, not by the chain. "Mainnet is too expensive, must do it on cheaper chains" is wrong as of September 8, 2026—today's mainnet itself is cheap. But it can change back at any time: what you should monitor is the gas at the moment you send the transaction, not remember a fixed dollar threshold. This is the real takeaway from this section, and what I missed when I made that previous rough estimate.
Conclusion: At current fee levels, cost is no longer the barrier; risk is.
A $10,000 position is arithmetically valid. What should give you pause are the 3 points in Section 3.1—only 5% withdrawable liquidity, single collateral exposure, and no one watching for you.
Ask yourself first if you can tolerate queuing and bad debt, then ask if it's worthwhile. Reverse the order, and cheap gas might lead you into pools you shouldn't have entered.
8. Every Trigger Point
8.1 Collateral Maturity (Structured Assets with Maturity)
The collateral in this pool is a principal token with a clear maturity date, written in its name: December 10, 2026. Its price behavior changes as maturity approaches, discounts may widen, and the pool's risk profile shifts accordingly. Action: Exit at least two weeks before maturity; don't gamble on the final stretch.
8.2 Collateral Depegging
The oracle's current quote is 1 collateral token = 0.973 USDC, already at a discount, while the liquidation threshold is 91.5%. Depegging for such assets is not theoretical—a batch of real liquidations occurred in this pool on August 25.
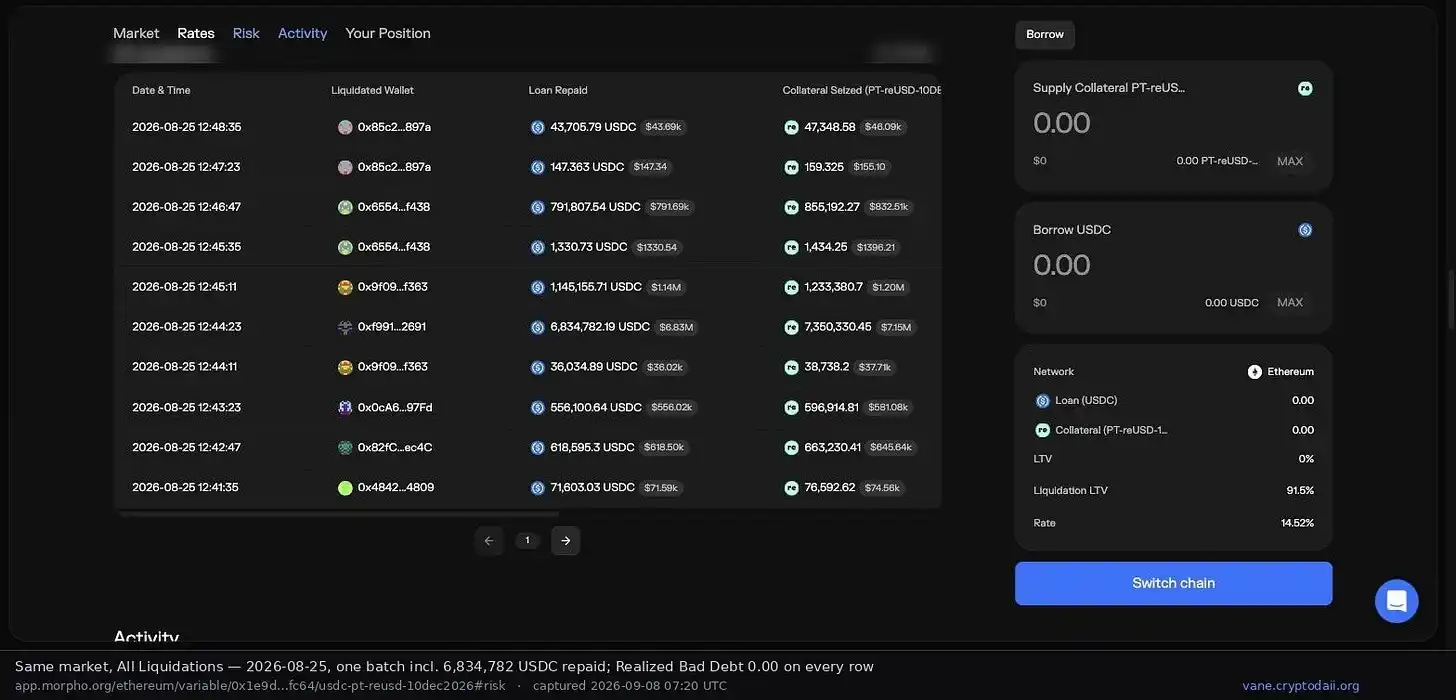
Figure 8: The pool's liquidation records from August 25. One entry repays $6.83 million; each row shows realized bad debt as 0.00.
This chart should be viewed both ways. The good side: The liquidation mechanism indeed worked, cleaning out positions in the millions without leaving bad debt. The bad side: It proves this collateral can indeed fall to the liquidation threshold, and in batches. Action: Treat the oracle quote as a monitoring metric; exit first if the discount widens significantly.
8.3 Utilization Hits Max, Unable to Withdraw
Current utilization is 94%, already past the 90% target line. Withdrawable liquidity is only 5% of total supply. Higher utilization means higher rates, which is precisely why the sign looks good, and also precisely why you might get stuck—these are two sides of the same coin. Action: Treat the percentage of withdrawable liquidity as a hard metric. Start queuing for exit when it falls below your acceptable line, don't wait until you want to leave to find others ahead of you.
8.4 Oracle Failure or Manipulation
Single price source, upgradable oracle contracts, ambiguous control ownership are all hard veto criteria. If this occurs, it's likely a total loss scenario, no middle ground. Action: Filter these out in the exclusion method of step 6.1 when selecting the pool; don't try to fix it afterwards.
9. Exit Signals Written Before Entry
First, unconditionally exit two weeks before the collateral maturity date.
Second, when the withdrawable liquidity as a percentage of total supply falls below your predetermined line (I use 5%; this pool is already at this line), start queuing for withdrawal.
Third, using the 7-day average metric, when your realized yield improvement over the conservative vault narrows to within two percentage points—the premium is gone, but the risk remains. Staying at this point is a pure loss.
Fourth, the number of verified curator vaults supplying to this pool decreases, or large amounts of capital withdraw. Others know something before you do.
Fifth, your own position size has grown to the point where it depresses the realized rate close to that of the vault—at this point, you're bearing all the extra risk without getting extra yield.
Discipline as always: Plan your exit before entry. Take the first 80%; leave the last bite for others.
Data & Sources
All data and screenshots are taken from the Morpho official application app.morpho.org, capture time 06:59 to 07:20 UTC on 2026-09-08. The bottom of each image includes the original URL and capture time for verification. All yield metrics in the article use the 7-day average; instantaneous values appear only in Section 2 for contrast.
- Vaults: Steakhouse USDC, contract 0xBEEF01735c132Ada46AA9aA4c54623cAA92A64CB, Ethereum, v1, total deposits $67.79 million, performance fee 5%, 7-day avg APY 3.96%, 30-day 3.93%, curator Steakhouse Financial. Steakhouse High Yield USDC, contract 0xbeeff2C5bF38f90e3482a8b19F12E5a6D2FCa757, Ethereum, v2, total deposits $43.21 million, performance fee 5%, management fee 0%, 7-day avg APY 5.09%, 30-day 5.29%, curator same Steakhouse Financial.
- Market: Ethereum USDC / PT-reUSD-10DEC2026, market ID 0x1e9d614631a7df0ec07fb05b2c8cb2491575fd1a63a33bf187a6afb295a4fc64, liquidation threshold 91.5%, creation date 2026-06-16, oracle 0x217d6DdCDB95112C51657F6270e8C079CFDB51f0, oracle quote 1 collateral token = 0.973 USDC (consistent with DefiLlama quote), rate model 0x870aC11D48B15DB9a138Cf899d20F13F79Ba00BC, target utilization 90%, current utilization 94.01%, total size $84.31 million, total borrows $78.82 million, withdrawable liquidity $4.16 million, liquidation penalty 2.61%, realized bad debt 0.00. Borrower-side rates: instantaneous 18.25%, 24h avg 10.51%, 7-day avg 8.19%. Supply-side 7-day avg derived from 8.19% multiplied by utilization ~7.7%.
- Supplying vaults for this market (sorted by allocation, first page): Pendle Ecosystem USDC $31.45 million (curator Armitage by Wintermute), Steakhouse High Yield USDC $9.99 million (Steakhouse Financial), RockawayX USDC Yield $9.97 million (RockawayX), Wintermute USDC Select $6.46 million (Armitage by Wintermute), Hyperithm USDC Apex $4.99 million (Hyperithm); subsequent pages include Re Ecosystem Vault, Smokehouse USDC, Keyrock USDC, etc.
- Morpho official contract address list docs.morpho.org/get-started/resources/addresses. Tool developed by myself: vane.cryptodaii.org.