Middle East Conflict Rekindles Rate Hike Expectations, Gold Suffers Worst Sell-off in 43 Years

marsbitPublicado a 2026-03-23Actualizado a 2026-03-23

Resumen

Gold suffered its worst weekly decline in 43 years, with spot prices falling for eight consecutive sessions—the longest losing streak since October 2023. Silver also plunged over 15%, while platinum and palladium followed lower. The sell-off was triggered by escalating Middle East conflicts, which drove up oil prices and reinforced expectations of Federal Reserve rate hikes rather than cuts. Market bets on a Fed hike by October rose to 50%, reducing the appeal of non-yielding gold amid higher real rate prospects. Technical indicators worsened, with RSI falling below 30, triggering stop-losses and self-reinforcing selling. Gold ETFs saw outflows for three straight weeks, losing over 60 tons. The situation echoes the 1983 crash when OPEC nations sold gold reserves to raise cash amid an oil price collapse. Despite a 4% year-to-date gain, macro conditions have deteriorated. Rising energy prices may reduce global GDP by 0.3% and lift inflation by 0.5-0.6%, increasing stagflation risks. Gold’s future trajectory hinges on real rates and geopolitical developments—further rate hike expectations could sustain pressure, while any de-escalation may revive safe-haven demand.

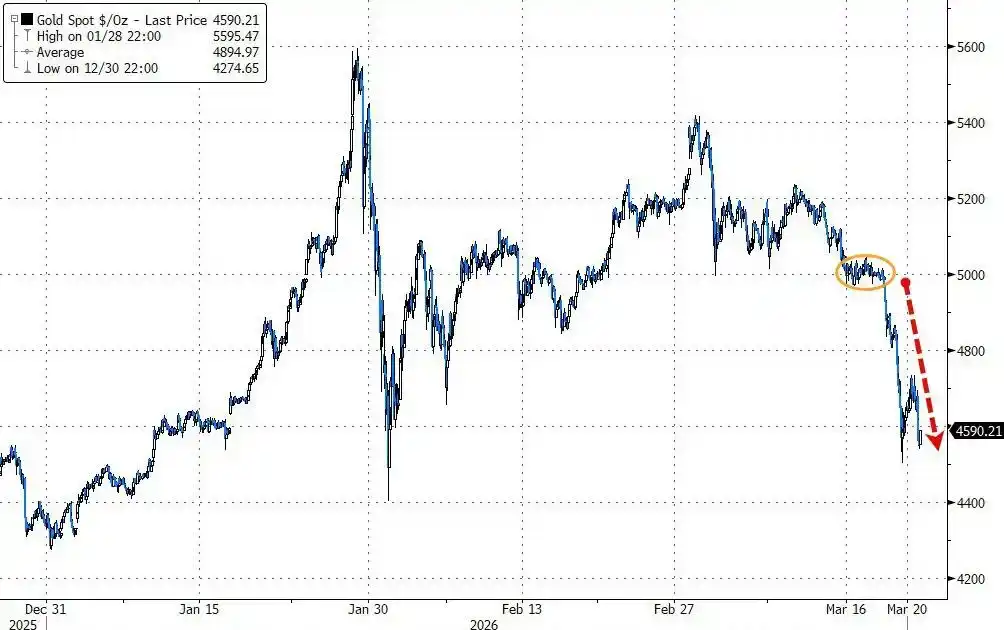
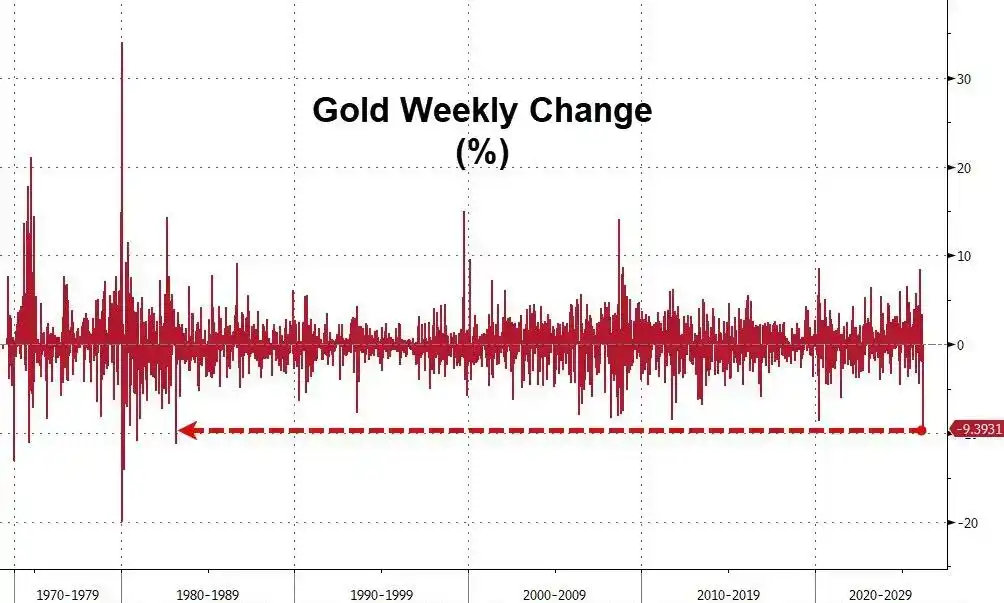
Gold recorded its worst weekly decline in 43 years this week, with historical echoes sending chills through the market.

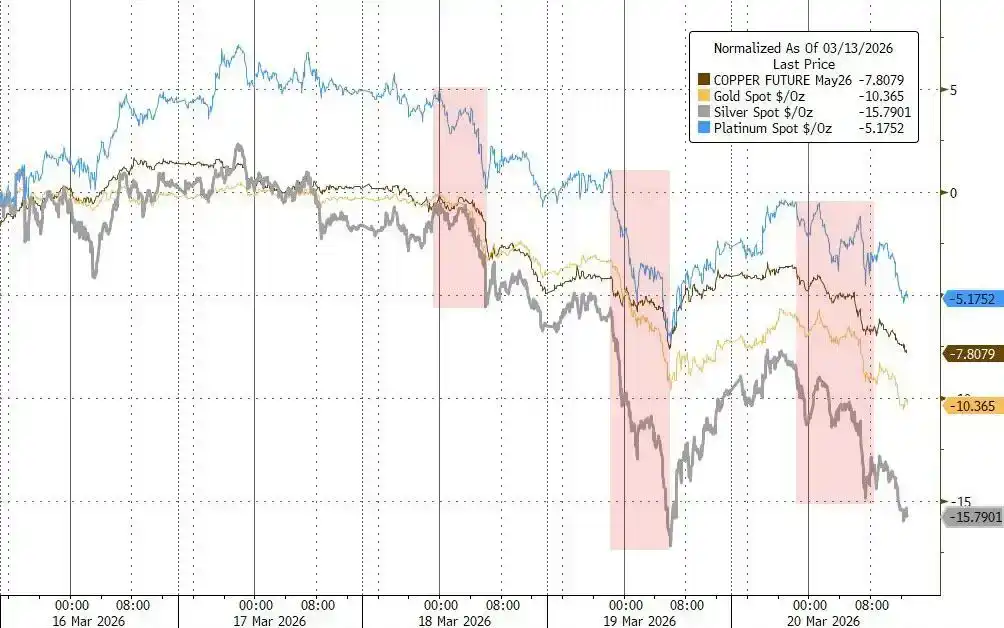
This week, gold posted its largest weekly drop since March 1983, with the spot price falling for eight consecutive days, marking the longest losing streak since October 2023. Meanwhile, silver fell more than 15% this week, with palladium and platinum also moving lower.

The trigger for this sharp decline was the escalating Middle East conflict, which pushed up energy prices and, in turn, suppressed expectations for interest rate cuts. Market bets on a Federal Reserve rate hike have risen to 50%, fueling this wave of selling in precious metals.

More alarmingly for the market, the current situation bears a striking resemblance to the historic crash in March 1983, which was triggered by massive gold sales by Middle Eastern oil producers—back then, OPEC members, facing plummeting oil revenues, were forced to sell their gold reserves for cash, causing the gold price to plunge over a hundred dollars in a matter of days.

It is worth noting that, according to historical data, this week's decline in gold is the most severe since that "sell-gold-for-cash" storm 43 years ago.

Rate Cut Expectations Unravel, Gold's Safe-Haven Logic Fails

Since the US and Israel launched attacks on Iran last month, gold has been declining for several weeks, a stark contrast to its traditional role as a "safe-haven asset."

The reason is that the war brings not expectations of easing but inflationary pressures. Currently, the market's prediction of the Fed's policy path has undergone a fundamental reversal.

Traders are now pricing in a 50% probability of a Fed rate hike by October. Soaring energy prices are boosting inflation expectations, and gold, as a non-yielding asset, becomes significantly less attractive in an environment of rising real interest rates.

At the same time, there are signs of tightening US dollar liquidity. Cross-currency basis swaps began to widen noticeably this week, indicating a degree of dollar funding pressure.

This phenomenon may explain the deeper logic behind the gold sell-off—when dollar liquidity tightens, gold is often one of the first assets investors liquidate.

It is noteworthy that the most severe declines in the metals market this week were concentrated during Asian and European trading hours, consistent with the pattern of dollar shortage pressures first appearing in offshore markets.

Technical Stop-Losses Triggered, Selling Becomes Self-Reinforcing

Amid the sustained decline, gold's technical indicators have deteriorated significantly, with the 14-day Relative Strength Index (RSI) falling below 30, entering a zone some traders consider oversold.

Rhona O'Connell, an analyst at StoneX Financial, pointed out that this gold correction is the result of profit-taking and liquidity liquidation. She stated that the price above $5,200 had attracted substantial buying, making the market积累相当的回调脆弱性 (accumulated considerable vulnerability to a correction).

Once prices started to fall, a large number of investors' stop-loss orders were automatically triggered, rapidly forming a self-reinforcing spiral of selling. Technical signals like moving averages further exacerbated the downward pressure.

Meanwhile, passive selling triggered by falling stock markets also spilled over into gold.

O'Connell noted that forced liquidations related to equity assets may have dragged down gold prices, while slowing central bank gold purchases and continued outflows from gold ETFs further dampened market sentiment. According to Bloomberg data, gold ETFs have seen net outflows for three consecutive weeks, with combined holdings dropping by more than 60 tonnes over those three weeks.

The Ghost of the 1983 Middle East "Sell-Gold-for-Cash"

The current situation reminds market participants of the oil crisis-induced gold crash 43 years ago.

Historical data shows that around February 21, 1983, British and Norwegian oil producers led price cuts, putting pressure on OPEC to follow suit, abruptly intensifying the global oil market's oversupply. Facing a sharp contraction in oil revenues, Middle Eastern oil producers (mainly OPEC members) were forced to sell their gold reserves on a large scale to raise cash, triggering a gold price crash.

Reporting from The New York Times at the time corroborates this. According to a March 1, 1983, New York Times report, traders explicitly stated that sales by Middle Eastern oil producers were the direct trigger for the gold price plunge and warned that if oil revenues fell further, these Arab countries might sell more gold. At that time, the gold price plunged more than $105 from its high in less than a week, with the largest single-day drop reaching $42.50, the worst in nearly three years.

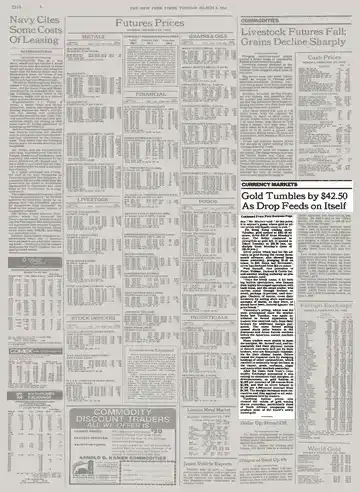
According to the New York Times report at the time, the proceeds from the Middle Eastern sales immediately flowed into Eurodollars and other short-term investment vehicles, causing short-term interest rates to soften, which in turn sent a warning signal to the global gold market. Since February 21 coincided with the US Presidents' Day holiday, with New York markets closed, the full impact wasn't felt until the following week, subsequently triggering chain-reaction forced liquidations that also affected commodity markets like copper, grains, soybeans, and sugar.

ZeroHedge pointed out that the 1983 gold crash marked the entry of the oil market into a bear market cycle that lasted for years—OPEC discipline frayed, market share was continuously lost, and oil prices remained under pressure throughout the 1980s.

Stagflation Clouds Loom, Can Gold Prices Stabilize?

Despite this week's heavy losses, gold is still up about 4% year-to-date. The price hit a record high of nearly $5,600 per ounce in late January, supported then by investor enthusiasm, central bank buying sprees, and market concerns about Trump interfering with Fed independence.

However, the current macroeconomic environment has significantly deteriorated. According to a Bloomberg report, Goldman Sachs economist Joseph Briggs expects that rising energy prices will drag global GDP down by 0.3 percentage points over the next year and push overall inflation up by 0.5 to 0.6 percentage points. Rising stagflation risks are severely compressing central banks' policy space.

Goldman Sachs analyst Chris Hussey noted that the blockade of the Strait of Hormuz has entered its fourth week, and hopes for a quick resolution of the conflict are fading. If the conflict continues, the longer oil prices remain high, the harder it becomes for the "look-through the short-term pain" narrative in stock and bond markets to hold, and the vulnerability of global assets will be further exposed.

For gold, the path of real interest rates will be a key variable. If the conflict drags on, inflation expectations continue to heat up, and the Fed's rate hike path becomes clearer, pressure on gold may persist; whereas, once signals of a easing in geopolitical tensions emerge, whether suppressed safe-haven demand can be released again remains the market's biggest悬念 (suspense).

Preguntas relacionadas

QWhat was the sharpest weekly decline in gold prices since 1983 triggered by?

AThe sharpest weekly decline in gold prices since 1983 was triggered by escalating Middle East conflicts, which raised energy prices and suppressed expectations for interest rate cuts, leading to increased bets on Federal Reserve rate hikes.

QHow does the current gold market situation parallel the historical event of 1983?

AThe current situation parallels the 1983 event where OPEC members, facing a sharp drop in oil revenue, were forced to sell off their gold reserves to raise cash, causing a historic crash in gold prices.

QWhy did the traditional 'safe-haven' logic for gold fail during the recent Middle East tensions?

AThe traditional safe-haven logic failed because the war brought inflationary pressure instead of expectations for monetary easing. Rising energy prices increased inflation expectations, making gold, a non-yielding asset, less attractive as real rates rose.

QWhat technical indicator signaled that gold had entered oversold territory during the sell-off?

AThe 14-day Relative Strength Index (RSI) fell below 30, which is a level some traders consider to indicate an oversold market.

QAccording to Goldman Sachs analysis, what is the expected economic impact of rising energy prices?

AGoldman Sachs economists estimated that rising energy prices would reduce global GDP by 0.3 percentage points over the next year and raise overall inflation by 0.5 to 0.6 percentage points, increasing stagflation risks.

Lecturas Relacionadas

Has Hook Summer Really Arrived? sato, Lo0p, FLOOD Ignite the New Narrative of Uniswap v4

"Hook Summer" Arrives? Sato, Lo0p, FLOOD Ignite Uniswap v4 Narrative Amidst a slight market recovery, attention within the Ethereum ecosystem has shifted to Meme coins built on Uniswap v4's Hook protocol. Following ASTEROID, tokens like sato, sat1, Lo0p, and FLOOD have become market focal points, with market caps ranging from millions to tens of millions, bringing concentrated liquidity to a narrative-dry market. Uniswap v4 Hooks are "plugin smart contracts" that allow developers to inject custom logic at key points in a liquidity pool's lifecycle (initialization, adding/removing liquidity, swaps, etc.), making the AMM programmable. Recent representative projects include: * **sato**: Market cap peaked over $38M; uses a v4 curve mechanism for minting/burning, locking ETH as reserve. * **sat1**: Market cap briefly exceeded $10M, positioning as an "optimized sato," but later declined significantly. * **Lo0p**: Market cap neared $6.6M; a "lending AMM protocol" allowing users to borrow ETH against deposited LO0P tokens without immediate selling pressure. * **FLOOD**: Market cap approached $6M; channels trading reserves into Aave v3 to generate yield, which is retained in the pool. The emergence of these Hook-based tokens could drive long-term growth for the Uniswap ecosystem by attracting users and liquidity to v4 pools. Combined with Uniswap's activated fee switch (partially used to burn UNI), the long-term outlook for UNI appears positive. However, short-term UNI price appreciation is not directly guaranteed. Factors include the sustainability and lifecycle of these new tokens, their price volatility, overall market conditions, and regulatory pressures. Currently, Uniswap v4's TVL ($595M) lags behind v3 and v2, indicating Hook adoption still requires time to mature. In summary, the Hook ecosystem serves as "long-term nourishment" for UNI, but acts more as a "catalyst" than a direct "booster" in the short term. Note: These are early-stage experimental tokens and may carry unknown risks.

marsbitHace 24 min(s)

Has Hook Summer Really Arrived? sato, Lo0p, FLOOD Ignite the New Narrative of Uniswap v4

marsbitHace 24 min(s)

Has Hook Summer Truly Arrived? sato, Lo0p, FLOOD Ignite the New Uniswap v4 Narrative

With the broader market showing signs of recovery, a new wave of interest has emerged around Ethereum-based meme coins. Following ASTEROID, tokens like sato, sat1, Lo0p, and FLOOD, built upon the Uniswap v4 Hook protocol, are capturing market attention. Their market capitalizations range from millions to tens of millions of dollars, injecting much-needed focused liquidity into a market lacking narratives. This article explores whether this trend signifies an incoming "Hook Summer" and its potential impact on UNI's price. Hooks are essentially plug-in smart contracts for Uniswap v4 liquidity pools, allowing developers to inject custom logic at key points in a pool's lifecycle (like initialization, adding/removing liquidity, swaps). This transforms the AMM into programmable building blocks. Key highlighted projects include: * **sato**: Peaked over $38M market cap. It utilizes a v4 curve for minting/burning; buying locks ETH as reserve to mint new tokens, while selling redeems ETH from the reserve and burns tokens. * **sat1**: Market cap briefly exceeded $10M, promoted as an "optimized sato," but later declined significantly. * **Lo0p**: Reached nearly $6.6M. It's a lending AMM protocol where buying LO0P tokens locks them as collateral, allowing users to borrow ETH from the pool reserve at 40% LTV, aiming to improve capital efficiency for idle ETH in LPs. * **FLOOD**: Peaked near $6M. Its mechanism directs asset reserves from buys into Aave v3 to generate yield, with fees and interest retained in the pool to potentially influence the token's price long-term. In the long term, the development of the Hook ecosystem can attract users and liquidity to Uniswap v4, benefiting UNI's fundamentals—especially combined with the recent activation of the protocol fee switch, where a portion of fees is used to burn UNI. However, in the short term, these Hook-based tokens are unlikely to directly drive significant UNI price appreciation. Their impact is moderated by factors like token sustainability, price volatility, and broader market and regulatory conditions. Currently, Uniswap v4's TVL ($595M) still trails behind v2 and v3, indicating adoption and growth will take time. The article concludes that while the Hook ecosystem provides long-term "nourishment" for UNI, its short-term role is more of a "catalyst" than a "booster." Readers are cautioned that these are early-stage experimental tokens and may carry unknown risks.

Odaily星球日报Hace 37 min(s)

Has Hook Summer Truly Arrived? sato, Lo0p, FLOOD Ignite the New Uniswap v4 Narrative

Odaily星球日报Hace 37 min(s)

Interview with Michael Saylor: I Did Say I Would Sell Bitcoin, But Never a Net Sale

Interview with Michael Saylor: I Said We'd Sell Bitcoin, But Never Be a Net Seller In a recent podcast, MicroStrategy Executive Chairman Michael Saylor clarified the company's stance on potentially selling Bitcoin. Following MicroStrategy's earnings call statement about being prepared to sell BTC to fund dividends for its STRC (Strategic) credit product, Saylor emphasized the distinction between selling and being a "net seller." Saylor explained the core business model: MicroStrategy sells credit instruments like STRC and uses the proceeds to buy Bitcoin, which is viewed as "digital capital" expected to appreciate around 30-40% annually. A portion of these capital gains can then be used to pay the dividends on the credit products. He stressed that even if the company sells some Bitcoin for dividends, it simultaneously buys much more with new credit issuance. For example, after raising $3.2 billion from STRC sales in April, the dividend obligation was only $80-90 million, making the company a net buyer. The clarification aims to counter market narratives questioning the value of Bitcoin on MicroStrategy's balance sheet if it were never sold, and to dismiss claims of a "Ponzi scheme." Saylor reiterated his personal philosophy for investors: "Don't be a net seller of bitcoin" and ensure your Bitcoin holdings increase each year. Saylor also discussed Bitcoin's role as the foundation for "digital credit," noting that STRC has become the largest and most liquid preferred stock issue in the U.S., offering high risk-adjusted returns (Sharpe ratio). He highlighted Bitcoin's deep liquidity, stating that even large purchases by MicroStrategy do not move the market significantly, which is driven by macro factors, geopolitical tensions, and capital flows from ETFs and credit products. Finally, Saylor reflected on his early inspiration from sci-fi books, which motivated his path to MIT, and maintained his fundamental thesis on Bitcoin remains unchanged: it is superior digital capital enabling superior digital credit.

链捕手Hace 41 min(s)

Interview with Michael Saylor: I Did Say I Would Sell Bitcoin, But Never a Net Sale

链捕手Hace 41 min(s)

Trading

Spot
Futuros
活动图片