Mapping Out The 4.5X Move That Will Send Dogecoin To New All-Time Highs

bitcoinistPublicado a 2026-01-13Actualizado a 2026-01-13

Resumen

Dogecoin's technical structure is stabilizing after recent volatility, with analysis pointing to a potential major bullish continuation based on historical patterns. A long-term 6-day candlestick chart analysis reveals a consistent pattern of higher lows since 2024, similar to cycles dating back to 2016. This trend of ascending support levels suggests the macro trend remains intact and supportive of future price increases, with current support holding above $0.13. The analysis projects that this consolidation could resolve in a significant upward move, similar to historical breakouts. A rally of approximately 369% from current levels would push Dogecoin back to its all-time high of around $0.739. Furthermore, a move of at least 4.5x from the current price of $0.14 is projected, potentially driving the cryptocurrency to a new all-time high above $0.80.

Dogecoin has changed back to its technical structure as the price action digests the recent price rally. After the initial volatility seen earlier in the month, price action has begun to stabilize, and recent technical analyses are evaluating what the larger trend is revealing.

Based on that context, a higher-timeframe technical analysis shared on X by Javon Marks has outlined a scenario that frames the current price action as part of a wider bullish continuation built on repeating historical patterns on Dogecoin’s long-term chart.

Higher Lows Shaping The Trend

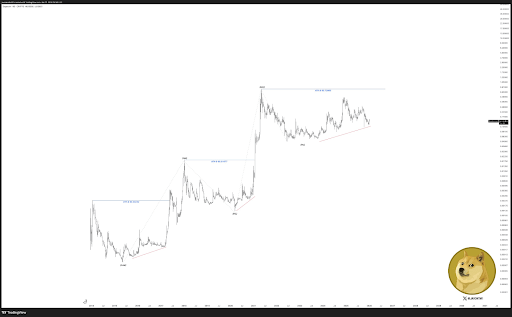
Technical analysis of Dogecoin’s 6-day candlestick timeframe chart shows an interesting formation taking place in its price action since 2024, and this goes back to how it traded much earlier cycles stretching as far back as 2016.

The main idea behind this long-term technical analysis is Dogecoin’s ability to maintain a sequence of higher lows throughout different market cycles. The 6-day candlestick chart by the analyst shows that each major pullback in the Dogecoin price over the years has found support along a rising trend line, which has allowed the price to consolidate and reset without breaking the broader structure.

The present setup reflects that same behavior, with recent pullbacks holding above ascending support. Dogecoin’s recent price action is holding above $0.13, and this can be considered a higher low compared to the lows in 2024 and 2025. As long as this pattern of higher lows is intact, then the macro trend can be viewed as supportive of higher prices over time.
Source: X

Projecting A 369% Push Back To The All-Time High

The technical analysis on the chart also shows how earlier periods of consolidations and higher lows eventually resolved into powerful upward moves. Playouts of the previous rallies broke above their previous all-time highs and then created a new all-time high. The first case was a break above the 2014 high of $0.00232 in 2017 to finally end at a new high of $0.01877. This high was then broken again in 2021 to finally reach a new peak, which serves as the current reference level for current price action.

In this case, the reference level is Dogecoin’s all-time high around $0.73905. Based on current price levels, a rally of roughly 369% would be enough to carry Dogecoin back to that zone.

Interestingly, the analysis goes a step further to predict a move past the current all-time high with a move of at least 4.5X from the current price level. Dogecoin’s current price level is trading at $0.14 at the time of writing, and this would put it trading at a price target of at least $0.8 when the move finally plays out.

DOGE pushes lower with decline | Source: DOGEUSDT on Tradingview.com

Criptos en tendencia

Preguntas relacionadas

QWhat is the main technical pattern identified in Dogecoin's long-term price action that supports a bullish outlook?

AThe main technical pattern is a sequence of higher lows throughout different market cycles, with each major pullback finding support along a rising trend line, indicating a broader bullish continuation structure.

QAccording to the analysis, what price level is Dogecoin currently holding above to maintain the higher low pattern?

ADogecoin is currently holding above $0.13, which is considered a higher low compared to the lows in 2024 and 2025.

QWhat percentage increase is required for Dogecoin to reach its previous all-time high of approximately $0.73905 from current levels?

AA rally of roughly 369% would be required to carry Dogecoin back to its previous all-time high zone of $0.73905.

QWhat is the analyst's predicted price target for Dogecoin if it achieves a 4.5X move from its current price?

AThe predicted price target is at least $0.8 if Dogecoin achieves a 4.5X move from its current price of $0.14.

QWhich previous Dogecoin all-time highs were broken in the analysis to illustrate the pattern of powerful upward moves?

AThe 2014 high of $0.00232 was broken in 2017 to reach a new high of $0.01877, which was then broken again in 2021 to set the current all-time high around $0.73905.

Lecturas Relacionadas

Why Bitcoin Holds Above $64,000 After Fed's Hard Pause

**Bitcoin Stabilizes Near $64,000 Following Hawkish Fed Pause** The cryptocurrency market, led by Bitcoin, remained stable around $64,000 despite a volatile reaction to the latest U.S. Federal Reserve meeting. The Fed paused interest rates but signaled a hawkish stance, with three committee members voting for an increase—the highest dissent since 2016. This limits risk appetite but hasn't triggered panic selling. Key market highlights include Bitcoin ETFs seeing a net inflow of $32.1 million, breaking a streak of outflows, while Ethereum ETFs experienced outflows of $18.65 million. Liquidations affected about 90,000 traders. Technically, Bitcoin finds support around $63,000-$63,500, with major resistance near $66,000. While its price is about 49% below its all-time high, institutional demand via ETFs and the absence of mass capitulation support a potential recovery scenario in the second half of the year. Major altcoins showed mixed movements, with Solana attracting capital while Ethereum faced selling pressure despite strong on-chain metrics like a growing staking queue. Regulatory news took a pause as the U.S. Senate delayed the CLARITY Act vote until at least autumn. For the final trading day of July, U.S. inflation and consumer spending data will be crucial. Bitcoin's key levels to watch are $63,000 support and $66,000 resistance. Sustained ETF inflows and Bitcoin holding above $63,000 are seen as positive signs for a potential market recovery later in the year.

cryptonews.ruHace 1 hora(s)

Why Bitcoin Holds Above $64,000 After Fed's Hard Pause

cryptonews.ruHace 1 hora(s)

Participants in XRP Fraud Scheme That Stole $9 Million from 71 Investors Arrested

South Korean police have arrested three individuals accused of operating a fraudulent investment platform that stole approximately 3.4 million XRP (worth about $9 million) from 71 investors between October 16 and 23. The suspects promoted the site Fxrpntwork.com through blogs, online articles, and YouTube videos, promising guaranteed principal and monthly returns of 1.5% to 1.8%. Investors were instructed to transfer XRP from Korean exchanges to overseas platforms and then to wallets controlled by the group before the site was shut down. The scammers copied the branding of legitimate projects Flare Network and FXRP to appear credible. Authorities warn that such impersonation frauds, which use familiar branding and urgent promises of guaranteed profits, are a common red flag. Legitimate companies do not solicit cryptocurrency transfers through unsolicited promotions. Seoul police have issued an Interpol Red Notice for a fourth suspect abroad and are investigating others involved in creating and promoting the fraudulent website. While investigators froze 17.3 billion won in assets, approximately 10 billion won was moved during the probe, with wallet analysis revealing transfers totaling 27.3 billion won, suggesting there may be additional unidentified victims and accomplices. The case underscores the organized, cross-border nature of crypto investment fraud.

cryptonews.ruHace 1 hora(s)

Participants in XRP Fraud Scheme That Stole $9 Million from 71 Investors Arrested

cryptonews.ruHace 1 hora(s)

Trading

Spot

Artículos destacados

Cómo comprar MOVE

¡Bienvenido a HTX.com! Hemos hecho que comprar Movement (MOVE) sea simple y conveniente. Sigue nuestra guía paso a paso para iniciar tu viaje de criptos.Paso 1: crea tu cuenta HTXUtiliza tu correo electrónico o número de teléfono para registrarte y obtener una cuenta gratuita en HTX. Experimenta un proceso de registro sin complicaciones y desbloquea todas las funciones.Obtener mi cuentaPaso 2: ve a Comprar cripto y elige tu método de pagoTarjeta de crédito/débito: usa tu Visa o Mastercard para comprar Movement (MOVE) al instante.Saldo: utiliza fondos del saldo de tu cuenta HTX para tradear sin problemas.Terceros: hemos agregado métodos de pago populares como Google Pay y Apple Pay para mejorar la comodidad.P2P: tradear directamente con otros usuarios en HTX.Over-the-Counter (OTC): ofrecemos servicios personalizados y tipos de cambio competitivos para los traders.Paso 3: guarda tu Movement (MOVE)Después de comprar tu Movement (MOVE), guárdalo en tu cuenta HTX. Alternativamente, puedes enviarlo a otro lugar mediante transferencia blockchain o utilizarlo para tradear otras criptomonedas.Paso 4: tradear Movement (MOVE)Tradear fácilmente con Movement (MOVE) en HTX's mercado spot. Simplemente accede a tu cuenta, selecciona tu par de trading, ejecuta tus trades y monitorea en tiempo real. Ofrecemos una experiencia fácil de usar tanto para principiantes como para traders experimentados.

315 Vistas totalesPublicado en 2024.12.13Actualizado en 2026.06.02

Cómo comprar MOVE

Discusiones

Bienvenido a la comunidad de HTX. Aquí puedes mantenerte informado sobre los últimos desarrollos de la plataforma y acceder a análisis profesionales del mercado. A continuación se presentan las opiniones de los usuarios sobre el precio de MOVE (MOVE).

活动图片













