Latest Stablecoin Report: Real Distribution and Flow Are Far More Important Than Supply

Odaily星球日报Publicado a 2026-02-27Actualizado a 2026-02-27

Resumen

The latest stablecoin report emphasizes that beyond the total supply of over $304 billion (a 49% YoY increase), the distribution, holder concentration, and on-chain activity provide deeper insights into capital movement. USDT and USDC dominate with 89% market share, but challenger stablecoins like USDS and PYUSD saw significant growth in 2025. Holder analysis reveals centralized exchanges hold $80 billion, while whale wallets account for $39 billion. Despite 172 million unique addresses, concentration is extreme for smaller stablecoins—top 10 wallets often hold 60-99% of supply, increasing de-peg risks. Monthly transfer volume reached $10.3 trillion in January 2026, doubling YoY. USDC transfers were 5x higher than USDT, indicating faster circulation. Activity categorization shows 90% of transfers are identifiable: DEX liquidity provision ($5.9T) and flash loans ($1.3T) dominate, highlighting stablecoins’ role as trading collateral and leverage tools. Circulation velocity varies widely: USDC on Base cycles 14x daily due to DeFi activity, while Ethereum-based USDT (0.2x) remains largely idle. Yield-focused stablecoins like USDe exhibit low velocity by design, as they are staked for returns. The data underscores that stablecoins are not just static assets but dynamic infrastructure reflecting capital allocation strategies.

Author | @Dune

Compiled by | Odaily Planet Daily (@OdailyChina)

Translator | DingDang (@XiaMiPP)

Editor's Note: While the market is still accustomed to using "total supply" to summarize the stablecoin world, a set of more granular data is revealing another layer of reality. A single supply figure can only answer "how much," but it cannot explain "who is holding," "how it flows," or "why it stays." When we observe supply scale, holding concentration, on-chain circulation velocity, and specific activity categories on the same map, what we see is no longer a static stock, but a dynamic structure of how capital migrates, settles, leverages, and reprices on-chain.

This perspective is important because it may correct our intuitive judgments of the past year. The crypto market's downturn and the strong performance of U.S. stocks form a stark contrast. The panic amplified by whale sell-offs and price retracements easily leads to the belief that capital is fleeing the crypto world. However, the on-chain data presented in this article, along with signals from Circle's recent financial report, suggest that the funds may not have disappeared; they might have just temporarily withdrawn from high-volatility risk assets. At the very least, on-chain data proves they are entering incentive-based activities rather than being used for trading demand.
Everyone quotes that supply number. It appears in every report, every earnings call, and every policy hearing. But beyond "a circulating scale of over $300 billion," how much do we really know about stablecoins?

Who is holding them? How concentrated are the holdings? How fast do they circulate, and on which chains are they primarily active? What are they actually used for—as DeFi liquidity, payment tools, or simply "cash equivalents" for parking funds?

Meta just announced plans to integrate third-party stablecoin payments into its platform; the OCC (Office of the Comptroller of the Currency) approved a national trust bank charter for Stablecoin; Payoneer announced stablecoin functionality for 2 million businesses; Anchorage Digital launched compliant stablecoin services for non-U.S. banks. Institutions and regulators are accelerating their entry, and the answers they need clearly go beyond just a supply number.

We used the latest stablecoin dataset released by Dune—developed in collaboration with Steakhouse Financial—to answer some of these questions. Here are the results revealed by the data.

Supply Overview

As of January 2026, the fully diluted supply of the top 15 stablecoins on EVM, Solana, and Tron reached $304 billion, a year-on-year increase of 49%. Tether's USDT ($197 billion) and Circle's USDC ($73 billion) still dominate with an 89% market share.

Looking at chain distribution, Ethereum carries $176 billion (58%), Tron $84 billion (28%), Solana $15 billion (5%), and BNB Chain $13 billion (4%). Even though the total supply has nearly doubled, this on-chain distribution structure has seen almost no significant change over the past year.
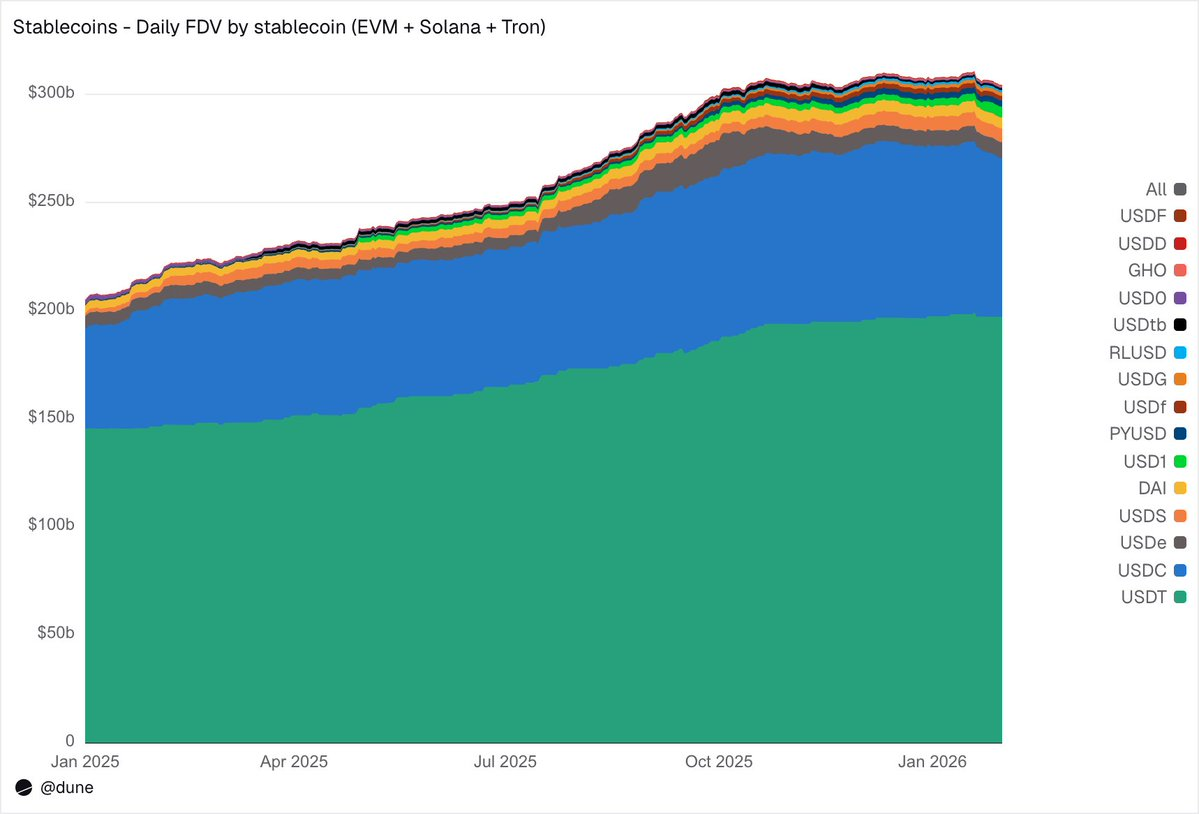
But beneath the top two stablecoins, 2025 was a year of challenger growth. USDS (Sky/MakerDAO) grew 376% to $6.3 billion; PYUSD (PayPal) grew 753% to $2.8 billion; RLUSD (Ripple) jumped from $58 million to $1.1 billion, a staggering increase of 1803%; USDG expanded 52 times; USD1 grew from zero to $5.1 billion.

Of course, not all challengers moved in the same direction. USD0 fell 66%; Ethena's USDe nearly tripled at its October peak, ending the year up 23%. Even so, the number of competitors in the layer below USDT and USDC has increased significantly.

Who is Holding Them?

Most stablecoin datasets can only tell you the total supply. Because our dataset tracks balances at the wallet level and incorporates address labels, we can answer a more critical question: Who is holding these stablecoins?
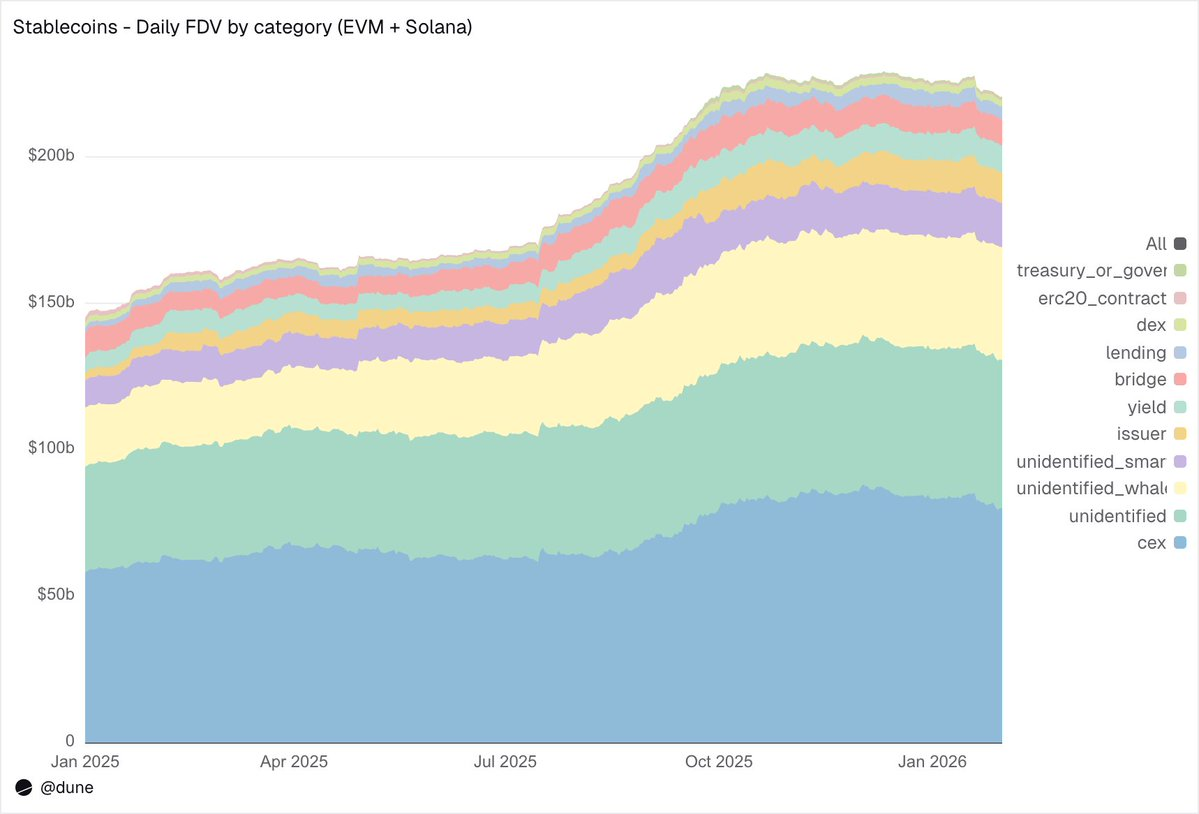
In the EVM and Solana ecosystems, centralized exchanges are currently the largest identified category, holding $80 billion, up from $58 billion a year ago. Stablecoins are, first and foremost, the infrastructure for exchange trading and settlement.

Whale wallets hold $39 billion; holdings in yield protocols almost doubled to $9.3 billion, reflecting the growth of on-chain yield strategies; issuer addresses—including treasuries and minting/burning contracts—jumped from $2.2 billion to $10.2 billion, a 4.6x increase, directly reflecting the scale of new supply entering the market.

Regarding label quality: Only 23% of the supply is in completely unidentified addresses. For on-chain data, this is a fairly high identification rate—and it is crucial for understanding where stablecoin risk is actually distributed.

172 Million Holders, But Extremely Concentrated

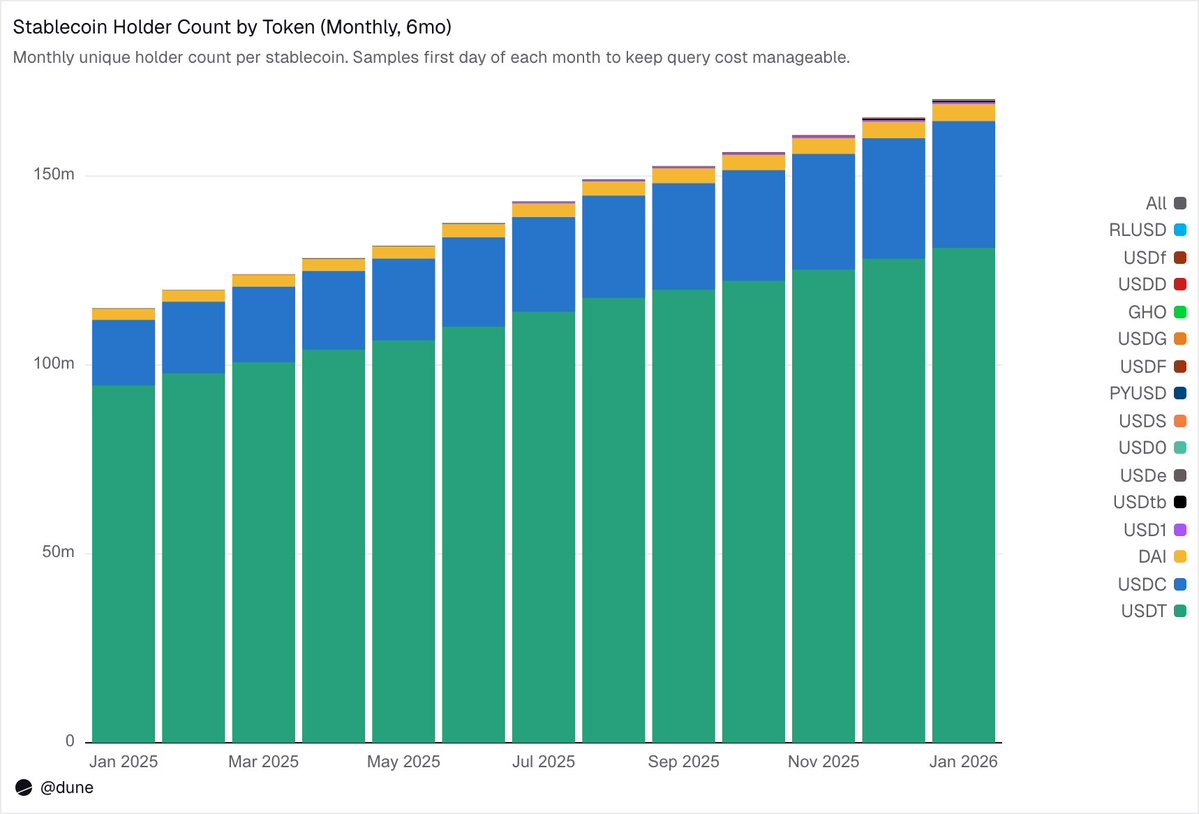
As of February 2026, a total of 172 million unique addresses hold at least one of these 15 stablecoins. USDT accounts for 136 million, USDC for 36 million, and DAI for 4.7 million. The distribution of these three stablecoins is very broad: The top 10 wallets hold only 23%–26% of the supply, with an HHI (Herfindahl-Hirschman Index, where 0 represents perfect dispersion and 1 represents a single holder) below 0.03.
Other stablecoins present a completely different picture. The top 10 wallets often control 60% to 99% of the supply. Taking USDS as an example, although its circulating scale is $6.9 billion, 90% of it is concentrated in 10 wallets (HHI 0.48). USDF's concentration is even higher, with the top 10 addresses holding 99% of the supply (HHI 0.54). As for USD0, it almost reaches an extreme: also 99% concentrated in the top 10 wallets, but the HHI is as high as 0.84, meaning even within these top ten, the supply is dominated by one or two addresses.

This does not mean these stablecoins are inherently flawed—some projects are relatively young, and some are designed from the outset for institutional clients. But it does mean their "supply" numbers cannot be interpreted in the same way as USDT or USDC. Holding concentration directly impacts de-pegging risk, liquidity depth, and whether the so-called "supply scale" represents real organic demand or merely reflects the allocation behavior of a few large holders. This kind of analysis is only possible when you have the balance data for every holder, not just the aggregate supply derived from minting/burning events.

January 2026: Transfer Volume $10.3 Trillion

In January 2026, the total transfer volume of stablecoins within the EVM, Solana, and TRON ecosystems reached $10.3 trillion, more than double that of January 2025.

The on-chain distribution contrasts sharply with the supply structure: Base led with $5.9 trillion, despite having a supply of only $4.4 billion; Ethereum had $2.4 trillion; Tron had $682 billion; Solana had $544 billion; BNB Chain had $406 billion.
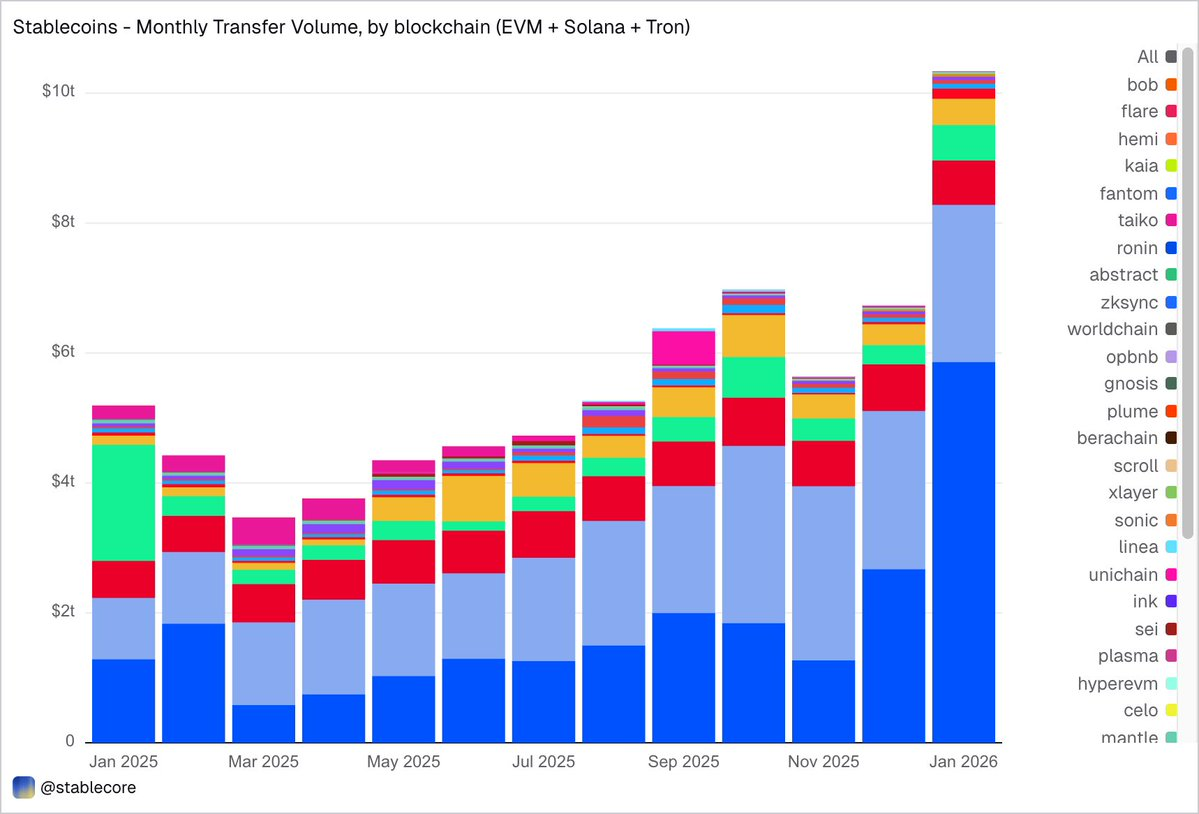
By token, USDC dominated with $8.3 trillion—almost 5 times that of USDT ($1.7 trillion)—despite its supply being only about 1/2.7 of the latter. USDC clearly circulates faster and more frequently. DAI had $138 billion, USDS had $92 billion, and USD1 had $43 billion.

It's important to emphasize that this data is deliberately kept objective and neutral. The dataset does not pre-filter "real" economic activity based on a fixed standard, so the total volume may include flows generated by automated behaviors such as arbitrage, bots, and internal routing. Instead of hard-coding judgments into the data, we provide an objective perspective, allowing users to choose their own filtering methods—whether to exclude bot transactions, identify organic usage, or define transaction activity metrics that better reflect actual conditions.

What Are Stablecoins Actually Doing?

This is where the granularity advantage of this dataset truly shines. Transfers are not simply labeled as "amount" but are categorized into different activity types based on the on-chain triggering mechanism. This means we not only know that "$10 trillion flowed," but also "why it flowed."
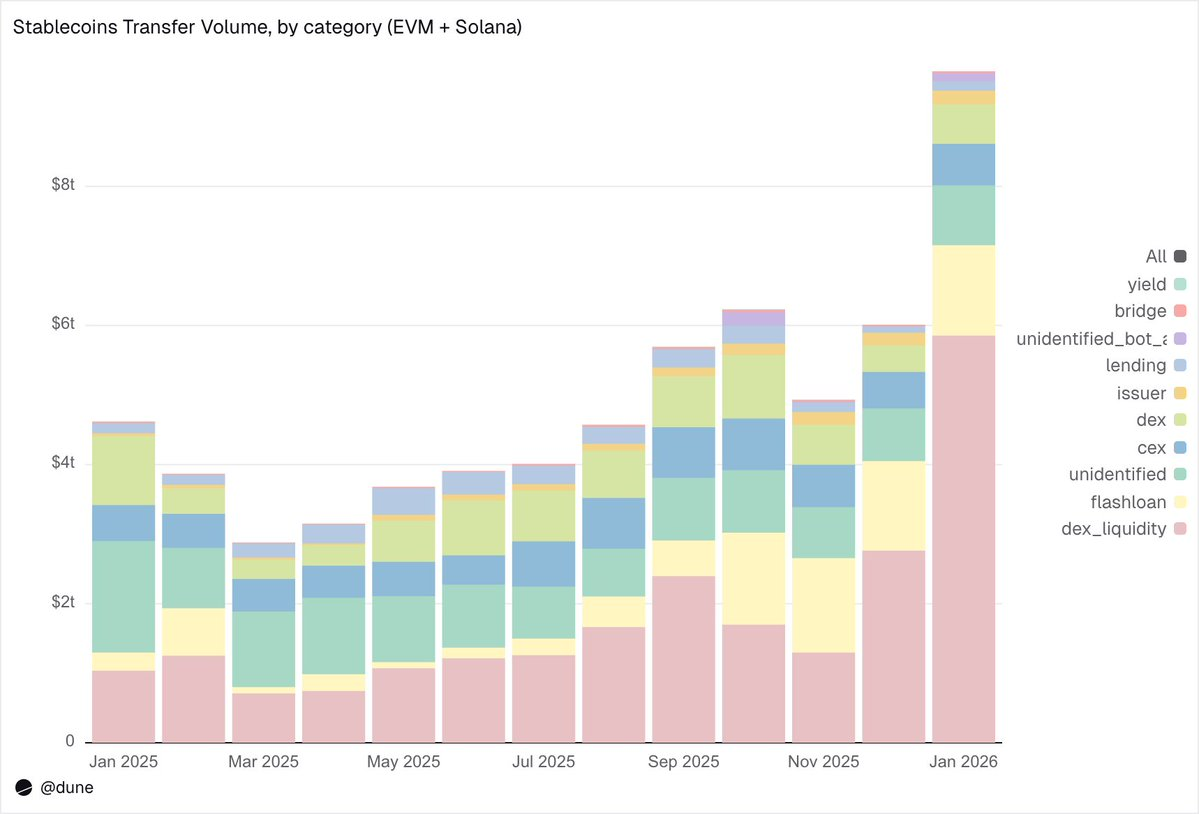
1. Market Infrastructure (DEX Trading & Liquidity)

  • DEX Liquidity Provision & Withdrawal: $5.9 trillion—The largest application, reflecting the role of stablecoins as base assets for on-chain market making.
  • DEX Swaps: $376 billion—Direct trading activity on automated market makers.

Together, these indicate that stablecoins are primarily trading collateral and liquidity infrastructure. Interestingly, the volume is more concentrated in incentive-driven liquidity mining and active capital optimization activities rather than pure trading demand.

2. Leverage & Capital Efficiency (Lending + Flash Loans)

  • Flash Loans (Borrow & Repay): $1.3 trillion—Automated arbitrage and liquidation loops.
  • Lending Activities (Deposit, Lend, Repay, Withdraw): $137 billion—Represents the on-chain short-term capital efficiency and structured credit layer.

3. On/Off Ramps (CEX & Bridges)

  • CEX Flows—Deposits ($224 billion), Withdrawals ($224 billion), Internal Transfers ($151 billion): Total $599 billion.
  • Bridge Deposits/Withdrawals: $28 billion—Shows the function of stablecoins as settlement channels between cross-chain and centralized platforms.

4. Issuance Layer (Monetary Operations)

  • Issuer Operations—Minting ($28 billion), Burning ($20 billion), Peg Rebalancing ($23 billion), and other operations: Total $106 billion, nearly 5 times the $42 billion from a year ago.

5. Yield Protocols

  • Yield Protocol Activity: $2.7 billion—Small in scale, but significant in structured strategies and on-chain asset management.

Overall, 90% of the transfer volume flows through identified activity categories, providing us with a fine-grained view across all layers of the entire on-chain stack.

Velocity: Same Coin, Different Worlds

Daily Velocity (Volume divided by Supply) is perhaps the most overlooked metric in stablecoin analysis. It reveals whether a stablecoin is actively used as a medium of exchange or merely held.

Among the tokens we analyzed, USDC and USDT stand out again, but exhibit different characteristics.
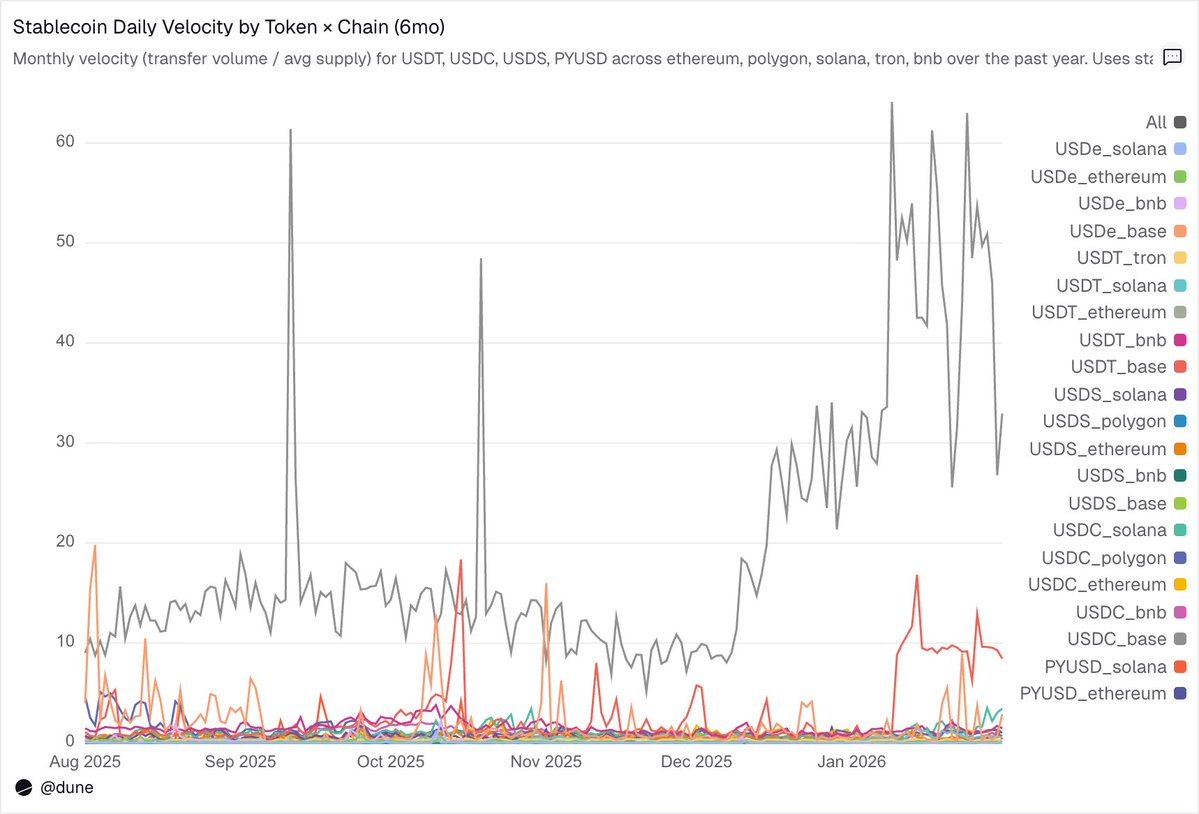
USDC circulates fastest on L2 and Solana. On Base, USDC's average daily velocity reaches an astonishing 14x—driven by high-frequency DeFi activity; on Solana and Polygon, it's about 1x; on Ethereum, it also reaches 0.9x, meaning almost the entire supply turns over nearly every day.

USDT is fastest on BNB Chain and Tron. It reaches 1.4x on BNB Chain, reflecting active trading; on Tron, it's 0.3x, with lower volume but exceptionally stable transaction volume, consistent with its role as a main channel for cross-border payments. On Ethereum, however, USDT is only 0.2x, with over $100 billion of supply mostly sitting idle.

USDe and USDS are slower, but by design. USDe's average daily velocity on Ethereum is only 0.09x; USDS is 0.5x. Both are yield-bearing stablecoins: USDe is often staked as sUSDe to capture收益 from Ethena's delta-neutral strategy; USDS is deposited into Sky's savings rate mechanism to obtain protocol-subsidized yields. Therefore, a large portion of the supply remains in savings contracts, lending markets like Aave, or structured yield loops. Low velocity here is not a flaw but a feature—these assets are designed to accumulate yield, not to circulate frequently.

Chain differences are more important than the token itself. The same PYUSD has a daily velocity of 0.6x on Solana, four times its velocity on Ethereum (0.1x). The same token exhibits completely different usage patterns in different ecosystems.

Supply and transfer volume each tell part of the story, while velocity connects the two—it reveals whether a stablecoin on a particular chain is active infrastructure or sleeping capital.


Criptos en tendencia

Preguntas relacionadas

QWhat is the main argument of the article regarding stablecoin analysis beyond total supply?

AThe article argues that while total supply is a commonly cited metric, a more granular analysis focusing on who holds the stablecoins, their concentration, on-chain velocity, and specific usage categories provides a more dynamic and accurate picture of how capital is migrating, settling, leveraging, and being repriced on-chain.

QAccording to the Dune dataset, which two stablecoins dominate the market share and what percentage do they hold?

ATether's USDT ($197B) and Circle's USDC ($73B) dominate the market, holding a combined 89% market share of the top 15 stablecoins.

QHow does the holding concentration differ between major stablecoins like USDT/USDC and newer challengers?

AMajor stablecoins like USDT and USDC are widely distributed, with the top 10 wallets holding only 23-26% of the supply. In contrast, newer challengers are extremely concentrated, with the top 10 wallets often holding 60% to 99% of the supply (e.g., 90% for USDS, 99% for USDF and USD0).

QWhat was the total value of stablecoin transfers in January 2026, and which chain facilitated the highest volume despite having a smaller supply?

AThe total value of stablecoin transfers in January 2026 was $10.3 trillion. The Base chain facilitated the highest volume at $5.9 trillion, despite having a supply of only $4.4 billion.

QWhat does the daily velocity metric reveal about the usage of USDC on Base compared to USDT on Ethereum?

AThe daily velocity metric shows that USDC on Base is extremely active with a velocity of 14x, driven by high-frequency DeFi activity. In contrast, USDT on Ethereum has a much lower velocity of 0.2x, indicating that over $100 billion of its supply is largely idle.

Lecturas Relacionadas

Must-Watch Events Next Week|CLARITY Act Could Face Senate Vote; SpaceX, Circle to Report Earnings (8.3-8.9)

**Summary: Key Events and Developments to Watch (August 3-9)** The upcoming week is marked by significant financial disclosures, key legislative deadlines, and notable product updates. **Major Financial Events:** Several companies are scheduled to release their Q2 2026 earnings. American Bitcoin (ABTC) will report on August 3, followed by SpaceX and Hut 8 Mining Corp. on August 4, and Circle on August 5. Notably, a significant portion of SpaceX shares (up to 12% of total shares) will be unlocked on August 6 following their earnings release. **Key Legislative Deadline:** The U.S. Senate faces an August 7 deadline to secure 60 votes for the CLARITY Act, a bipartisan bill aiming to establish a federal regulatory framework for cryptocurrencies. The Senate may hold a full vote on the bill during the week. **Economic Data:** The U.S. July Non-Farm Payrolls report will be released on August 7, providing crucial labor market data. **Technology & Product Updates:** * **Shutdowns:** DeFi portfolio tracker Zapper and wallet app Ctrl Wallet will cease operations on August 3. * **Upgrades:** LayerZero will deprecate its v1 relayers on August 3. XRP Ledger's new version 3.3.0, featuring five new functions, is expected next week. * **AI:** Elon Musk announced that the advanced Grok 4.6 AI model is set for release around August 7. * **Bitcoin:** The BIP-110 forced signaling for a potential Bitcoin network change is scheduled to begin around August 8. **Other Notable Events:** Chinese robotics firm Unitree Tech has set its preliminary price inquiry for its IPO for August 5. South Korean exchange Upbit will delist AQT and AERGO tokens on August 3.

marsbitHace 45 min(s)

Must-Watch Events Next Week|CLARITY Act Could Face Senate Vote; SpaceX, Circle to Report Earnings (8.3-8.9)

marsbitHace 45 min(s)

Stocks Are Plummeting More Sharply Than Cryptocurrencies. Where Has the Money Gone?

Stock Markets Plunge Deeper Than Cryptocurrencies: Where Did the Money Go? In late July, Seoul's Kospi index triggered circuit breakers for two consecutive days, plummeting over 40% from its June high. The collapse was led by heavyweight stocks like SK Hynix, whose record profits still disappointed investors, and devastating leveraged ETFs, with one major product losing over 83% of its value. This signaled a global, forced deleveraging targeting the most crowded trades. Interestingly, while stocks exhibited extreme volatility akin to crypto markets, Bitcoin rose nearly 15% in July after a prior steep drop. Analysis shows the money fleeing equities did not flow into Bitcoin. Instead, Bitcoin had already absorbed its sell-off in May-June, when U.S. spot Bitcoin ETFs saw historic outflows. The true safe-haven beneficiary was gold, whose price rose over 20% year-on-year, highlighting a decoupling between Bitcoin and gold as "digital gold." The sell-off was a targeted unwinding of leveraged positions in tech and semiconductors, accelerated by broker-dealer risk management and shifts in the AI narrative, including new competition from Chinese memory chipmakers. The retreat path was clear: from high-valuation tech stocks to cash and U.S. Treasuries, then to gold. For Bitcoin to attract sustained institutional inflows, conditions like eased global liquidity pressure, a "soft-landing" Fed rate cut, and U.S. regulatory clarity via legislation like the stalled CLARITY Act are needed. Currently, Bitcoin is not a safe haven but an already-cleared asset. Its low correlation with tech stocks, however, makes it a potential diversification play for institutional portfolios once the storm passes. The money isn't here yet, but the positioning is underway.

marsbitHace 45 min(s)

Stocks Are Plummeting More Sharply Than Cryptocurrencies. Where Has the Money Gone?

marsbitHace 45 min(s)

In Conversation with Ray Dalio: We Are Currently in an AI Bubble, with 1% of My Portfolio in Bitcoin

Ray Dalio, founder of Bridgewater Associates, warns in an interview that the current AI boom shows classic bubble characteristics, which could lead to significant economic downturns as seen in past cycles like 1929 or 2000. He explains that speculative enthusiasm, fueled by debt and overvaluation, often precedes a crash when rising rates or taxation force asset sales, causing widespread losses and recession. Dalio also outlines his "Big Cycle" theory, describing an approximate 80-year pattern where widening wealth gaps, massive government deficits, and shifting geopolitical power (like China's rise) create internal conflict and global instability. He emphasizes that we are in a late-cycle, transitional phase where traditional powers like the US and UK face decline. For personal wealth protection, Dalio advises diversification beyond cash into assets like stocks, bonds, real estate, and particularly gold, which he prefers over Bitcoin. While he holds about 1% of his portfolio in Bitcoin as a non-printable hard asset, he views gold as more secure from technological or governmental threats. Regarding AI's impact, Dalio believes it will disproportionately benefit capital owners, worsening inequality by replacing both physical and cognitive labor. He suggests that human intuition and emotional intelligence, combined with AI, will be key for future workers. On taxation, Dalio argues that wealth taxes are impractical and risk triggering asset sell-offs, reducing productive investment. He points to the UK as a cautionary example of debt, low productivity, and political strife. Geopolitically, Dalio foresees a more regionalized world, with the US showing weakness in prolonged conflicts like with Iran, akin to past imperial declines. The ideal outcome, he suggests, is coexisting powerful blocs (e.g., Americas, China-Asia Pacific) without major war.

marsbitHace 4 hora(s)

In Conversation with Ray Dalio: We Are Currently in an AI Bubble, with 1% of My Portfolio in Bitcoin

marsbitHace 4 hora(s)

Daily 7.2 Trillion KRW: Foreign Capital's Record Net Buying on Friday! Wall Street Says Headwinds for Korean Stock Fund Flows Have Subsided

South Korean stock market sees a dramatic shift in fund flows. On July 31, foreign investors made a record net purchase of approximately KRW 7.2 trillion in KOSPI stocks, marking a fundamental reversal from the persistent large-scale net outflows seen in previous months. This contributed to a significant narrowing of foreign net selling in July to KRW 9.8 trillion, down sharply from KRW 48.4 trillion in June and KRW 44.5 trillion in May. Simultaneously, domestic institutional pressure eased. South Korean pension funds and asset managers turned to a net buying position in July, purchasing KRW 1.0 trillion worth of KOSPI shares, contrasting with net sales in May and June. Market volatility is expected to be dampened by new financial regulations. Effective July 31, the Financial Services Commission tightened access for retail investors to single-stock leveraged ETFs by raising the minimum cash deposit requirement. Trading volumes for these products subsequently dropped to about 50% of their monthly average. Citigroup Research maintains its year-end KOSPI target of 10,000 points. The firm cites several supportive factors: the substantial easing of headwinds from capital outflows, a robust fundamental outlook for the semiconductor sector, historically low market valuations, strong economic fundamentals, and the potential for policy support from financial authorities if needed.

marsbitHace 4 hora(s)

Daily 7.2 Trillion KRW: Foreign Capital's Record Net Buying on Friday! Wall Street Says Headwinds for Korean Stock Fund Flows Have Subsided

marsbitHace 4 hora(s)

Trading

Spot

Artículos destacados

Cómo comprar FLOW

¡Bienvenido a HTX.com! Hemos hecho que comprar Flow (FLOW) sea simple y conveniente. Sigue nuestra guía paso a paso para iniciar tu viaje de criptos.Paso 1: crea tu cuenta HTXUtiliza tu correo electrónico o número de teléfono para registrarte y obtener una cuenta gratuita en HTX. Experimenta un proceso de registro sin complicaciones y desbloquea todas las funciones.Obtener mi cuentaPaso 2: ve a Comprar cripto y elige tu método de pagoTarjeta de crédito/débito: usa tu Visa o Mastercard para comprar Flow (FLOW) al instante.Saldo: utiliza fondos del saldo de tu cuenta HTX para tradear sin problemas.Terceros: hemos agregado métodos de pago populares como Google Pay y Apple Pay para mejorar la comodidad.P2P: tradear directamente con otros usuarios en HTX.Over-the-Counter (OTC): ofrecemos servicios personalizados y tipos de cambio competitivos para los traders.Paso 3: guarda tu Flow (FLOW)Después de comprar tu Flow (FLOW), guárdalo en tu cuenta HTX. Alternativamente, puedes enviarlo a otro lugar mediante transferencia blockchain o utilizarlo para tradear otras criptomonedas.Paso 4: tradear Flow (FLOW)Tradear fácilmente con Flow (FLOW) en HTX's mercado spot. Simplemente accede a tu cuenta, selecciona tu par de trading, ejecuta tus trades y monitorea en tiempo real. Ofrecemos una experiencia fácil de usar tanto para principiantes como para traders experimentados.

287 Vistas totalesPublicado en 2024.12.10Actualizado en 2026.06.02

Cómo comprar FLOW

Discusiones

Bienvenido a la comunidad de HTX. Aquí puedes mantenerte informado sobre los últimos desarrollos de la plataforma y acceder a análisis profesionales del mercado. A continuación se presentan las opiniones de los usuarios sobre el precio de FLOW (FLOW).

活动图片












