Introducing: Taker-Flow-Based Gamma Exposure

insights.glassnodePublicado a 2025-12-18Actualizado a 2025-12-18

Resumen

This article introduces a Taker-Flow-Based Gamma Exposure (GEX) model specifically designed for crypto options markets. Unlike traditional equity markets, crypto options have different participant behaviors and data availability, making classic GEX heuristics inaccurate. The new methodology leverages the unique transparency of crypto exchanges, where the taker of each trade is identifiable, to reconstruct actual dealer positioning by mirroring cumulative taker flows. This flow-based approach provides a realistic, net view of dealer gamma exposure across strikes and maturities. The resulting GEX metric helps identify price zones where dealer hedging flows are likely to stabilize (positive gamma) or destabilize (negative gamma) the market, offering traders a map to anticipate volatility regimes and potential pinning effects. The model is available for major cryptocurrencies on Deribit.

In options markets, dealer hedging flows play a central role in shaping short-term price behavior. Gamma Exposure (GEX) is used to identify where those hedging flows are likely to stabilize price action and where they may amplify moves. While GEX is well established in equity and index options, applying it directly to crypto markets is problematic.

Crypto options differ materially in participant behavior, trade motivation, and data availability. To account for this, we reconstruct a flow-based GEX measure tailored to crypto options markets, designed to recover how dealer positioning evolves across strikes and maturities. We show how this framework can be used to interpret volatility regimes and identify price zones where dealer hedging may meaningfully influence market dynamics.

What is Gamma Exposure and Why it Matters

Gamma Exposure (GEX) measures how options market-makers’ hedging flows react to movements in the underlying asset.

Market makers, who typically maintain delta-neutral positions, must continuously hedge their gamma exposure by buying or selling futures or spot to offset the delta of the options they’ve sold or bought. When price moves, option deltas change (that is gamma), forcing dealers to rebalance. These rebalancing flows create structural feedback loops in the market and are a source of some of the most significant mechanically driven flows observed in the equity markets.

At the core of this dynamic, the taker is the end user — a trader or investor buying or selling options, while the dealer (or market-maker) is the counterparty providing liquidity. Their positions are mirror images of each other: when the taker buys a call, the dealer sells it.

Why is GEX useful?

  • At price levels with high positive gamma, dealers hedge in a way that tends to absorb price shocks. They typically buy on dips and sell on rallies, which dampens volatility and can keep price pinned near certain strikes: a phenomenon often described “gamma gravity” or “pinning”.
  • At price levels with high negative gamma, dealer hedging flows work in the opposite direction and amplify price moves. Dealers sell as prices fall and buy as prices rise, often increasing short-term volatility.

In short, GEX highlights where dealer hedging is likely to stabilize or destabilize the market, turning the options surface into a map of potential volatility regimes rather than a passive snapshot of positioning.

TradFi Origins: Gamma Exposure Calculation in Traditional Finance

Gamma exposure metrics originated in equity and index options markets (for example, SPX). The classic construction is:

Where:

  • OI is open interest at that strike
  • Γ is option gamma
  • S is the underlying spot price
  • sign_dealer is the assumed sign of the dealer position (long or short)

Because traditional equity datasets do not label who is the taker on a trade, this framework relies on a simple heuristic about who typically holds which side of the options market:

  • Call options are sold by investors and bought by dealers
  • Put options are bought by investors and sold by dealers

In the classic equity context, investors typically write calls for yield enhancement and use puts as downside insurance.

Why the Equity Heuristic Fails in Crypto

In crypto options, the equity-style assumptions break down. A large share of participants actively buy calls to speculate on upside, rather than systematically selling them for yield. Meanwhile, puts are frequently traded tactically rather than used purely as hedges for long-only portfolios. If we continue to assume “calls = investor short, dealer long” and “puts = investor long, dealer short,” we construct a dealer profile that does not reflect actual positioning.

There is a second, more subtle issue. The classical approach treats open interest at each strike as a single block position with one sign. In practice, a strike’s OI is built from both buying and selling flows. A simple case where 50% of OI came from takers buying (dealers short) and 50% from takers selling (dealers long), the net dealer exposure is close to zero — yet the heuristic would still report a large exposure. Instead, what we actually want is:

  • A realistic sign of dealer positioning (long vs short);
  • A realistic net size of that position after netting out opposing flows.

A Flow-First Approach to Gamma Exposure (GEX) in Crypto

Unlike traditional equity markets, crypto options venues expose who is the taker on each trade. For every transaction, we can observe whether the taker bought or sold a call or a put. We then make a clear modeling assumption: the maker on the other side of the trade is a dealer providing liquidity.

This allows us to treat the taker as the end user and infer dealer positioning as the mirror image of cumulative taker flow, strike by strike and maturity by maturity. Over time, this builds a realistic picture of how dealers are positioned across the volatility surface.

On this foundation, we build a methodology that tracks dealer inventory through time and translate that inventory into gamma exposure using option greeks and spot price. The result is a structural GEX measure anchored in actual trading flow, rather than static heuristics. A full description of this process is provided in the Appendix at the end.

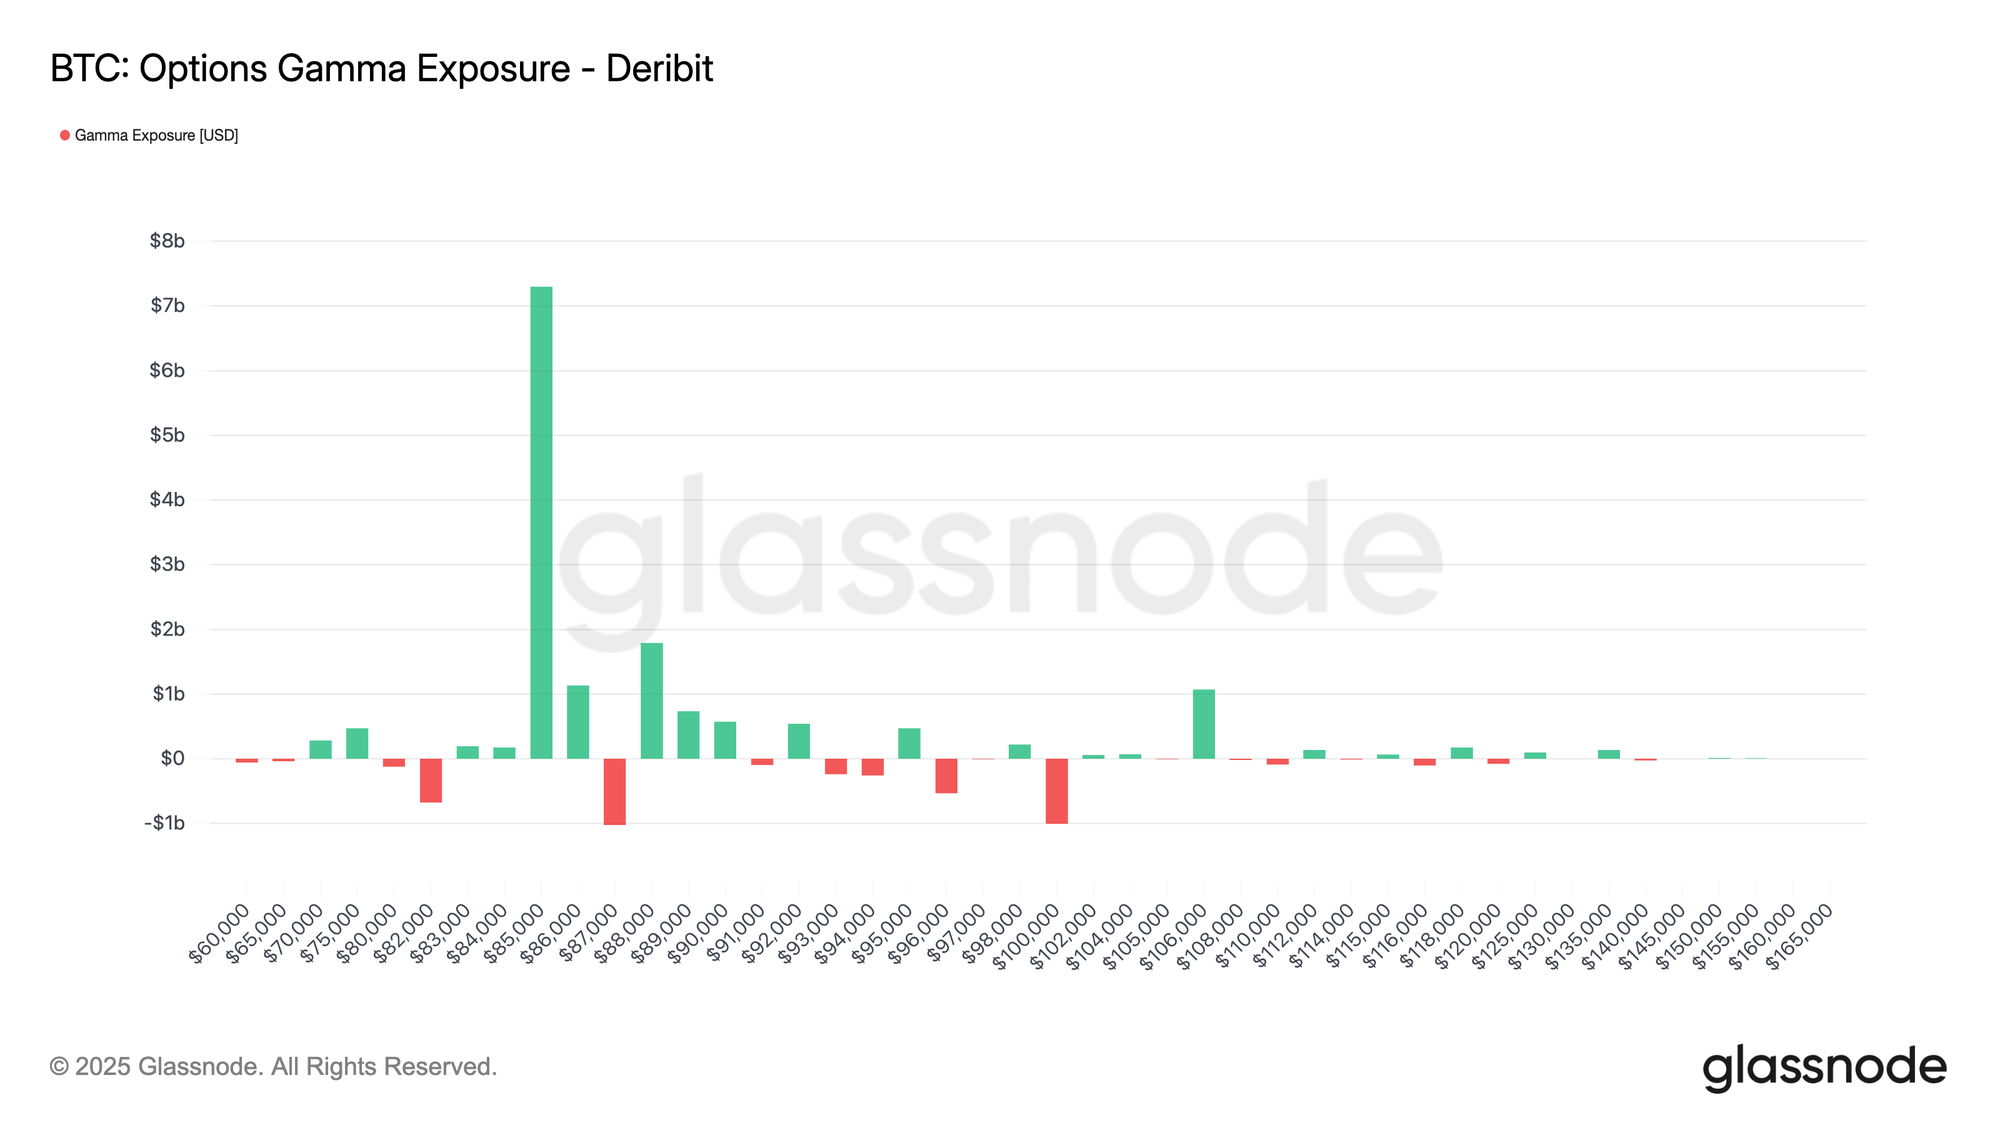
The chart below shows BTC options gamma exposure across strike prices on Deribit. Each bar represents the net gamma exposure (in USD) concentrated at that strike: green indicates positive exposure, red indicates negative exposure. The distribution shows a dominant positive gamma cluster around ~$86k–$87k, with smaller pockets of negative exposure around ~$83k and ~$101k.
View live chart

Metric Interpretation

Gamma exposure helps map where hedging flows may impact price action. Large positive GEX near ~$85k–$86k suggests a zone where dealer hedging is likely to be mean-reverting (buying dips and selling rallies), contributing to pinning or slower price movement around those strikes. By contrast, negative GEX pockets mark areas where hedging becomes momentum-reinforcing (selling into weakness / buying into strength), increasing the likelihood of faster, more directional moves if spot trades into them.

Available for:

  • Resolution: 10-minute
  • Assets: BTC, ETH, SOL, XRP, PAXG
  • Exchanges: Deribit

Trading Use-Cases: How to Use GEX in Practice

From a trading perspective, GEX turns the options surface into a map of where dealer flows are likely to amplify or dampen price moves.

Identifying “sticky” vs “slippery” price zones

  • High positive GEX near spot: When GEX is strongly positive around a band of strikes near spot, dealers are long gamma in that zone. As the market trades inside this band, their hedging flows tend to buy on dips and sell into rallies, which creates a pinning effect: moves fade, breakouts struggle, and realized volatility often comes in below implied. This is typically a mean-reverting, “sticky” regime, where short-gamma carry trades can work if volatility indeed remains contained.
  • High negative GEX near or below spot: When GEX is strongly negative around or just below spot, the opposite holds: dealers are short gamma, so as spot trades into that region, hedging flows sell into weakness and buy into strength. Instead of dampening moves, they amplify them. Price action becomes more “slippery”: intraday swings can expand, order books can feel thinner, and liquidations or squeezes become more likely. In that environment, traders often respond with lower leverage, wider stops, and more respect for momentum.

Watching for gamma flips

A particularly important dynamic is the gamma flip, when net GEX around spot changes sign. For example, if price exits a positive-gamma zone and moves into a pocket of negative gamma below, the market can transition from a pinned, mean-reverting regime to one where moves begin to reinforce themselves.


Appendix – Our Methodology: Taker-Flow-Based GEX

We construct Gamma Exposure on a 10-minute grid per asset, exchange, strike K, maturity M. The key idea is to reconstruct the dealer inventory over time from taker flows, and then translate that inventory into gamma exposure using option greeks.

We define the net taker flow in contracts over each 10-minute interval:

Under the assumption that dealers are primarily on the passive side, the dealer flow is simply the mirror image of taker flow:

We then cumulate these flows over time to obtain a dealer inventory in number of contracts. For calls, this is:

and analogously for puts:

Here Δt is the 10-minute step. Positive inventory values correspond to dealers being net long contracts at that strike and maturity; negative values correspond to net short.

To translate this inventory into gamma exposure, we combine it with option greeks and the underlying price. Let m denote the contract multiplier (e.g. BTC per contract), and S the spot price at time t. For each bucket we define the notional exposure:

Using the option gammas Γcall(K,M,t) and Γput(K,M,t) from our options chain, the gamma exposure of each leg is:


Γcall(K,M,t) is the gamma of the call option at that strike and maturity. This tells you how quickly the option’s delta changes when the underlying price moves.

And then total gamma exposure at that strike/maturity is just:

Criptos en tendencia

Preguntas relacionadas

QWhat is Gamma Exposure (GEX) and why is it important in options markets?

AGamma Exposure (GEX) measures how options market-makers' hedging flows react to movements in the underlying asset. It is important because dealer hedging flows can either stabilize or amplify price moves. High positive gamma tends to dampen volatility and create 'pinning' effects, while high negative gamma amplifies price moves and increases short-term volatility.

QWhy does the traditional equity-based GEX calculation method fail in crypto options markets?

AThe equity-based method fails because crypto options have different participant behaviors and trade motivations. In crypto, participants often buy calls for speculation rather than selling them for yield, and puts are traded tactically rather than purely as hedges. Additionally, the equity heuristic treats open interest as a single block position rather than accounting for both buying and selling flows that net out dealer exposure.

QHow does the taker-flow-based approach to GEX work in crypto markets?

AThe taker-flow-based approach uses trade-level data to identify whether the taker bought or sold options, assuming the maker is a dealer. It cumulatively tracks dealer inventory across strikes and maturities by mirroring taker flows. This inventory is then combined with option greeks and spot price to calculate gamma exposure, providing a more accurate measure based on actual trading activity rather than static heuristics.

QWhat are the practical trading use-cases for GEX in identifying market regimes?

AGEX helps identify 'sticky' zones with high positive gamma where dealer hedging dampens volatility and pins price near certain strikes, and 'slippery' zones with high negative gamma where hedging amplifies moves and increases volatility. It also helps watch for 'gamma flips' where the market transitions from mean-reverting to momentum-driven regimes as spot price moves between gamma zones.

QWhich assets and exchanges are covered by the taker-flow-based GEX methodology described?

AThe methodology covers BTC, ETH, SOL, XRP, and PAXG on the Deribit exchange, with data available at a 10-minute resolution.

Lecturas Relacionadas

10,000 Scientists Get 1 Year of Free Access: OpenAI Brings the Scientific Research Pipeline into ChatGPT

OpenAI has launched the "ChatGPT for Academic Researchers" program, offering free one-year access to its flagship models for 100,000 university researchers globally, with 10,000 spots available this summer. Selected institutions include prestigious centers like ENS Paris and the IAS at Princeton. The initiative provides an integrated research workspace within ChatGPT, bundling tools like ChatGPT, ChatGPT Work, and Codex, along with expanded Deep Research capabilities, higher usage limits, and specialized tools for life sciences. The suite connects to platforms like Zotero and GitHub, aiming to streamline the entire research workflow from literature review and coding to data analysis and manuscript drafting. OpenAI notes that about 1.3 million people already use ChatGPT weekly for advanced science and math. The program targets building long-term user dependency by embedding these tools into daily research habits. However, access comes with limitations: it does not include API credits or model weights, and eligibility is restricted to verified academic researchers from supported countries. This approach contrasts with Anthropic's "AI for Science" program, which offers API credits but not an integrated workspace. Both companies emphasize preventing misuse by withholding model weights, a point of contention for AI researchers seeking transparency. The core strategy remains clear: provide a powerful, integrated environment to foster user reliance ahead of the post-free period.

marsbitHace 3 min(s)

10,000 Scientists Get 1 Year of Free Access: OpenAI Brings the Scientific Research Pipeline into ChatGPT

marsbitHace 3 min(s)

What's Going On with Gigadevice? Major Shareholder Cashes Out 44 Billion, Then Announces 20 Billion Buyback

Gigadevice Innovation, a leading Chinese memory chip company, has executed a controversial financial maneuver. The company's controlling shareholder and chairman, Zhu Yiming, sold approximately 44 billion RMB worth of his shares between early May and mid-June 2026, capitalizing on a soaring stock price that peaked at 846.66 RMB on June 29th. Following a subsequent stock crash—plummeting to around 350 RMB in 22 trading days and erasing over 330 billion RMB in market value—Zhu announced a combined "market rescue" plan on July 29th. This plan includes his personal commitment to buy back at least 1 billion RMB in shares and a company proposal to repurchase 1 to 2 billion RMB worth of stock. This sequence of high-selling followed by a low-buying plan has confused and unsettled many of the company's 240,000 retail investors. The stock's dramatic decline was attributed to several factors: the successful IPO of its sister company, Changxin Technologies, which ended Gigadevice's status as a primary investment proxy for the domestic memory sector; a Morgan Stanley report warning of a potential peak in the memory chip cycle; and a severe loss of market confidence triggered by the chairman's massive sell-off. While the sell-off was procedurally compliant, its timing has been criticized. The company's fundamentals appear strong, with preliminary H1 2026 results showing revenue up 177% year-on-year to 11.5 billion RMB and net profit skyrocketing 1099% to 6.9 billion RMB, driven by a boom in memory chips and MCU demand. However, a significant portion (2.05 billion RMB) of this profit came from non-recurring gains like securities investment, and the memory industry is notoriously cyclical. Analysts highlight the company's role in the domestic substitution of niche DRAM and NOR Flash memory, with some maintaining bullish price targets. Yet, the recent events underscore key risks: its fabless model creates dependency on foundries like Changxin, and the chairman's actions have raised serious questions about management's alignment with minority shareholders. The promised buybacks cannot commence until December 13th due to a mandatory six-month cooling-off period following an insider sale, leaving the stock vulnerable in the interim.

marsbitHace 3 min(s)

What's Going On with Gigadevice? Major Shareholder Cashes Out 44 Billion, Then Announces 20 Billion Buyback

marsbitHace 3 min(s)

Pi Network Price Forecast for August 2026: Will the August 11th Deadline Become a Catalyst for PI's Recovery?

Pi Network Price Forecast for August 2026: Will the August 11 Deadline Catalyze a Recovery? Pi Network (PI) traded at $0.0830 on July 30, up 1.13%, attempting to stabilize above its all-time low. The price is rebounding from the lower Bollinger Band around $0.07172. All key EMAs (20, 50, 100, 200-day) remain in a downtrend above the current price, with the 20-day EMA at $0.08810 acting as the first significant resistance level to confirm a recovery. August presents two key narratives. First, the Pi Core Team launched Protocol 26 with a hard deadline of August 11 for all node operators to upgrade; failure to do so results in disconnection. This is the final precursor to Protocol 27, a major technical upgrade planned for 2026. Second, a community debate challenges the widespread "GCV" (Global Consensus Value) concept, with a member stating there is no official GCV mechanism and that Mainnet apps price services independently. This could pressure price if holders selling on disillusionment. The 10-day price forecast table suggests a range of $0.072-$0.095 for early August amid Protocol 26 deadline pressure, $0.080-$0.110 in mid-August post-deadline clarity, and $0.085-$0.125 in late August, pending broader crypto market direction. The bullish case requires smooth Protocol 26 migration, clear Protocol 27 announcement, resolution of the GCV debate without major holder exits, and a close above the 20-day EMA. The bearish scenario involves node upgrade difficulties, GCV-related selling pressure, continued supply pressure from 775.8 million PI scheduled to unlock by December, and a fall back to or below the $0.07172 support zone.

cryptonews.ruHace 27 min(s)

Pi Network Price Forecast for August 2026: Will the August 11th Deadline Become a Catalyst for PI's Recovery?

cryptonews.ruHace 27 min(s)

Trading

Spot

Artículos destacados

Cómo comprar FLOW

¡Bienvenido a HTX.com! Hemos hecho que comprar Flow (FLOW) sea simple y conveniente. Sigue nuestra guía paso a paso para iniciar tu viaje de criptos.Paso 1: crea tu cuenta HTXUtiliza tu correo electrónico o número de teléfono para registrarte y obtener una cuenta gratuita en HTX. Experimenta un proceso de registro sin complicaciones y desbloquea todas las funciones.Obtener mi cuentaPaso 2: ve a Comprar cripto y elige tu método de pagoTarjeta de crédito/débito: usa tu Visa o Mastercard para comprar Flow (FLOW) al instante.Saldo: utiliza fondos del saldo de tu cuenta HTX para tradear sin problemas.Terceros: hemos agregado métodos de pago populares como Google Pay y Apple Pay para mejorar la comodidad.P2P: tradear directamente con otros usuarios en HTX.Over-the-Counter (OTC): ofrecemos servicios personalizados y tipos de cambio competitivos para los traders.Paso 3: guarda tu Flow (FLOW)Después de comprar tu Flow (FLOW), guárdalo en tu cuenta HTX. Alternativamente, puedes enviarlo a otro lugar mediante transferencia blockchain o utilizarlo para tradear otras criptomonedas.Paso 4: tradear Flow (FLOW)Tradear fácilmente con Flow (FLOW) en HTX's mercado spot. Simplemente accede a tu cuenta, selecciona tu par de trading, ejecuta tus trades y monitorea en tiempo real. Ofrecemos una experiencia fácil de usar tanto para principiantes como para traders experimentados.

280 Vistas totalesPublicado en 2024.12.10Actualizado en 2026.06.02

Cómo comprar FLOW

Discusiones

Bienvenido a la comunidad de HTX. Aquí puedes mantenerte informado sobre los últimos desarrollos de la plataforma y acceder a análisis profesionales del mercado. A continuación se presentan las opiniones de los usuarios sobre el precio de FLOW (FLOW).

活动图片