Introducing: Taker-Flow-Based Gamma Exposure

insights.glassnodePublicado a 2025-12-18Actualizado a 2025-12-18

Resumen

This article introduces a Taker-Flow-Based Gamma Exposure (GEX) model specifically designed for crypto options markets. Unlike traditional equity markets, crypto options have different participant behaviors and data availability, making classic GEX heuristics inaccurate. The new methodology leverages the unique transparency of crypto exchanges, where the taker of each trade is identifiable, to reconstruct actual dealer positioning by mirroring cumulative taker flows. This flow-based approach provides a realistic, net view of dealer gamma exposure across strikes and maturities. The resulting GEX metric helps identify price zones where dealer hedging flows are likely to stabilize (positive gamma) or destabilize (negative gamma) the market, offering traders a map to anticipate volatility regimes and potential pinning effects. The model is available for major cryptocurrencies on Deribit.

In options markets, dealer hedging flows play a central role in shaping short-term price behavior. Gamma Exposure (GEX) is used to identify where those hedging flows are likely to stabilize price action and where they may amplify moves. While GEX is well established in equity and index options, applying it directly to crypto markets is problematic.

Crypto options differ materially in participant behavior, trade motivation, and data availability. To account for this, we reconstruct a flow-based GEX measure tailored to crypto options markets, designed to recover how dealer positioning evolves across strikes and maturities. We show how this framework can be used to interpret volatility regimes and identify price zones where dealer hedging may meaningfully influence market dynamics.

What is Gamma Exposure and Why it Matters

Gamma Exposure (GEX) measures how options market-makers’ hedging flows react to movements in the underlying asset.

Market makers, who typically maintain delta-neutral positions, must continuously hedge their gamma exposure by buying or selling futures or spot to offset the delta of the options they’ve sold or bought. When price moves, option deltas change (that is gamma), forcing dealers to rebalance. These rebalancing flows create structural feedback loops in the market and are a source of some of the most significant mechanically driven flows observed in the equity markets.

At the core of this dynamic, the taker is the end user — a trader or investor buying or selling options, while the dealer (or market-maker) is the counterparty providing liquidity. Their positions are mirror images of each other: when the taker buys a call, the dealer sells it.

Why is GEX useful?

  • At price levels with high positive gamma, dealers hedge in a way that tends to absorb price shocks. They typically buy on dips and sell on rallies, which dampens volatility and can keep price pinned near certain strikes: a phenomenon often described “gamma gravity” or “pinning”.
  • At price levels with high negative gamma, dealer hedging flows work in the opposite direction and amplify price moves. Dealers sell as prices fall and buy as prices rise, often increasing short-term volatility.

In short, GEX highlights where dealer hedging is likely to stabilize or destabilize the market, turning the options surface into a map of potential volatility regimes rather than a passive snapshot of positioning.

TradFi Origins: Gamma Exposure Calculation in Traditional Finance

Gamma exposure metrics originated in equity and index options markets (for example, SPX). The classic construction is:

Where:

  • OI is open interest at that strike
  • Γ is option gamma
  • S is the underlying spot price
  • sign_dealer is the assumed sign of the dealer position (long or short)

Because traditional equity datasets do not label who is the taker on a trade, this framework relies on a simple heuristic about who typically holds which side of the options market:

  • Call options are sold by investors and bought by dealers
  • Put options are bought by investors and sold by dealers

In the classic equity context, investors typically write calls for yield enhancement and use puts as downside insurance.

Why the Equity Heuristic Fails in Crypto

In crypto options, the equity-style assumptions break down. A large share of participants actively buy calls to speculate on upside, rather than systematically selling them for yield. Meanwhile, puts are frequently traded tactically rather than used purely as hedges for long-only portfolios. If we continue to assume “calls = investor short, dealer long” and “puts = investor long, dealer short,” we construct a dealer profile that does not reflect actual positioning.

There is a second, more subtle issue. The classical approach treats open interest at each strike as a single block position with one sign. In practice, a strike’s OI is built from both buying and selling flows. A simple case where 50% of OI came from takers buying (dealers short) and 50% from takers selling (dealers long), the net dealer exposure is close to zero — yet the heuristic would still report a large exposure. Instead, what we actually want is:

  • A realistic sign of dealer positioning (long vs short);
  • A realistic net size of that position after netting out opposing flows.

A Flow-First Approach to Gamma Exposure (GEX) in Crypto

Unlike traditional equity markets, crypto options venues expose who is the taker on each trade. For every transaction, we can observe whether the taker bought or sold a call or a put. We then make a clear modeling assumption: the maker on the other side of the trade is a dealer providing liquidity.

This allows us to treat the taker as the end user and infer dealer positioning as the mirror image of cumulative taker flow, strike by strike and maturity by maturity. Over time, this builds a realistic picture of how dealers are positioned across the volatility surface.

On this foundation, we build a methodology that tracks dealer inventory through time and translate that inventory into gamma exposure using option greeks and spot price. The result is a structural GEX measure anchored in actual trading flow, rather than static heuristics. A full description of this process is provided in the Appendix at the end.

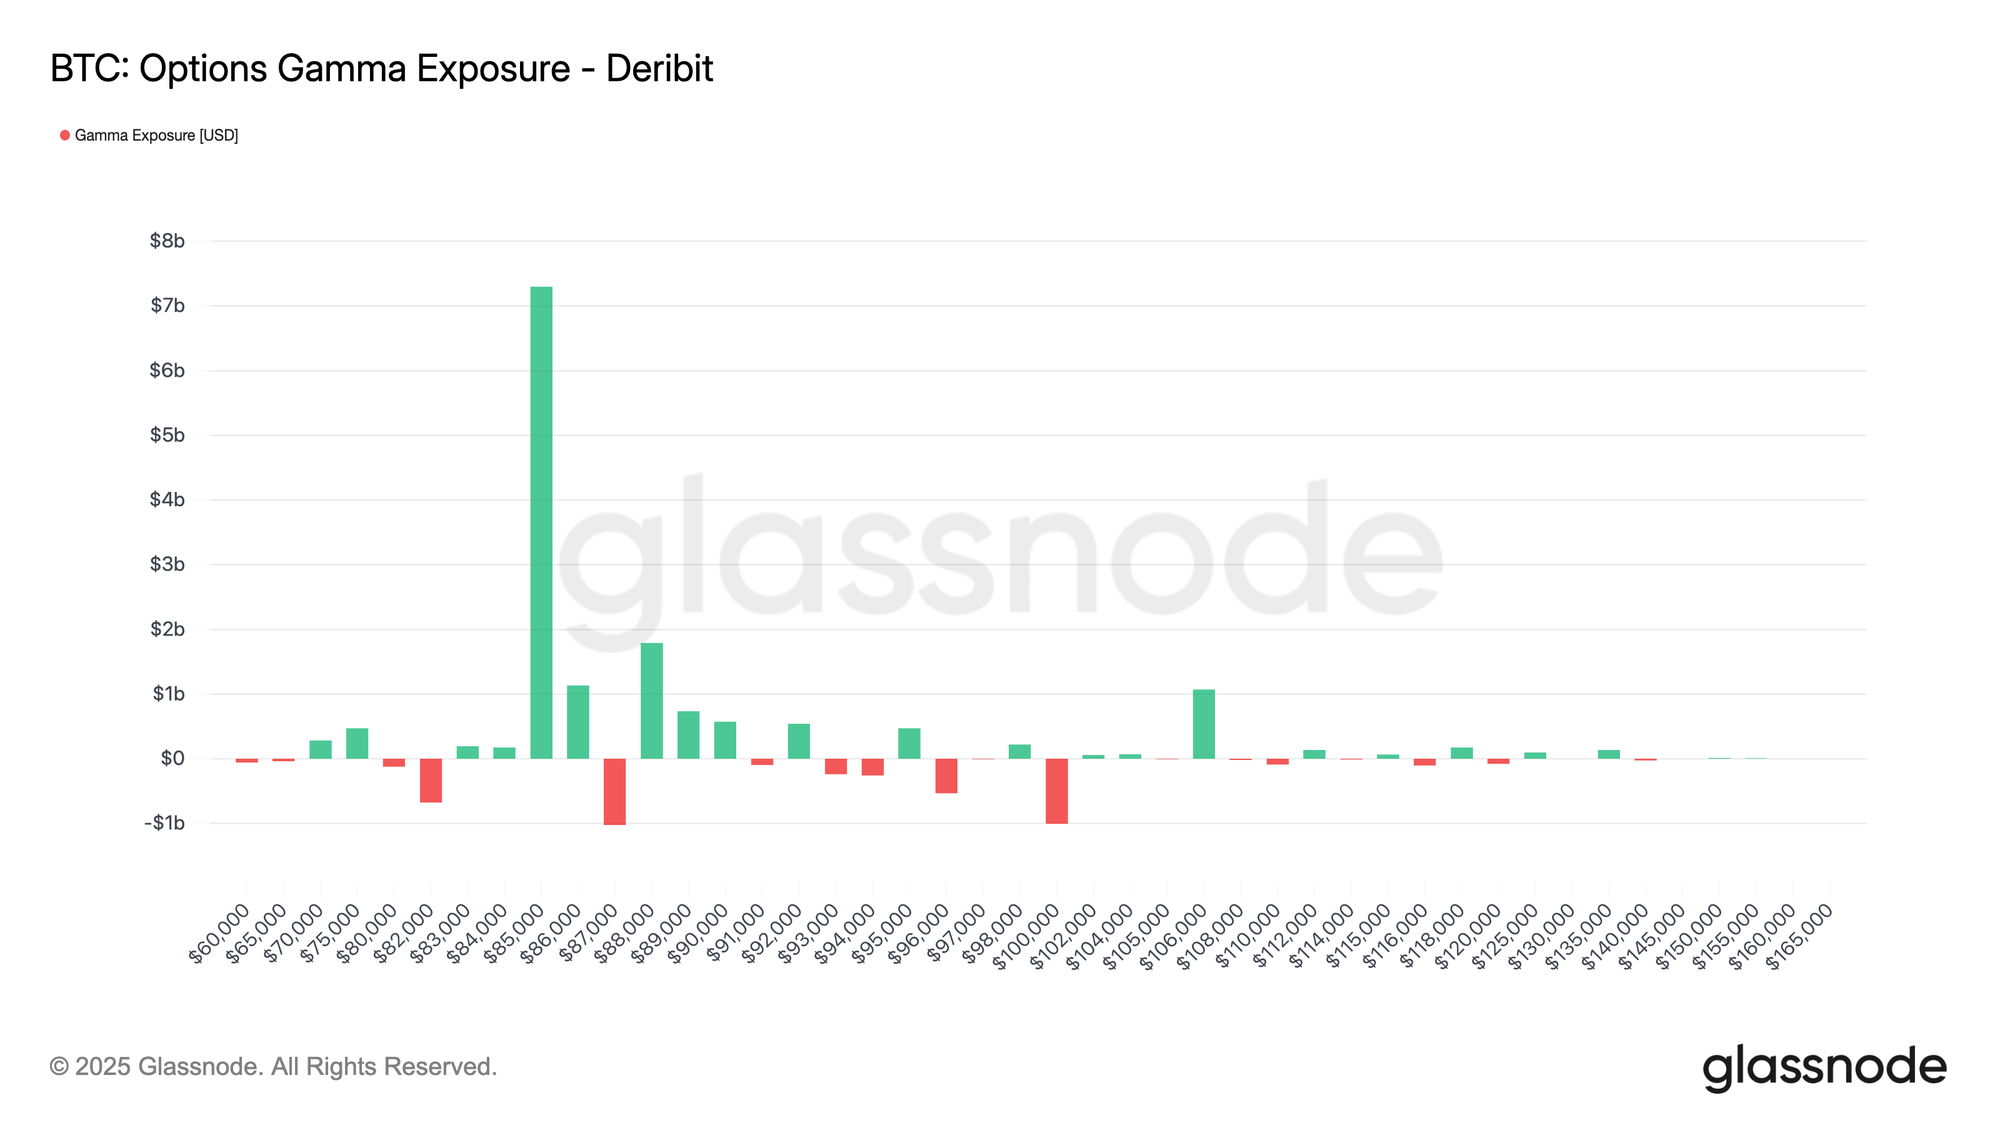
The chart below shows BTC options gamma exposure across strike prices on Deribit. Each bar represents the net gamma exposure (in USD) concentrated at that strike: green indicates positive exposure, red indicates negative exposure. The distribution shows a dominant positive gamma cluster around ~$86k–$87k, with smaller pockets of negative exposure around ~$83k and ~$101k.
View live chart

Metric Interpretation

Gamma exposure helps map where hedging flows may impact price action. Large positive GEX near ~$85k–$86k suggests a zone where dealer hedging is likely to be mean-reverting (buying dips and selling rallies), contributing to pinning or slower price movement around those strikes. By contrast, negative GEX pockets mark areas where hedging becomes momentum-reinforcing (selling into weakness / buying into strength), increasing the likelihood of faster, more directional moves if spot trades into them.

Available for:

  • Resolution: 10-minute
  • Assets: BTC, ETH, SOL, XRP, PAXG
  • Exchanges: Deribit

Trading Use-Cases: How to Use GEX in Practice

From a trading perspective, GEX turns the options surface into a map of where dealer flows are likely to amplify or dampen price moves.

Identifying “sticky” vs “slippery” price zones

  • High positive GEX near spot: When GEX is strongly positive around a band of strikes near spot, dealers are long gamma in that zone. As the market trades inside this band, their hedging flows tend to buy on dips and sell into rallies, which creates a pinning effect: moves fade, breakouts struggle, and realized volatility often comes in below implied. This is typically a mean-reverting, “sticky” regime, where short-gamma carry trades can work if volatility indeed remains contained.
  • High negative GEX near or below spot: When GEX is strongly negative around or just below spot, the opposite holds: dealers are short gamma, so as spot trades into that region, hedging flows sell into weakness and buy into strength. Instead of dampening moves, they amplify them. Price action becomes more “slippery”: intraday swings can expand, order books can feel thinner, and liquidations or squeezes become more likely. In that environment, traders often respond with lower leverage, wider stops, and more respect for momentum.

Watching for gamma flips

A particularly important dynamic is the gamma flip, when net GEX around spot changes sign. For example, if price exits a positive-gamma zone and moves into a pocket of negative gamma below, the market can transition from a pinned, mean-reverting regime to one where moves begin to reinforce themselves.


Appendix – Our Methodology: Taker-Flow-Based GEX

We construct Gamma Exposure on a 10-minute grid per asset, exchange, strike K, maturity M. The key idea is to reconstruct the dealer inventory over time from taker flows, and then translate that inventory into gamma exposure using option greeks.

We define the net taker flow in contracts over each 10-minute interval:

Under the assumption that dealers are primarily on the passive side, the dealer flow is simply the mirror image of taker flow:

We then cumulate these flows over time to obtain a dealer inventory in number of contracts. For calls, this is:

and analogously for puts:

Here Δt is the 10-minute step. Positive inventory values correspond to dealers being net long contracts at that strike and maturity; negative values correspond to net short.

To translate this inventory into gamma exposure, we combine it with option greeks and the underlying price. Let m denote the contract multiplier (e.g. BTC per contract), and S the spot price at time t. For each bucket we define the notional exposure:

Using the option gammas Γcall(K,M,t) and Γput(K,M,t) from our options chain, the gamma exposure of each leg is:


Γcall(K,M,t) is the gamma of the call option at that strike and maturity. This tells you how quickly the option’s delta changes when the underlying price moves.

And then total gamma exposure at that strike/maturity is just:

Criptos en tendencia

Preguntas relacionadas

QWhat is Gamma Exposure (GEX) and why is it important in options markets?

AGamma Exposure (GEX) measures how options market-makers' hedging flows react to movements in the underlying asset. It is important because dealer hedging flows can either stabilize or amplify price moves. High positive gamma tends to dampen volatility and create 'pinning' effects, while high negative gamma amplifies price moves and increases short-term volatility.

QWhy does the traditional equity-based GEX calculation method fail in crypto options markets?

AThe equity-based method fails because crypto options have different participant behaviors and trade motivations. In crypto, participants often buy calls for speculation rather than selling them for yield, and puts are traded tactically rather than purely as hedges. Additionally, the equity heuristic treats open interest as a single block position rather than accounting for both buying and selling flows that net out dealer exposure.

QHow does the taker-flow-based approach to GEX work in crypto markets?

AThe taker-flow-based approach uses trade-level data to identify whether the taker bought or sold options, assuming the maker is a dealer. It cumulatively tracks dealer inventory across strikes and maturities by mirroring taker flows. This inventory is then combined with option greeks and spot price to calculate gamma exposure, providing a more accurate measure based on actual trading activity rather than static heuristics.

QWhat are the practical trading use-cases for GEX in identifying market regimes?

AGEX helps identify 'sticky' zones with high positive gamma where dealer hedging dampens volatility and pins price near certain strikes, and 'slippery' zones with high negative gamma where hedging amplifies moves and increases volatility. It also helps watch for 'gamma flips' where the market transitions from mean-reverting to momentum-driven regimes as spot price moves between gamma zones.

QWhich assets and exchanges are covered by the taker-flow-based GEX methodology described?

AThe methodology covers BTC, ETH, SOL, XRP, and PAXG on the Deribit exchange, with data available at a 10-minute resolution.

Lecturas Relacionadas

As Consensus Accelerates, What Are Young Investors Betting On?

Title: As Consensus Forms Faster, What Are Young Investors Betting On? In the rapid evolution of tech investment, a new generation of young investors is navigating a landscape where AI, robotics, commercial aerospace, and quantum computing are advancing simultaneously. Traditional investment logic based on financial models is giving way to a need for deep technical understanding and the ability to act before industry consensus forms. An analysis of trends from the "WAIC FUTURE TECH" list of young investment leaders reveals key shifts in focus. The first major trend is the movement of AI from the digital screen into the physical world. Investment is shifting from large language models and chatbots towards embodied AI, robotics, AI hardware, and edge computing. While demonstrations generate excitement, the real challenge lies in achieving scalable, reliable, and cost-effective delivery in complex real-world environments like factories and logistics. Success depends not just on algorithms but on the integration of sensors, actuators, and control systems. Second, the competitive focus for large models is moving beyond raw capability toward building an "intelligence flywheel." The goal is to create self-reinforcing systems where user interaction generates data, improving the model, which in turn enhances the user experience and attracts more engagement. Companies that successfully embed AI into workflows to create these closed-loop systems can build lasting value that isn't easily erased by the next model upgrade. Third, facing a potential bottleneck in high-quality human-generated data, investors are looking at new underlying technologies. Reinforcement learning and self-play, as demonstrated by AlphaGo Zero, offer paths for AI to generate its own experience. Scientific foundation models, which aim to build general AI capabilities for fields like life sciences and materials discovery, represent a non-consensus direction that could unlock new frontiers of knowledge and data. Finally, in deep-tech areas like quantum computing, commercial aerospace, and space-based infrastructure, patient capital is essential. These fields have long, uncertain development and validation cycles involving complex engineering, supply chains, and regulations. Investment here requires a long-term view, focusing on foundational team capabilities and the eventual emergence of market demand, even if commercial returns are distant. Collectively, these trends illustrate how young investors are adapting to a new era. They are learning to make earlier, technically-informed judgments, balance hype with real-world viability, and provide the patient capital needed to build the deep-tech foundations of the future.

marsbitHace 10 min(s)

As Consensus Accelerates, What Are Young Investors Betting On?

marsbitHace 10 min(s)

Can Japan Buy Growth with AI? Will the Bond Market Believe It?

Japan's cabinet has introduced the 2026 Basic Policy on Economic and Fiscal Management and Reform, shifting its primary fiscal target. The new framework moves away from the traditional annual primary balance goal and instead prioritizes a stable reduction of the debt-to-GDP ratio. This change is tied to a strategy of increased "responsible proactive fiscal" spending, aiming to boost long-term growth through investments in strategic sectors like AI, semiconductors, energy, and robotics. The government estimates total public and private investment in 62 key technologies could exceed 370 trillion yen by 2040. The market reaction has been mixed and cautious. While equity markets may respond to policy signals, bond markets are focused on fiscal credibility. Concerns center on whether the weakening of the clear primary balance anchor could lead to looser fiscal discipline. If investors doubt that these strategic investments will generate sufficient productivity gains, tax revenue, and nominal growth to outpace rising interest costs, they may demand higher yields on Japanese Government Bonds (JGBs). Recent volatility in the yen and JGB yields, with the 10-year yield briefly reaching 2.9%, reflects this skepticism. The success of this new framework hinges on two factors: whether Japan can achieve a nominal growth rate consistently higher than its long-term interest rates, and whether future budgets demonstrate disciplined control over bond issuance. The government's narrative is that strategic investment is essential to break Japan's cycle of low growth, aging, and labor shortages. However, the bond market will continuously assess the credibility of this plan, pricing the risk that it may represent fiscal expansion rather than a viable growth strategy.

marsbitHace 47 min(s)

Can Japan Buy Growth with AI? Will the Bond Market Believe It?

marsbitHace 47 min(s)

Misjudged A-Shares: Resilience, Expectations, and Confidence

China's A-share market recently faced selling pressure, especially in tech sectors, initially triggered by a global tech sell-off that began in South Korea. However, the article argues this is a case of "mistaken injury" and highlights the market's underlying resilience. This resilience stems from three main pillars: **1) Tech Sector Fundamentals:** Unlike Korea's market dominated by a few memory chip stocks, China's tech sector is diversified across computing, communications, electronics, and semiconductors, supported by dual narratives of global AI supply chains and domestic substitution. Core areas like optical modules and fiber optics continue to show strong earnings growth. **2) "National Team" Support:** State-backed institutions and large corporations have made significant market purchases and announced buybacks, providing liquidity and signaling confidence. This is seen as a stabilizing policy signal, often associated with market bottoms. **3) Broader Market Pillars:** Other major sectors are showing endogenous recovery momentum. Consumer stocks benefit from stabilizing CPI and signs of sector recovery (e.g., liquor price hikes). Cyclical sectors like aluminum have high earnings, potential price increases due to tight supply, and low valuations. The financial sector offers stable dividends and low valuations. The conclusion is that the sell-off was driven by external contagion, not a collapse in fundamentals. With strong policy support and recovering momentum across key sectors, the A-share market possesses the toughness to regain stability.

marsbitHace 1 hora(s)

Misjudged A-Shares: Resilience, Expectations, and Confidence

marsbitHace 1 hora(s)

Trading

Spot

Artículos destacados

Cómo comprar FLOW

¡Bienvenido a HTX.com! Hemos hecho que comprar Flow (FLOW) sea simple y conveniente. Sigue nuestra guía paso a paso para iniciar tu viaje de criptos.Paso 1: crea tu cuenta HTXUtiliza tu correo electrónico o número de teléfono para registrarte y obtener una cuenta gratuita en HTX. Experimenta un proceso de registro sin complicaciones y desbloquea todas las funciones.Obtener mi cuentaPaso 2: ve a Comprar cripto y elige tu método de pagoTarjeta de crédito/débito: usa tu Visa o Mastercard para comprar Flow (FLOW) al instante.Saldo: utiliza fondos del saldo de tu cuenta HTX para tradear sin problemas.Terceros: hemos agregado métodos de pago populares como Google Pay y Apple Pay para mejorar la comodidad.P2P: tradear directamente con otros usuarios en HTX.Over-the-Counter (OTC): ofrecemos servicios personalizados y tipos de cambio competitivos para los traders.Paso 3: guarda tu Flow (FLOW)Después de comprar tu Flow (FLOW), guárdalo en tu cuenta HTX. Alternativamente, puedes enviarlo a otro lugar mediante transferencia blockchain o utilizarlo para tradear otras criptomonedas.Paso 4: tradear Flow (FLOW)Tradear fácilmente con Flow (FLOW) en HTX's mercado spot. Simplemente accede a tu cuenta, selecciona tu par de trading, ejecuta tus trades y monitorea en tiempo real. Ofrecemos una experiencia fácil de usar tanto para principiantes como para traders experimentados.

270 Vistas totalesPublicado en 2024.12.10Actualizado en 2026.06.02

Cómo comprar FLOW

Discusiones

Bienvenido a la comunidad de HTX. Aquí puedes mantenerte informado sobre los últimos desarrollos de la plataforma y acceder a análisis profesionales del mercado. A continuación se presentan las opiniones de los usuarios sobre el precio de FLOW (FLOW).

活动图片













