Author: BitalkNews
12 Bitcoin Data Indicators: Are We at the Bottom?
The current BTC price is approximately $59,600, representing a maximum drawdown of about 53% from the 2025 high. The market has entered a phase of deep correction, with multiple indicators showing valuations nearing historical lows, but a confirmed bottom still requires time.
Indicator 1: Fear & Greed Index
The current reading is 16, falling into the "Extreme Fear" zone. The last time a similar level was seen was during the FTX incident in 2022, indicating market sentiment is approaching historically extreme pessimism.
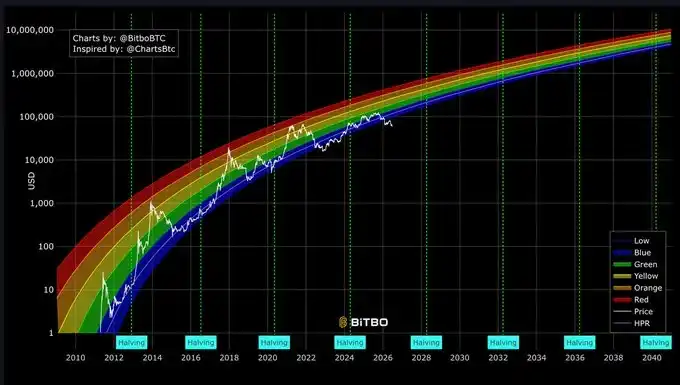
Indicator 2: Rainbow Chart
BTC has fallen into the "Bitcoin is dead" zone. This is only the second occurrence in history, with the price now significantly below the long-term trend valuation band.
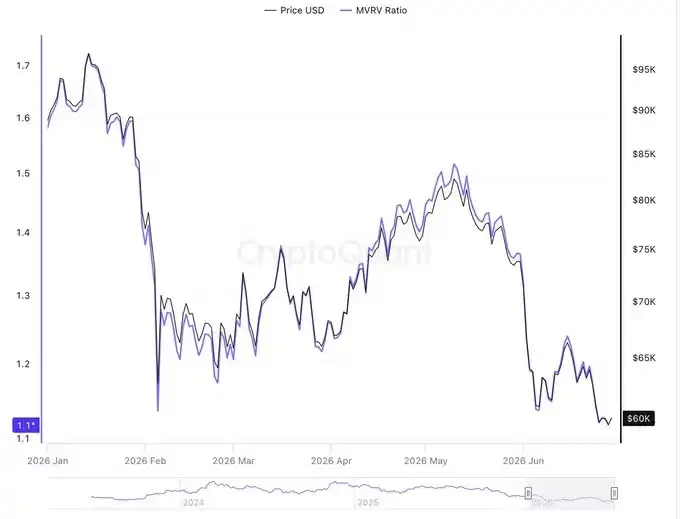
Indicator 3: MVRV Ratio
The current MVRV is approximately 1.13, situated at the lower edge of the historical channel. This corresponds to a price range of roughly $53,200-$53,400, suggesting market valuation is nearing the bottom region.
Indicator 4: Realized Price
CryptoQuant data shows the BTC realized price is approximately $53,400. The current price is only about 12% higher, and it has not yet broken below the long-term cost basis line for holders.
Indicator 5: UTXO Profit/Loss Ratio
This indicator has dropped to its lowest level during this correction. CryptoQuant interprets this as the first clear "capitulation" signal for the market, a condition historically seen multiple times near cycle bottoms.
Indicator 6: Long-Term Holder SOPR
The Spent Output Profit Ratio (SOPR) for long-term holders (coins held for over 155 days) is 0.662, now in negative territory. This indicates older holders are beginning to sell at a loss, further releasing market selling pressure.
Indicator 7: Miner Survival Status
The BTC price has been below the production cost for some miners for an extended period, with roughly 20% of miners currently operating at a loss. Miners are facing significant pressure in this cycle.
Indicator 8: Miner Revenue Divergence
Actual miner revenue is significantly lower than theoretical levels, with transaction fee revenue remaining low. The miner capitulation process is still ongoing.
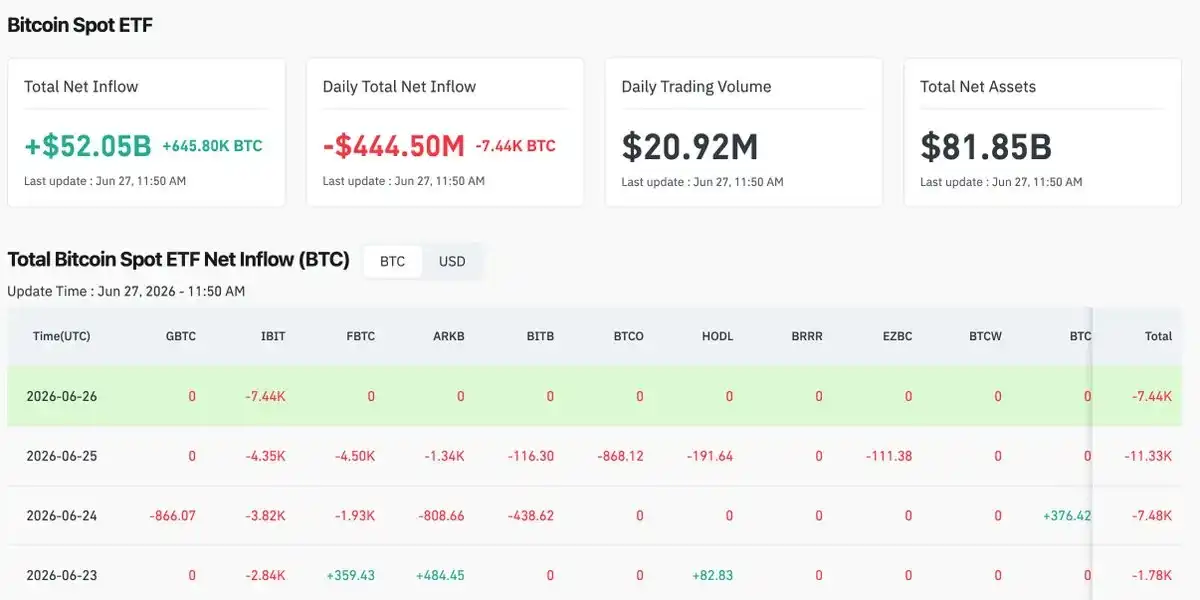
Indicator 9: ETF Fund Flows
U.S. spot BTC ETFs have recently shown persistent net outflows, with a streak of 13 consecutive days of outflows at one point. Weekly net outflows exceeded $1.7 billion, putting pressure on institutional buying demand.
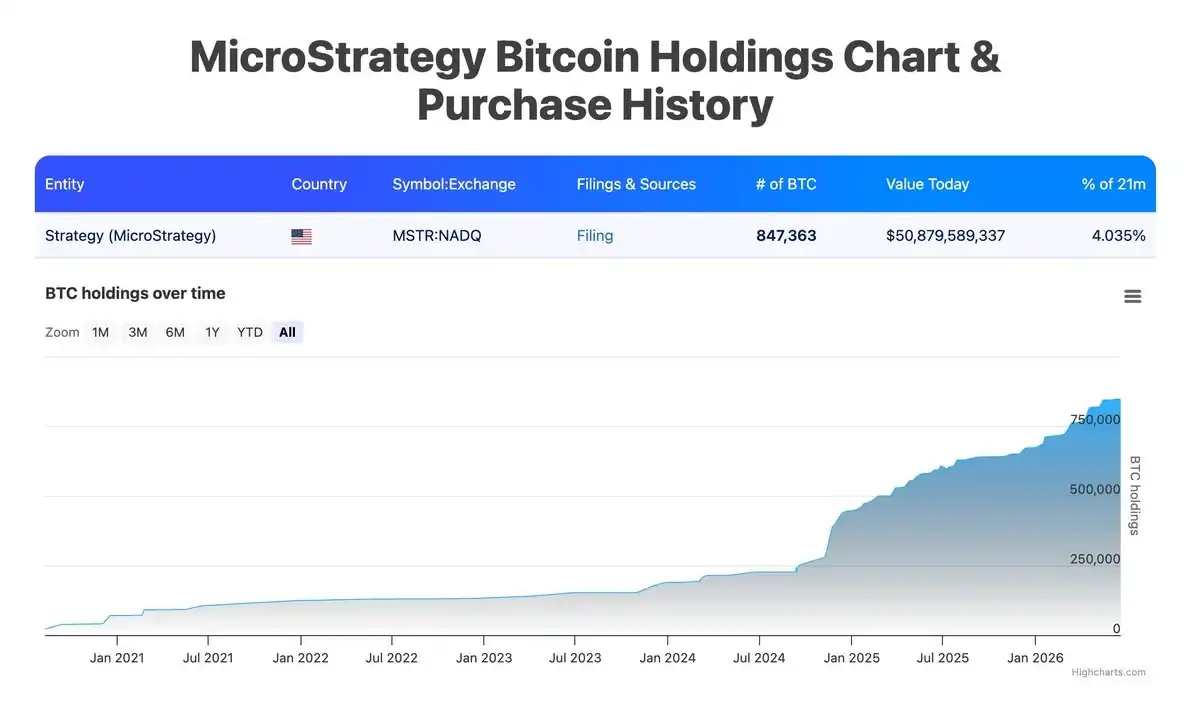
Indicator 10: Strategy Risk
Strategy holds approximately 847,000 BTC, but the premium on its shares has contracted sharply, indicating pressure on the traditional "leverage to buy bitcoin" model.
Indicator 11: Bear Market Duration & Drawdown
This correction has lasted over 265 days with a maximum drawdown of about 52.5%. While the percentage decline is lower than in historical bear markets, the duration is already approaching that of longer cycles.
Indicator 12: Polymarket Expectations
Market bets suggest there is still an ~80% probability of BTC falling below $55,000, and a notable probability exists for a drop below $50,000, showing traders remain cautious.
Bitcoin is currently in a phase of deep correction and potential bottom formation.
Valuation indicators have entered historically low regions (extreme fear, rainbow dead zone, MVRV ~1.13, price only ~12% above realized price). On-chain capitulation signals are also accumulating (miner pressure, long-term holders selling at a loss, low UTXO levels).
However, the full capitulation has not yet concluded—the realized price has not been decisively broken, and ETF demand has not reversed.
The sub-$60,000 region is already attractive from a mid-to-long-term perspective, but the current environment favors patient observation for confirmation signals rather than aggressive action. Key signals to watch include ETF inflows turning positive, a recovery in long-term holder SOPR, and a reduction in miner pressure.