Gold breaks KEY support with 3.7% drop – Will crypto face pressure next?

ambcryptoPublicado a 2026-03-21Actualizado a 2026-03-21

Resumen

The latest inflation report, with February's hotter-than-expected PPI, triggered a 3.7% drop in gold, breaking key support. This sell-off is attributed to a stronger U.S. dollar and rising Treasury yields, making traditional safe havens more attractive. Historically, a stronger DXY negatively impacts risk assets like crypto. Bitcoin is currently stagnant near $70k with negative funding rates and declining capital inflows, indicating a bearish bias. The falling Coinbase Premium Index and increased short positions suggest a crypto downturn may already be priced in, especially given macro pressures and the historical inverse correlation between DXY and BTC.

The latest inflation report has clearly shaken things up in this market cycle.

To put it in context, February’s PPI, released on the 18th of March, came in hotter than expected, signaling that U.S. inflation is still sticky. The reaction was almost instant. Gold, for instance, dropped 3.74%, slicing through the $5k support level, a move that caught many traders off guard.

The logic here is straightforward: Historically, during times of geopolitical instability, investors flocked to gold as a hedge against inflation. But what’s interesting now is that this pattern seems to be shifting. So far, this move hasn’t spilled over into crypto, though that doesn’t mean a crash is off the table.
Source: TradingEconomics

To see why, you need to look at a couple of key things.

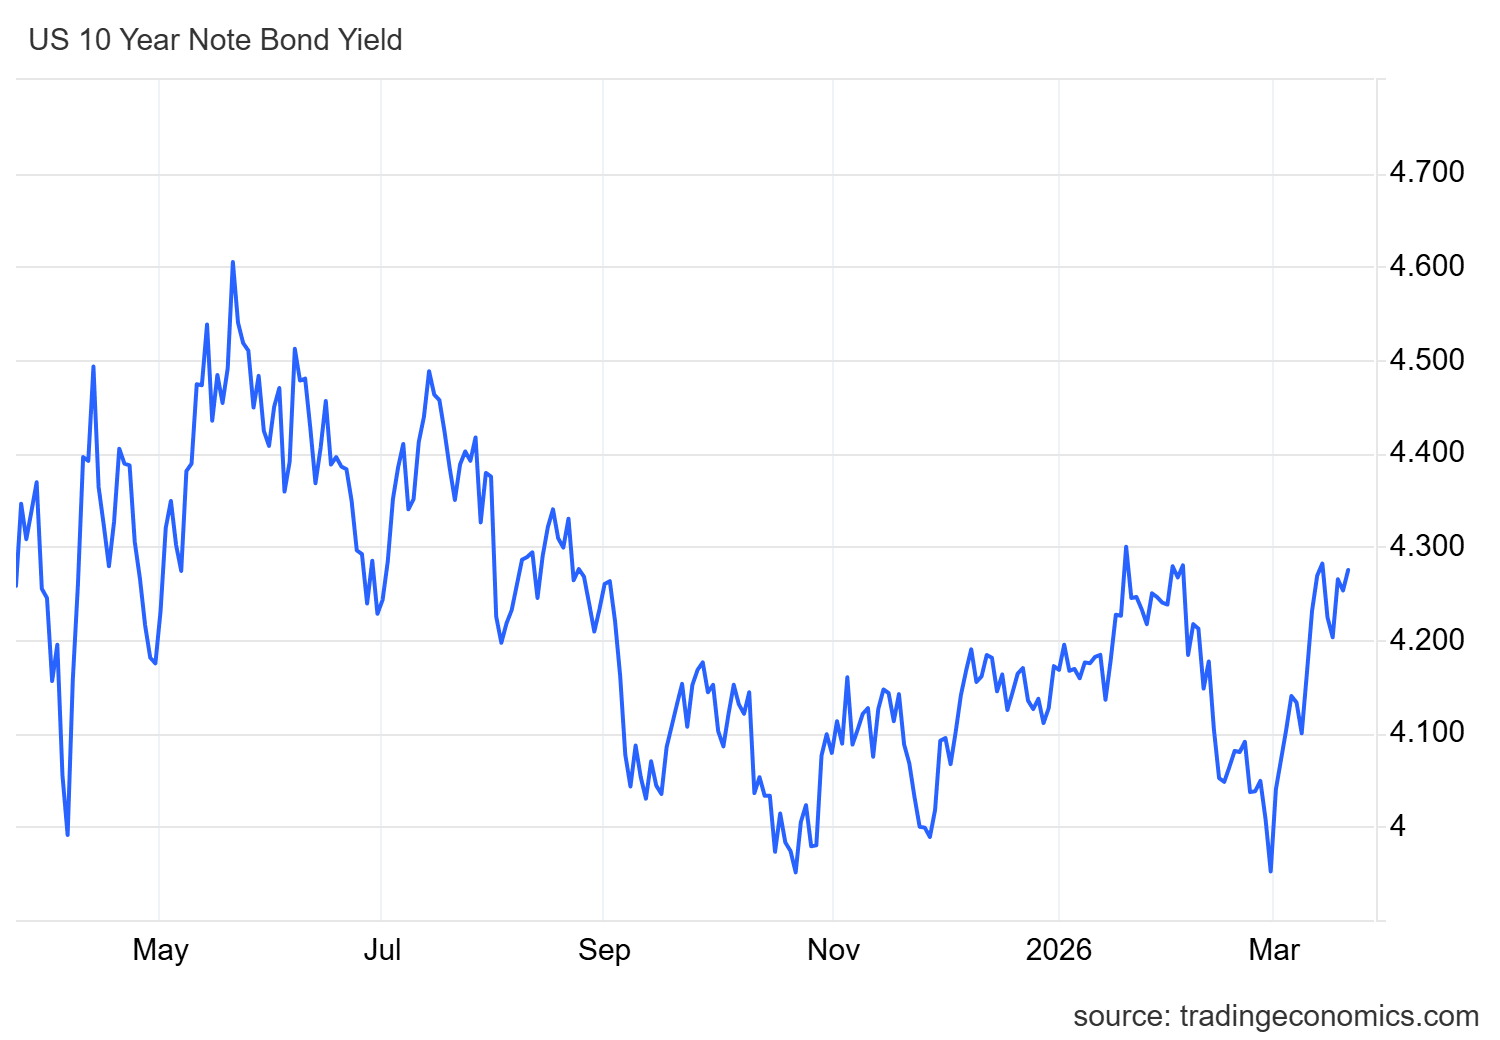
First, the gold sell-off is tied to the U.S. dollar getting stronger. With the Fed keeping interest rates steady and U.S. debt now over $39 trillion, Treasury yields are starting to look a lot more attractive. In fact, yields have jumped nearly 10% since the war kicked off, which is clearly pulling attention away from gold.

On the crypto side, history tells a familiar story. A stronger DXY usually means less love for risk assets. That means when geopolitical tensions rise, risk assets start to feel less appealing. Meanwhile, a stronger dollar pulls capital into bonds, which feel safer and now offer higher returns thanks to rising yields.

In this context, the falling Coinbase Premium Index (CPI) is already hinting at this shift, showing why crypto could eventually follow gold’s lead.

Rising Bitcoin shorts: Is a crypto crash already priced in?

Crowded trades during volatile markets can be a double-edged sword.

Currently, crypto is stuck chopping in a tight range, with Bitcoin [BTC] hovering around the $70k mark and no big capital inflows in sight. Naturally, liquidity clusters are stacking up at different price levels, hinting that traders are gearing up for a potential move.

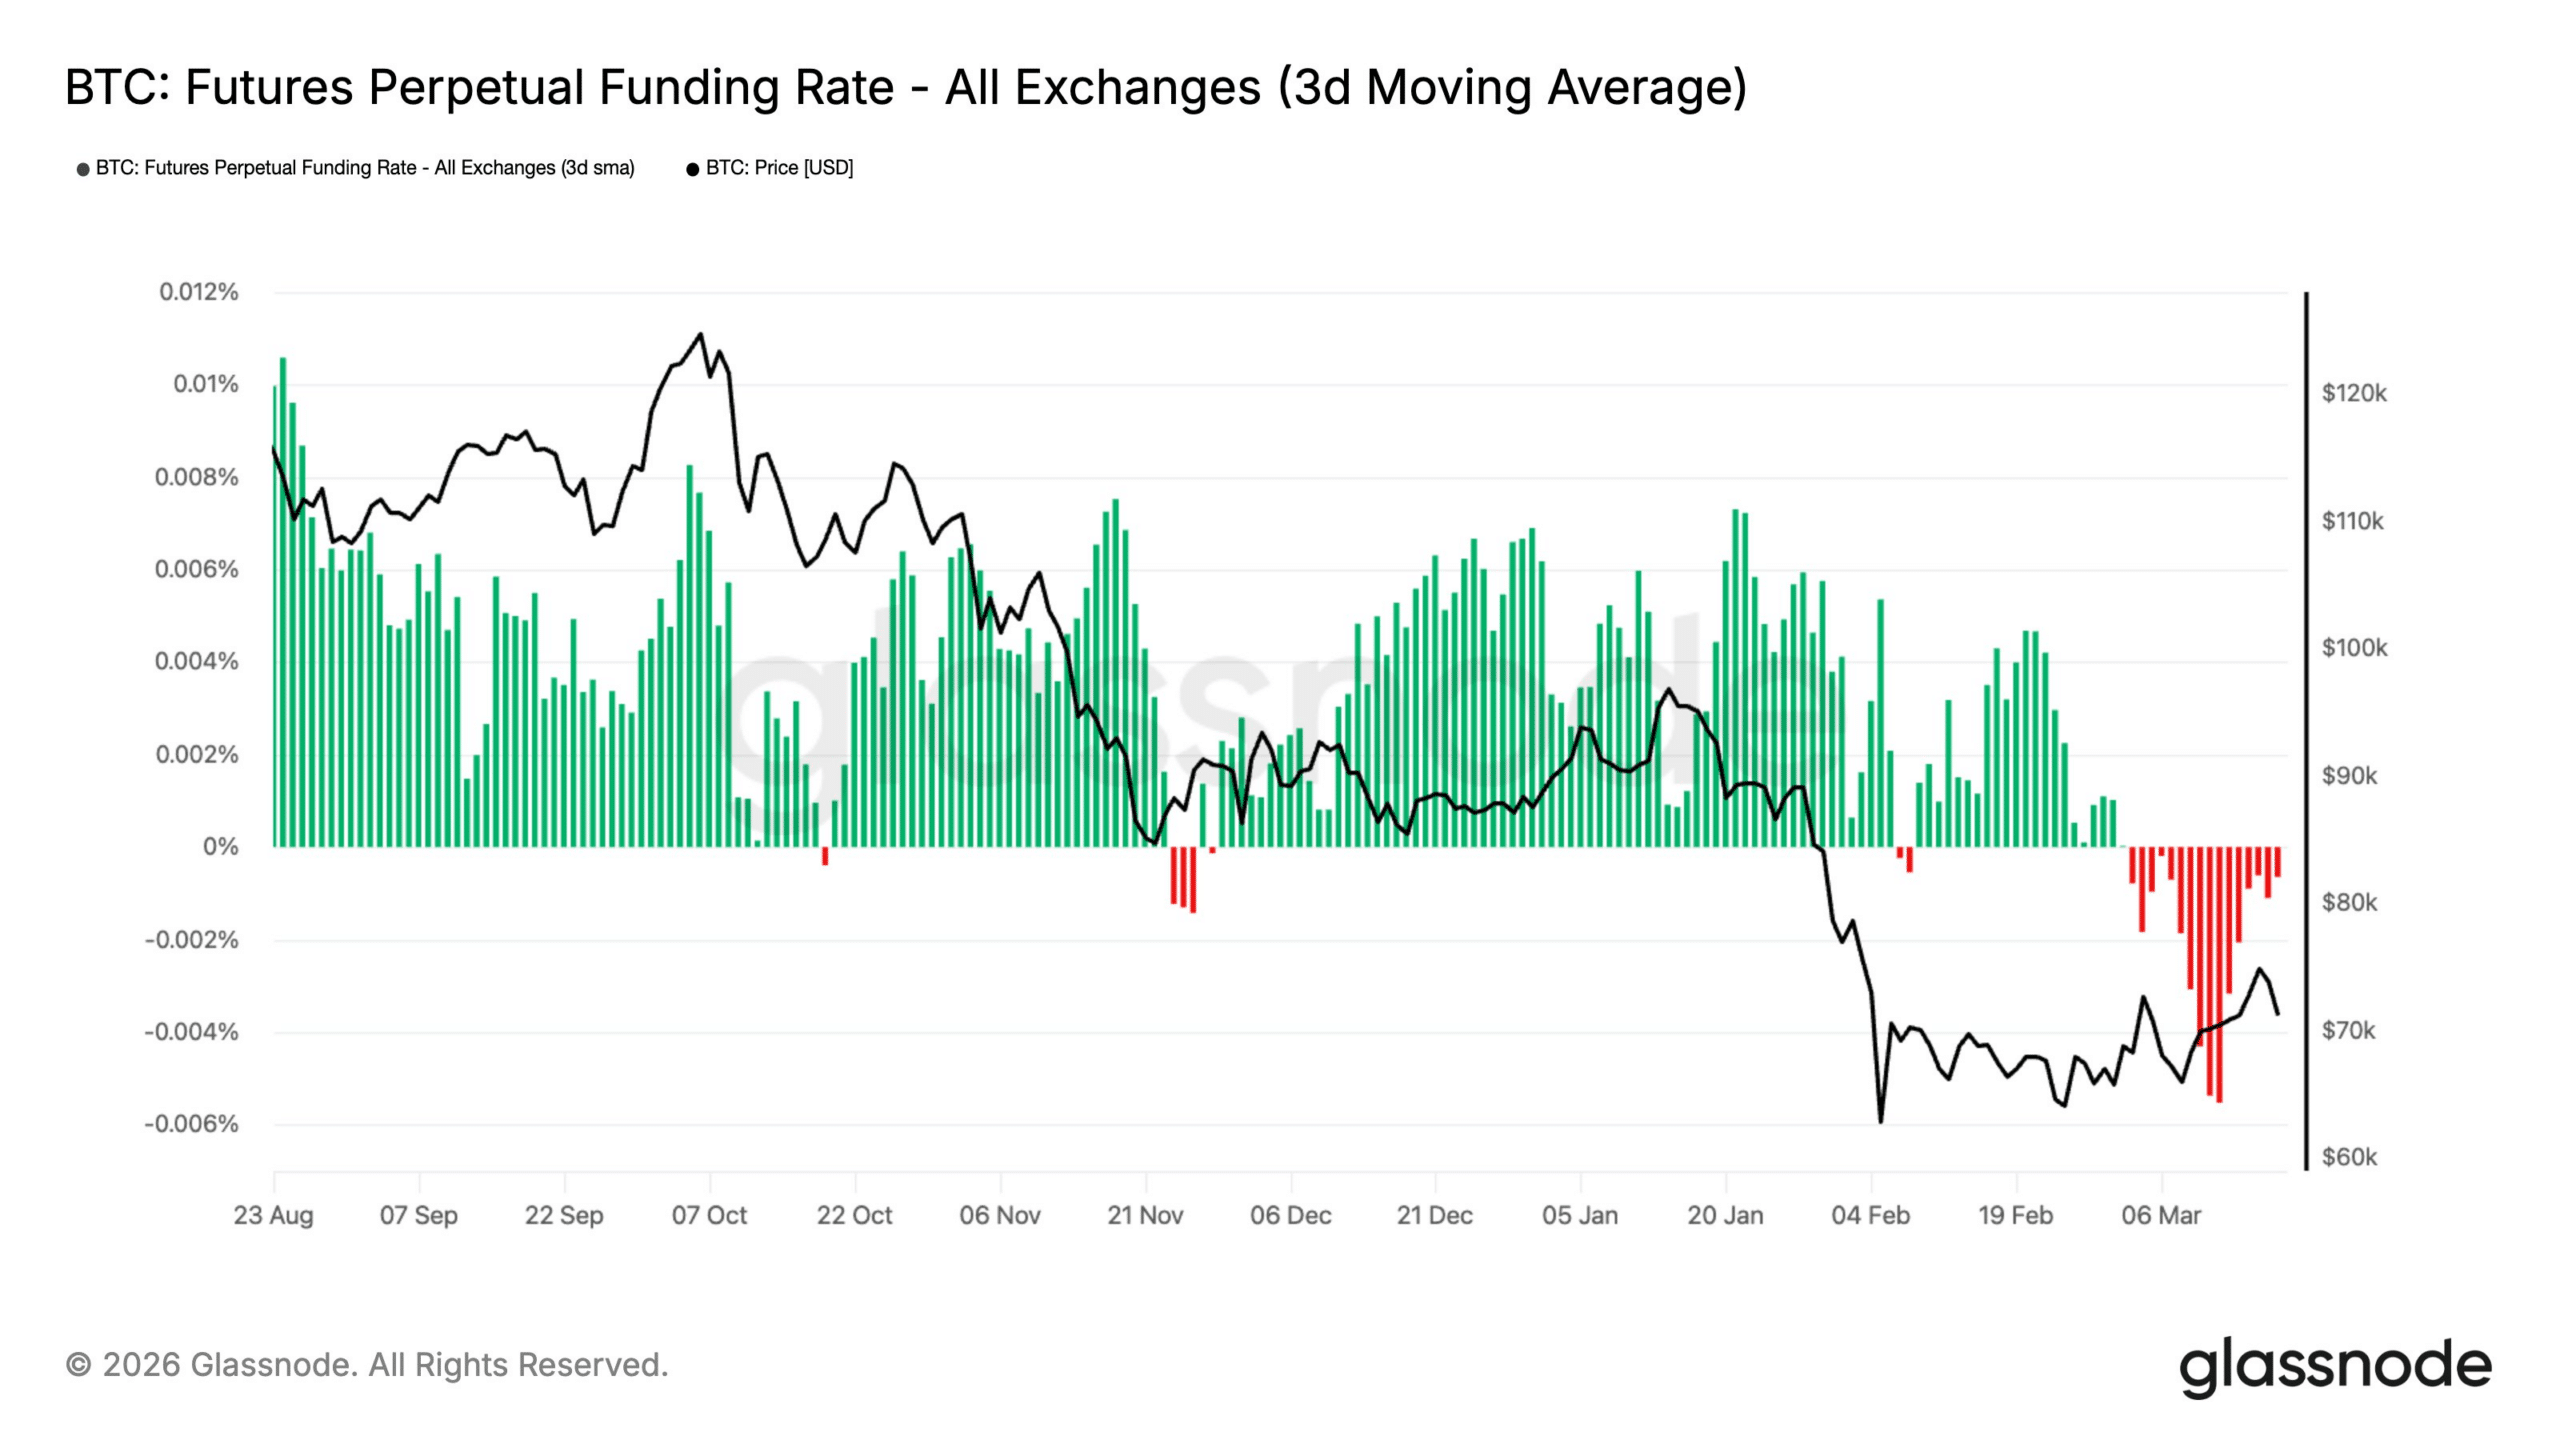
Backing this up, Glassnode data shows perpetual funding is still firmly negative, confirming the bearish bias in directional premium. Put simply, even though BTC has bounced off the lows, traders are still leaning short, which keeps the market primed for a potential squeeze-driven upside.
Source: Glassnode

But here’s where it gets interesting: The recent gold sell-off adds a twist, showing just how exposed the crypto market still is. With rising yields pulling capital back into traditional safe havens, and the Federal Reserve brushing off any talk of interest rate cuts, crypto traders are left navigating a tricky setup.

In this context, the rising Bitcoin shorts don’t feel like a fluke.

Instead, they’re looking more like strategic positioning. With the Coinbase Premium Index falling, limited capital inflows, BTC stuck near resistance, and a shifting macro backdrop, everything points to a bearish bias in both technicals and fundamentals. Bottom line? A crypto crash already looks priced in, and with the historical DXY-BTC correlation, it wouldn’t be surprising if history repeats itself.


Final Summary

  • Rising yields and a firmer DXY are pulling capital into safe havens, shaking confidence in gold.
  • With Bitcoin near resistance, falling CPI, and bearish technicals, a crypto crash may already be priced in.


Preguntas relacionadas

QWhat was the immediate market reaction to the hotter-than-expected February PPI report released on March 18th?

AThe reaction was almost instant. Gold, for instance, dropped 3.74%, slicing through the $5k support level.

QAccording to the article, what two key factors are pulling attention and capital away from gold?

AThe gold sell-off is tied to the U.S. dollar getting stronger (a firmer DXY) and rising Treasury yields, which have jumped nearly 10% and are now more attractive.

QWhat does the falling Coinbase Premium Index (CPI) signal for the crypto market?

AThe falling Coinbase Premium Index is hinting at a shift, showing that crypto could eventually follow gold's lead downward as capital moves away from risk assets.

QWhat does the negative perpetual funding rate and bearish bias in directional premium indicate about trader sentiment?

AIt confirms a bearish bias, indicating that even though BTC has bounced off lows, traders are still leaning short and positioning for a potential downside move.

QWhy does the article suggest that a crypto crash may already be 'priced in'?

ABecause of the rising Bitcoin shorts, falling CPI, limited capital inflows, BTC being stuck near resistance, and a shifting macro backdrop with a stronger dollar and rising yields, all of which point to a bearish bias.

Lecturas Relacionadas

Solana Price Forecast for August 2026: Can $19 Million from Morgan Stanley and 330,000 Korean Merchants Break SOL's Triangle?

**Solana Price Forecast for August 2026: Key Catalysts and Technical Setup** As of July 31, Solana (SOL) trades at $73.59, consolidating within a triangle pattern formed between its May peak (~$98) and June low (~$60.29). A decisive breakout from this pattern is anticipated. Key resistance levels are clustered around $74.79 (0.382 Fib), $75.33 (20-day EMA), $76.01 (50-day EMA), and a critical zone near $79 (0.5 Fib & 100-day EMA). Support lies at $73.42, $69.25 (0.236 Fib), and the June low of $60.29. Two major institutional catalysts emerged recently: 1. **Morgan Stanley's MSOL ETF:** Launched July 28, it saw $19.06 million in inflows on its second day—the largest single-day inflow for any US SOL ETF since mid-May. 2. **KSNET Partnership:** The Solana Foundation signed an MoU with South Korean payment processor KSNET (serving 330,000 merchants) to explore integrating Solana Pay for domestic and AI-powered transactions. Historically, August has been volatile for SOL, marked by extreme gains in 2020 and 2021 but otherwise weak performance. The forecast for August 2026 is bifurcated: * **Bullish Case:** An upside triangle breakout, sustained MSOL inflows, and positive momentum from the KSNET news could propel SOL toward the $79 resistance cluster, especially if the CLARITY Act is passed by August 8. * **Bearish Case:** A downside break below $73.42, fading excitement around the new ETF, and stalled regulatory progress could see SOL retest support near $69.25, exacerbated by macro risks.

cryptonews.ruHace 11 min(s)

Solana Price Forecast for August 2026: Can $19 Million from Morgan Stanley and 330,000 Korean Merchants Break SOL's Triangle?

cryptonews.ruHace 11 min(s)

AFX Trade Promises to Present "Goodwill Plan" on August 3 Following $24 Million Loss Incident

AFX Trade, a cryptocurrency platform, announced it will present a "goodwill plan" on August 3rd, following a security incident on July 22nd that resulted in a loss of $24.15 million. The company's brief update offered no specific details on compensation for affected users, investors, and employees, only urging calm while the team formulates next steps. The theft occurred from a USDC custody account on Arbitrum, with the stolen funds converted to Ethereum. Blockchain analysts traced the funds to a single wallet. AFX Trade and Arbitrum clarified the exploit targeted a third-party bridge, not Arbitrum's native bridge. An investigation revealed the attack began on July 9th with a social engineering scheme targeting a developer. The attacker then deployed malicious code within AFX's internal JFrog repository and infrastructure, eventually compromising bridge validators to authorize the fraudulent withdrawal. The company stated the exploit leveraged a "trust vulnerability," not a smart contract bug. AFX Trade's head of business development made an offer to the attacker, proposing they keep 30% of the funds as a white hat bounty if 70% is returned. The incident fits a 2026 trend identified by TRM Labs: while the number of crypto hacks hit a record, total losses decreased. However, infrastructure and operational breaches, though fewer, accounted for the majority of financial losses. The AFX breach is classified as an infrastructure incident involving private key compromise.

cryptonews.ruHace 21 min(s)

AFX Trade Promises to Present "Goodwill Plan" on August 3 Following $24 Million Loss Incident

cryptonews.ruHace 21 min(s)

Trading

Spot
活动图片