Gate Institutional Weekly Report: BTC Funding Rate Turns Positive, CEX TradFi Trading Volume Soars (March 23–29, 2026)

marsbitPublicado a 2026-04-03Actualizado a 2026-04-03

Resumen

Last week, the market was primarily driven by a sharp escalation in the U.S.-Iran conflict, which pushed WTI crude oil prices above $100 amid threats to the Strait of Hormuz. This triggered inflation concerns, rising U.S. bond yields, and a sell-off in tech stocks and crypto assets, with major cryptocurrencies falling over 6%. Market sentiment indicators like the VIX and Fear & Greed Index reflected high uncertainty and fear. In crypto ETFs, outflows dominated mid-week with $500M net withdrawn from BTC and ETH products, though slight inflows returned by the weekend. TradFi trading volume on CEXs surged, especially in commodities and metals, while PAXG liquidity recover after initial sell pressure. On-chain, DEX trading cooled, with Meteora on Solana maintaining high volume while others declined. Stablecoin supply remained stable, with DAI showing resilience. LST protocols like Lido and Jito saw reduced activity due to lower ETH and SOL performance. Aave’s lending decreased overall, though Mantle saw growth. Derivatives data showed BTC funding rates briefly turned positive, indicating tentative long interest, though open interest declined and skew remained negative, reflecting defensive sentiment. Implied volatility held steady, suggesting limited expectations for near-term price swings. Gate highlighted progress in data-driven operations, growth in lending, AI integration, and upcoming events including the Hong Kong Web3 Festival.

The core driver of the market last week was the sharp escalation of the US-Iran conflict. As the Strait of Hormuz faced a substantial threat, WTI crude oil prices surged nearly 17% during the week, reclaiming the $100 mark. This simultaneously triggered strong inflation expectations, leading to rising US Treasury yields and dealing a heavy blow to high-valuation tech stocks. The US Dollar Index broke through the 100 mark, suppressing gold's gains. Cryptocurrencies, as high-risk assets, experienced significant selling pressure, with weekly declines exceeding 6%. As the US-Iran conflict entered its fifth week with no signs of resolution, the sell-off continued. Last week's volatility and uncertainty indicators reflected the current macroeconomic tone. The VIX index closed at 31.05, its highest level since the outbreak of the war; while CNN's Fear & Greed Index fell to the "Extreme Fear" level, its lowest since last November. The bond market further adjusted its pricing, with the 10-year US Treasury yield rising to 4.44% and the 30-year US Treasury yield briefly breaking through 5% before retreating to just below that level. This movement reflects the market's entrenched expectation of "higher for longer" interest rates. The market widely believes the possibility of a Fed rate cut before autumn is minimal, while the chance of a 25 basis point rate hike this year is about 25%.

2. Liquidity Analysis

2.1 Crypto ETF Net Flows

Crypto ETF flows showed a clear pattern of "outflows first, recovery later" over the past week: sentiment weakened rapidly mid-week, with spot ETFs seeing a combined net outflow of approximately $500 million—BTC outflows were about $296 million and ETH outflows about $207 million. The selling pressure was mainly concentrated on March 26-27, indicating a clear phase of institutional de-risking. Marginal inflows appeared over the weekend, ending the multi-day outflow trend. Overall, institutional funds remain cautiously allocated amid macroeconomic uncertainty.

2.2 TradFi Liquidity

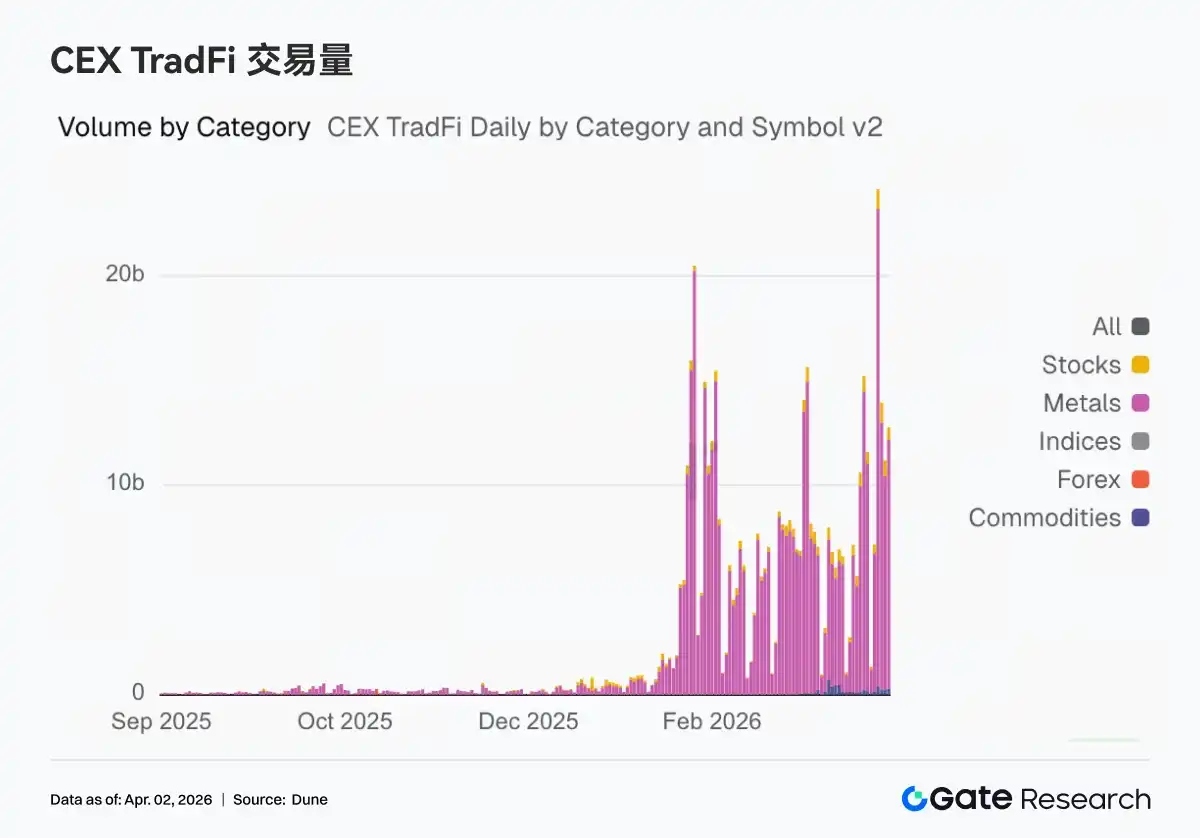
Over the past week, on-chain trading remained centered around macro asset volatility. Perp DEX TradFi trading volume rose to $17 billion; crude oil trading still had the highest weight but declined sequentially, while gold's share increased again. TradFi perpetual trading volume on CEXs surged, with volume on March 23rd hitting a record high. All sub-categories saw significant growth, with commodities and metals showing the highest sequential increases.

PAXG's market depth changes over the past week exhibited a structural feature of "weak first then strong, with tail-end volume expansion." Early in the week, Delta was mostly negative, coupled with price declines from highs, indicating net selling dominated and liquidity tended to withdraw; subsequently, around March 23rd, a round of concentrated selling pressure emerged, corresponding to a rapid price drop and creating a temporary liquidity vacuum. Depth structure improved significantly over the weekend, with Delta turning consistently positive and the scale significantly expanding, indicating funds began to actively absorb selling and push prices higher.

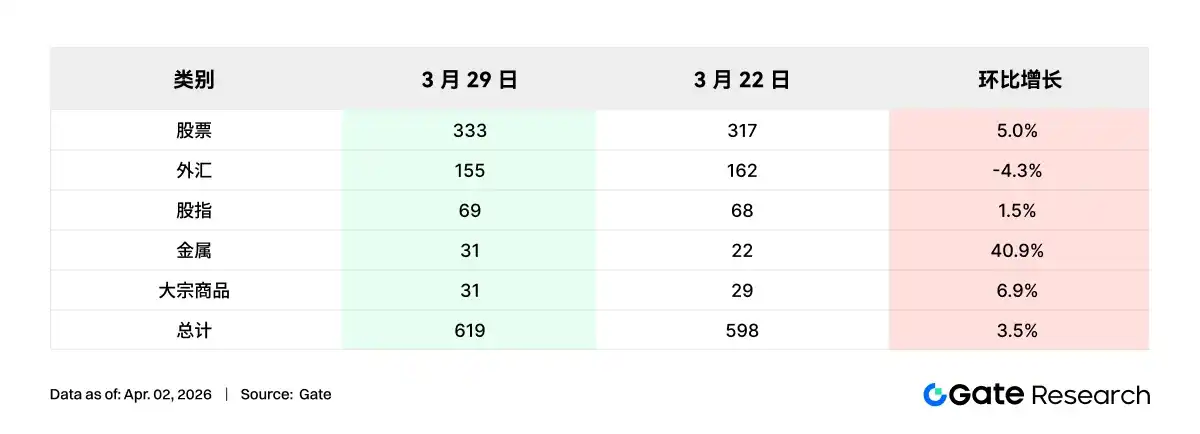
The number of TradFi asset categories expanded further last week. The total number of TradFi asset categories (counting only TradFi and CFD sections, excluding perpetual contracts) on three major CEXs increased from 598 to 619, a sequential growth of 3.5%. Metals saw the most significant growth, increasing from 22 to 31 items, up 40% sequentially; overall, only Gate saw an increase in the number of TradFi asset categories last week.

3. On-Chain Data Insights

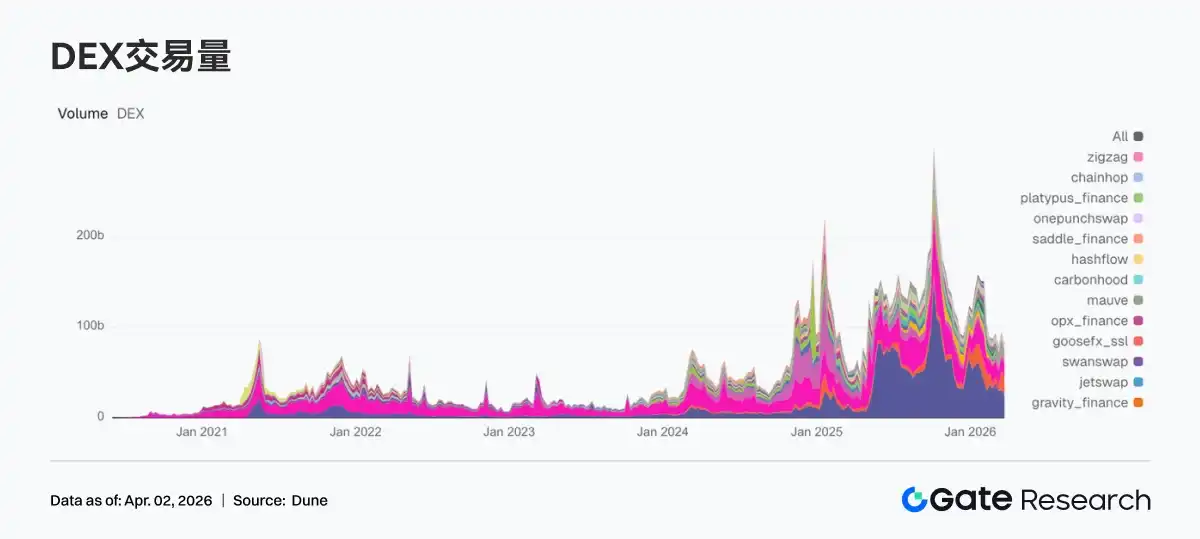
3.1 DEX Trading Cools Down, Meteora Remains High

Trading heat shifted from last week's surge to a cooling phase, with top protocols generally pulling back. Weekly trading volume on both PancakeSwap and Uniswap declined compared to the previous week, indicating a overall convergence of spot trading demand on mainstream chains. The Solana side showed divergence; Meteora remained at a high level slightly above $20 billion in trading volume, but marginal growth has slowed; Raydium's weekly trading volume fell 50% sequentially, the largest drop among top DEXs. Aerodrome, Humidifi, and Bisonfi also saw varying degrees of decline. Looking at the protocol side, PancakeSwap's Infinity architecture and Meteora's DLMM remain the strongest efficiency labels, but the market this week placed more emphasis on确定性 liquidity.

3.2 Stablecoin Supply Consolidates at Highs, DAI Shows Resilience

No new external inflows were seen in the stablecoin sector this week, with overall levels consolidating at highs. USDT remained almost flat compared to the previous week. USDC decreased by about $1.4 billion, and PYUSD also fell by nearly $200 million, indicating demand for payment and settlement-oriented stablecoins slightly declined this week. Protocol-type stablecoins were relatively more stable, with DAI seeing slight growth and USDS maintaining high levels. USD1, USDe, and GHO had minor fluctuations,偏向 structural reallocation. Circle continues to advance the multi-chain expansion of USDC + CCTP, but this week's data reflects a tilt within stablecoins from payment/settlement towards resilience in DeFi scenarios.

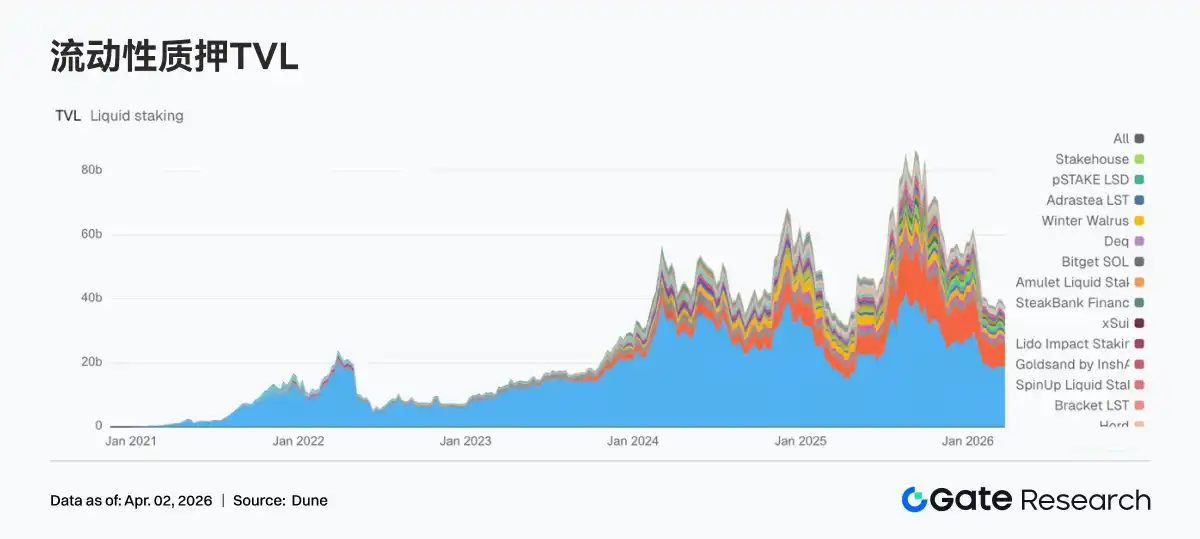
3.3 LST Protocols Pull Back, ETH and SOL Both Decelerate

This week, the liquid staking sector saw both ETH and SOL narratives decelerate. Affected by ETH's poor performance, ETH LST funds began阶段性 reducing positions, with TVL declining for both Lido and Rocket Pool. Lido's V3 and EarnETH / EarnUSD vault expansions have broadened the product boundaries, but short-term TVL is more influenced by market risk appetite and staked asset price volatility. The SOL direction also faced pressure, with Jito and Sanctum Validator LSTs, among others, experiencing pullbacks. Overall, the week saw a downturn in the sector's overall risk appetite.

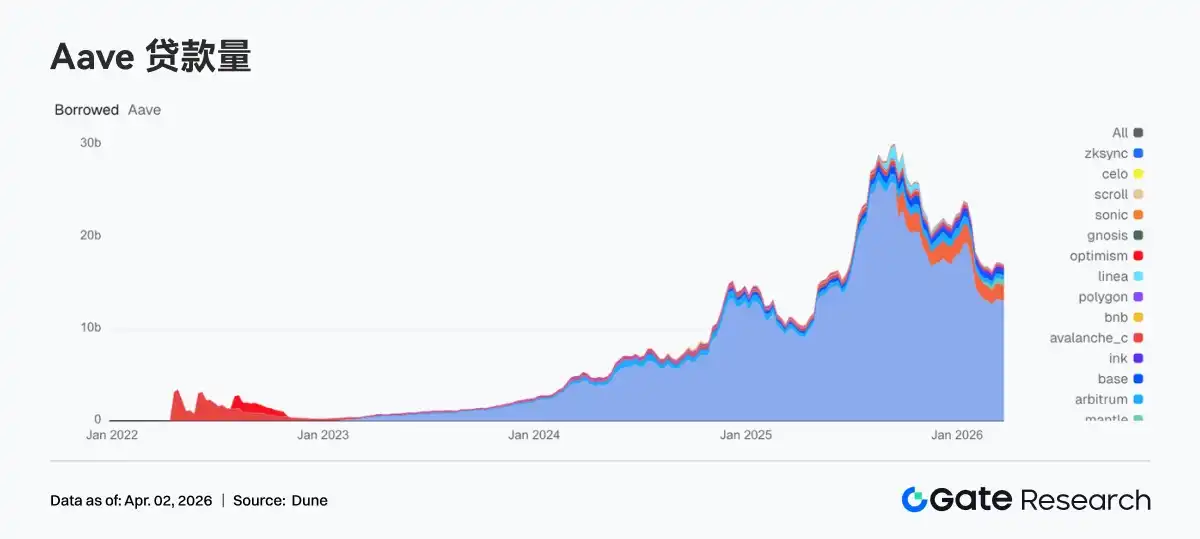
3.4 Aave Loan Volume Pulls Back, Mantle Becomes a Market Absorbing Limited Increment

Aave's total loan balance slightly decreased compared to the previous week. Both the Ethereum main market and Plasma saw declines of about $100 million, indicating deleveraging in mainstream markets. Multi-chain expansion also temporarily slowed this week, with Base and Arbitrum同步 pulling back. Mantle was one of the few markets that grew against the trend, with loan规模 increasing from $555 million to $574 million, becoming the structural highlight of the week. Ink also rose slightly from $289 million to $292 million, but the increase was limited. Aave is recently advancing its V4 Hub-and-Spoke model, and the market is pricing in future cross-market liquidity efficiency, but current funds are prioritizing reducing overall leverage and allocating limited increments to sub-markets with new narratives.

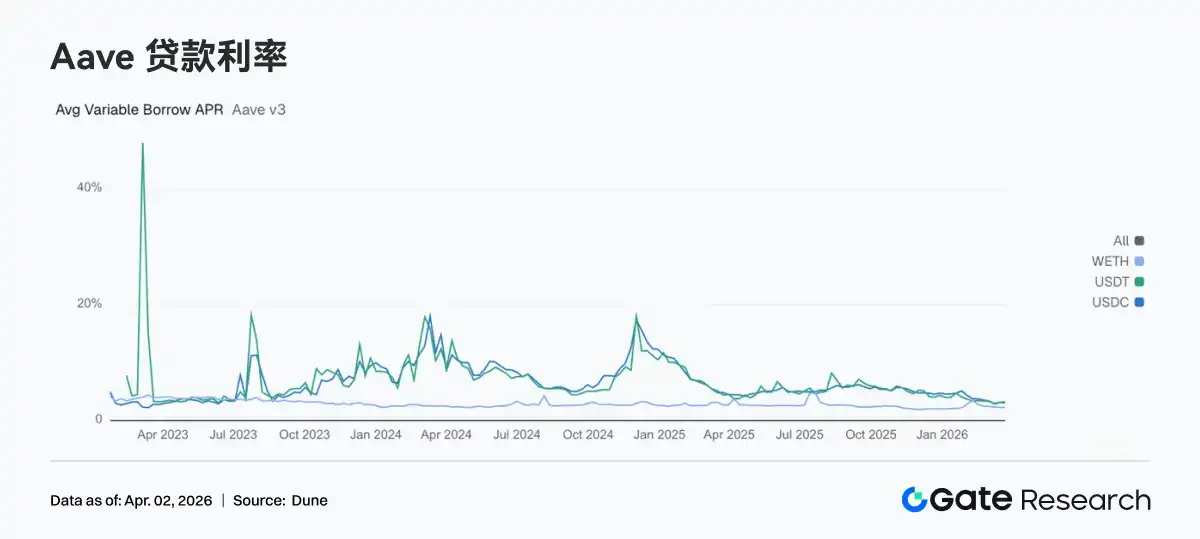
3.5 Divergence in Aave's Three Core Asset Lending Rates Continues

The average floating borrowing APR for USDC rose from 3.10% to 3.23%; demand for USD stablecoins did not weaken同步 with the decline in total loan balance this week. In contrast, USDT fell from 3.10% to 3.02%, and WETH also slightly decreased from 2.25% to 2.23%. While compressing broad risk exposure on-chain this week, lending demand became more concentrated on USDC. From a strategic perspective, this typically corresponds to institutions preferring USDC for liquidity scheduling, collateral management, and neutral strategy turnover. Combined with Aave's latest governance progress, the risk isolation and liquidity routing framework of V4 is gradually becoming clearer. Divergence in interest rates between different assets is likely to become more frequent in the future, better reflecting true capital preferences.

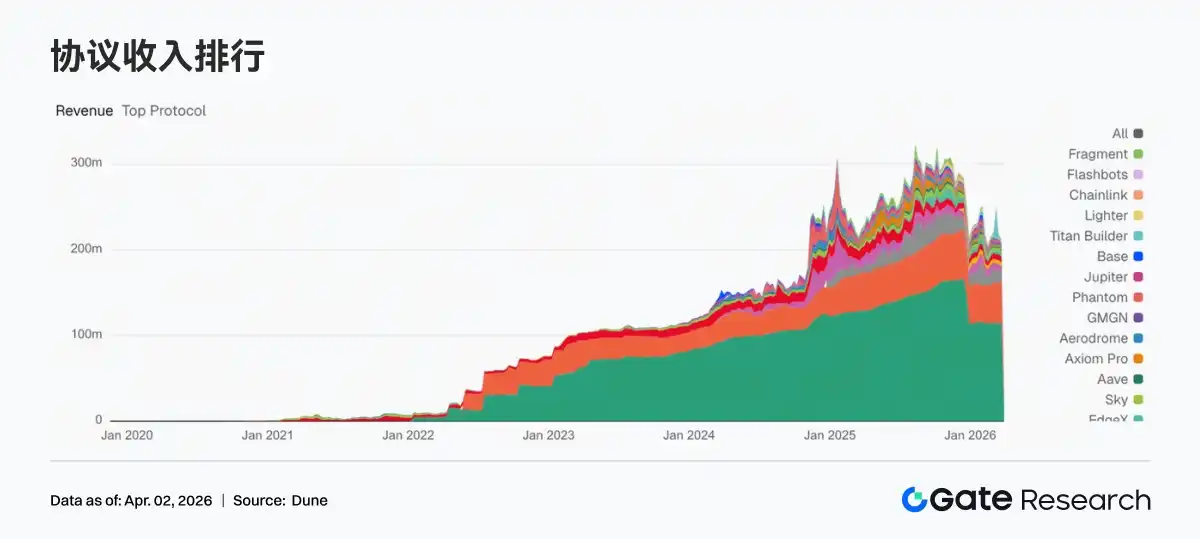
3.6 Protocol Revenue Shifts from Transaction-Driven Back to Stock-Driven

Revenue from trading protocols generally cooled down, while stablecoin issuers remained the most stable profit centers. Weekly revenue for Tether and Circle remained stable at high levels. In contrast, Hyperliquid declined from $14.3025 million to $12.6277 million, Pump fell from $7.1452 million to $6.6905 million, and EdgeX also dropped from $4.5534 million to $3.7969 million; the cooling trading activity has already transmitted to the revenue side. Overall, the main theme of protocol revenue this week was whose revenue is less dependent on short-term trading volatility.

4. Derivatives Tracking

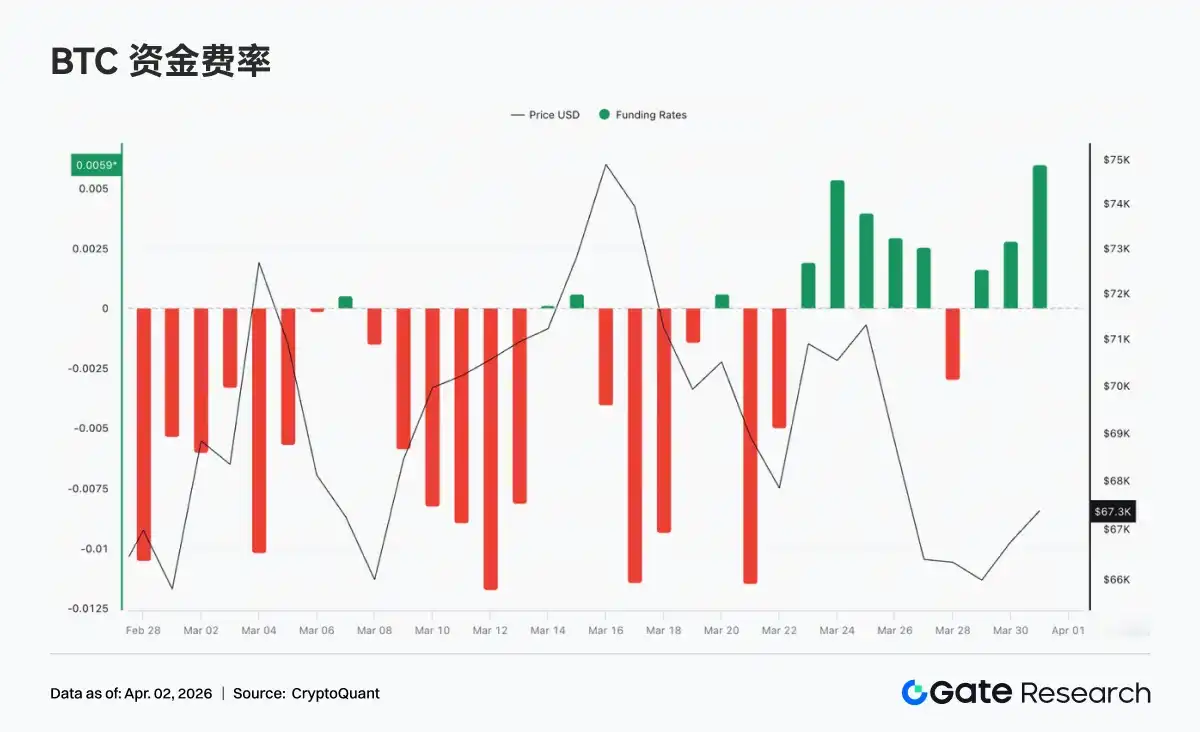
4.1 Funding Rates Shift to Short-Term Bullish, Sentiment Switches to Tentative Longing

BTC funding rates overall showed a structure of shifting from repair to briefly turning positive before fluctuating again. The previously long-standing deep negative, short-dominated pattern has明显 eased. Funding rates turned positive mid-week and remained for several days (peaking near +0.005), indicating the market switched to active long试探, with short-term risk appetite repairing and resonating with the阶段性 price rebound. However, this positive funding rate phase was short-lived and limited in intensity, failing to form a trend-positive premium structure.

4.2 Open Interest Rises Then Falls, Consolidates; Leveraged Funds Turn Watchful

Over the past week, BTC open interest first expanded to a阶段性 high alongside rising prices, but then quickly decreased to around $21B following the price pullback, indicating significant deleveraging in the market. Subsequently, open interest failed to return to previous highs, instead oscillating and repairing within the $21B–$22.5B range, with the overall center of gravity lower. New capital inflow momentum was insufficient, and leverage shifted from expansion to contraction. Overall, the current open interest structure is dominated by存量博弈 (stock game playing), lacking sustained volume配合, and the market remains in a震荡重建阶段 (oscillating rebuilding phase) after deleveraging.

4.3 Option Open Interest Concentrated in Medium-to-Long Term & High Strike Prices, Bullish Structure Prevails

BTC option open interest is mainly concentrated in medium-to-long term contracts like April and June, indicating the market is focused on medium-term positioning; structurally, Calls are significantly higher than Puts, overall still偏向 bullish. Looking at strike prices, Calls are主要集中在 the $80,000–$120,000 range, while Puts are distributed in the $60,000–$80,000 range, forming a typical structure of upside call speculation and downside hedging. It is worth noting that Put open interest in the $60K–$70K range is not low,表明 the market maintains medium-term bullish expectations while also strengthening short-term defensive sentiment.

4.4 Skew in Negative Territory, Short-Term Defensive Sentiment Still Dominates

Over the past week, the BTC 25D Skew overall remained in negative territory (approx. -6 to -10), with Puts still carrying a premium relative to Calls, indicating the market's assessment of downside risk remains relatively high. Shorter cycles (7D, 30D) were more volatile, falling rapidly before briefly repairing, reflecting反复 switching short-term sentiment; medium-to-long term (60D and above) was relatively stable, overall maintaining in the -5 to -7 range, showing little change in medium-term risk expectations. Overall, the Skew did not show a sustained recovery to near neutral or positive values, meaning that although there were repair attempts, defensive positioning still dominates.

4.5 Implied Volatility Stabilizes, Market Expects Limited Short-Term Volatility

Over the past week, the BTC DVol index overall oscillated within the 52%–55% range, first slightly declining then rising again, without a trend increase. The market's pricing of future volatility remains relatively restrained overall. During this period, prices experienced significant declines, but implied volatility only rose温和, without panic amplification, indicating the market did not view the current adjustment as a high-risk event. Overall, IV showed some desensitization from price, reflecting traders' inclination towards range-bound volatility expectations rather than unilateral trend行情 (market moves).

5. Week Ahead Outlook

6. Gate Institutional Dynamics

Refined Operations

1. Advancing data-driven and refined management,精准定位 customer needs, enriching customized solutions.

2. Significant results in dormant user activation.

Capital Business

1. Collateralized lending scale continues to grow, approaching bull market levels.

2. BTC interest rates下调, driving new demand growth.

Product & Technology

1. Websocket contract BBO real-time push achieved full availability in April.

2. AI gradually implemented, institutional services entering the AI-assisted operation phase.

Events & Marketing

1. CrossEx Advanced Trading Incentive Program launched, offering up to -0.01% contract rebate maker fees starting April 9th.

2. April Hong Kong Web3 Festival Side Event即将开启 (coming soon).

Data Sources:

• Investing, https://investing.com/currencies/xau-usd-historical-data

• Gate, https://www.gate.com/trade/BTC_USDT

• CMC, https://coinmarketcap.com/real-world-assets/?type=all-tokens

• Coinglass, https://www.coinglass.com/pro/depth-delta

• Dune, https://dune.com/gateresearch/gate-institutional-weekly-report

• CryptoQuant, https://cryptoquant.com/asset/btc/chart/derivatives

• Amberdata, https://pro.amberdata.io/options/deribit/btc/current/

Gate Research Institute is a comprehensive blockchain and cryptocurrency research platform, providing readers with in-depth content including technical analysis, hot topic insights, market reviews, industry research, trend predictions, and macroeconomic policy analysis.

Disclaimer

Cryptocurrency market investment involves high risks. It is recommended that users conduct independent research and fully understand the nature of the assets and products they purchase before making any investment decisions. Gate is not responsible for any losses or damages resulting from such investment decisions.

Preguntas relacionadas

QWhat was the main driver of the market last week and how did it impact cryptocurrency prices?

AThe main driver was the sharp escalation of the US-Iran conflict, which threatened the Strait of Hormuz. This caused WTI crude oil prices to surge nearly 17%, reigniting inflation expectations. As a result, US Treasury yields rose, putting pressure on high-valuation tech stocks. Cryptocurrencies, as high-risk assets, experienced significant selling, with weekly losses exceeding 6%.

QHow did the net flows for crypto ETFs perform last week, and what was the trend for BTC and ETH specifically?

ACrypto ETF flows showed a clear pattern of 'outflows first, followed by a recovery.' Mid-week, sentiment weakened rapidly, with spot ETFs seeing a combined net outflow of approximately $500 million. Specifically, outflows were about $296 million for BTC and $207 million for ETH, with the selling pressure concentrated on March 26-27. A marginal inflow occurred over the weekend, ending the multi-day outflow trend.

QWhat was notable about the trading volume of TradFi perpetual contracts on CEXs last week?

AThe trading volume of TradFi perpetual contracts on CEXs surged significantly last week. Notably, March 23rd set a new all-time high for trading volume. All sub-categories saw substantial growth, with commodities and metals recording the highest month-over-month increases.

QWhat was the trend for BTC funding rates last week, and what did it indicate about market sentiment?

ABTC funding rates shifted from a deep negative, bearish-dominated structure to briefly turning positive (reaching nearly +0.005) mid-week. This indicated a shift towards active long positioning and a repair in short-term risk appetite, resonating with a temporary price rebound. However, this positive rate phase was short-lived and of limited intensity, failing to establish a sustained positive premium structure.

QHow did the Aave lending market perform last week, and which specific market was a structural bright spot?

AThe total loan balance on Aave saw a slight decline compared to the previous week. The main Ethereum market and Plasma both decreased by approximately $100 million, showing deleveraging in mainstream markets. Multi-chain expansion also slowed. Mantle was a structural bright spot, with its loan scale increasing from $555 million to $574 million, representing a rare instance of growth.

Lecturas Relacionadas

Three Scenarios for BTC's Future Direction and a Duel Between Two Strong Forces | Special Invited Analysis

**Title: Three Scenarios for BTC's Future Trajectory and a Key Duel | Invited Analysis** The market remains at a critical juncture. Over the past week, Bitcoin (BTC) consolidated broadly between $79,500 and $80,600, validating previous technical analysis. The current focus is on whether this marks the start of a new uptrend or a pause within a larger correction. **BTC Multi-Cycle Analysis & Three Possible Scenarios** BTC's daily chart structure, following its peak at $126,200 in October 2025, presents three primary technical scenarios based on Elliott Wave theory: 1. **Bullish Scenario (End of Correction):** The corrective A-B-C wave from $126,200 ended at the $60,000 low in February 2026. The current price action is the start of a major Wave I uptrend. A subsequent Wave II pullback would not break below $60,000. 2. **Bearish Scenario 1 (Complex Correction):** The correction is unfolding as an A-B-C-D-E pattern. The current move from $60,000 is a D-wave rally. After its completion, a final E-wave decline could potentially breach the $60,000 level. 3. **Bearish Scenario 2 (Larger Correction):** The entire move down from $126,200 to $60,000 was a large A-wave. The current rally is a B-wave correction within a larger A-B-C structure, to be followed by a C-wave decline below $60,000. *Analysis suggests Scenario 2 is less probable due to time disproportions between waves. The battle is effectively between the Bullish Scenario (1) and Bearish Scenario (3).* **Key BTC Levels & Weekly Strategy** On the 4-hour chart, BTC trades above a crucial consolidation zone ("Central Pivot C"). * **Key Resistance:** $83,500-$84,500; $89,000-$90,500. * **Key Support:** $78,500-$79,500 (pivot upper bound); $73,500-$75,000; $69,500-$70,500. **Weekly Outlook:** The market direction hinges on BTC's ability to hold above or break below the $78,500-$79,500 support zone. * **Mid-term Strategy:** Neutral/Wait-and-see stance due to unclear direction. * **Short-term Tactics:** Two contingency plans using 30% max capital: * **Plan A (Bullish):** Look for long entries if price holds above $78,500-$79,500 with confirming signals. Initial stop-loss below $78,500. * **Plan B (Bearish):** Consider short positions if price breaks below $73,500-$75,000 with confirming signals. Initial stop-loss above $76,500. **HYPE Analysis & Strategy** HYPE's daily chart shows a seven-segment structure from its January low of $20.46, forming a "rising pivot" zone. * **Key Level to Watch:** $45.76 (previous high). A break above would confirm the bullish structure remains intact. * **Short-term Strategy:** Focus on pivot zone boundaries ($38.41 upper, $34.44 lower). * **Long:** Consider on support near $38.41 with bullish confirmation signals. * **Short:** Consider on a break below $34.44 with bearish confirmation signals. * Position size must be below 30% with strict stop-loss discipline. **Risk Management Reminder:** Always set an initial stop-loss upon entry. Move stop-loss to breakeven at +1% profit, then trail it upwards to lock in profits dynamically. All views are based on technical analysis for informational purposes only and do not constitute investment advice. The market is inherently risky.

Odaily星球日报Hace 2 min(s)

Three Scenarios for BTC's Future Direction and a Duel Between Two Strong Forces | Special Invited Analysis

Odaily星球日报Hace 2 min(s)

Sequoia Interview with Hassabis: Information is the Essence of the Universe, AI Will Open Up Entirely New Scientific Branches

Demis Hassabis, co-founder and CEO of Google DeepMind and Nobel laureate, discusses the path to AGI and its profound implications in a Sequoia Capital interview. He outlines his lifelong dedication to AI, tracing his journey from game development (e.g., *Theme Park*)—a perfect AI testing ground—to neuroscience and finally founding DeepMind in 2009. He emphasizes the critical lesson of being "5 years, not 50 years, ahead of time" for successful entrepreneurship. Hassabis reiterates DeepMind's two-step mission: first, solve intelligence by building AGI; second, use AGI to tackle other complex problems. He highlights the transformative potential of "AI for Science," particularly in biology where tools like AlphaFold have revolutionized protein folding. He envisions AI-powered simulations drastically shortening drug discovery from years to weeks and enabling personalized medicine. Furthermore, he predicts AI will spawn new scientific disciplines, such as an engineering science for understanding complex AI systems (mechanistic interpretability) and novel fields enabled by high-fidelity simulators for complex systems like economics. He posits a fundamental worldview where information, not just matter or energy, is the essence of the universe, making AI's information-processing core uniquely suited to understanding reality. He defends classical Turing machines as potentially sufficient for modeling complex phenomena, including quantum systems, as demonstrated by AlphaFold. On consciousness, Hassabis suggests first building AGI as a powerful tool, then using it to explore deep philosophical questions. He believes components like self-awareness and temporal continuity are necessary for consciousness but that defining it fully remains an open challenge. He predicts AGI could arrive around 2030 and, once achieved, would be used to probe the deepest questions of science and reality, much as envisioned in David Deutsch's *The Fabric of Reality*.

链捕手Hace 20 min(s)

Sequoia Interview with Hassabis: Information is the Essence of the Universe, AI Will Open Up Entirely New Scientific Branches

链捕手Hace 20 min(s)

Morgan Stanley 2026 Semiconductor Report: Buy Packaging, Buy Testing, Buy China Chips, Avoid Traditional Tracks

Morgan Stanley 2026 Semiconductor Report: Buy Packaging, Buy Testing, Buy Chinese Chips; Avoid Traditional Segments. The core theme is the shift in AI compute supply from NVIDIA dominance to a three-track system of GPU + ASIC + China-local chips. The key opportunity is capturing share in this expansion, while non-AI semiconductors face marginalization due to resource reallocation to AI. Key investment conclusions, in order of priority: 1. **Advanced Packaging (CoWoS/SoIC) - Highest Conviction**: TSMC is the primary beneficiary of explosive demand, driven by massive cloud capex. Its pricing power and AI revenue share are rising significantly. 2. **Test Equipment - Undervalued & High-Growth Certainty**: Chip complexity is causing test times to double generationally, structurally driving handler/socket/probe card demand. Companies like Hon Hai Precision (Foxconn), WinWay, and MPI offer compelling value. 3. **China AI Chips (GPU/ASIC) - Long-Term Irreversible Trend**: Export controls are accelerating domestic substitution. Companies like Cambricon, with firm customer orders and SMIC's 7nm capacity support, are positioned to benefit from lower TCO (30-60% vs NVIDIA) and growing local cloud demand. 4. **Avoid Non-AI Semiconductors (Consumer/Auto/Industrial)**: These segments face a weak, structurally hindered recovery due to AI's resource "crowding-out" effect on capacity and supply chains. 5. **Memory - Severe Internal Divergence**: Strongly favor HBM (Hynix primary beneficiary) and NOR Flash (Macronix). Be cautious on interpreting price rises in DDR4/NAND as true demand recovery. The report emphasizes a 2026-2027 time window, stating the AI capital expenditure cycle is far from over. Key macro variables include persistent export controls and AI's systemic "crowding-out" effect on traditional semiconductor supply chains.

marsbitHace 1 hora(s)

Morgan Stanley 2026 Semiconductor Report: Buy Packaging, Buy Testing, Buy China Chips, Avoid Traditional Tracks

marsbitHace 1 hora(s)

Circle:Sluggish Market? The Top Stablecoin Stock Continues to Expand

Circle, the issuer of the stablecoin USDC, reported its Q1 2026 earnings on May 11th, Eastern Time. Against a backdrop of weak crypto market sentiment, USDC's average circulation in Q1 was $752 billion, with a modest 2% sequential increase to $770 billion by quarter-end. New minting volumes declined due to the poor crypto market, but remained high, indicating demand expansion beyond crypto trading. USDC's market share remained stable at 28% of the total stablecoin market, while competition from Tether's USDT persists. A key highlight was "Other Revenue," which reached $42 million, more than doubling year-over-year, though sequential growth slowed to 13%. This revenue stream, including fees from services like Web3 software, the Cipher payment network (CPN), and the Arc blockchain, is critical for diversifying away from interest income. Circle's internally held USDC share increased to 18%, helping to improve gross margin by 130 basis points to 41.4% by reducing external sharing costs. However, profitability was pressured as total revenue growth slowed, primarily due to the significant weight of interest income, which is tied to USDC规模 and Treasury rates. Adjusted EBITDA was $133 million with a 19.2% margin. Management maintained its full-year 2026 guidance for adjusted operating expenses ($570-$585 million) and other revenue ($150-$170 million). The long-term target for USDC's CAGR remains 40%, though near-term volatility is expected. The article concludes that while Circle's current valuation of $28 billion appears reasonable after a recent recovery, further upside depends on the pace of stable币 adoption and potential positive sentiment from the advancement of regulatory clarity acts like CLARITY.

链捕手Hace 1 hora(s)

Circle:Sluggish Market? The Top Stablecoin Stock Continues to Expand

链捕手Hace 1 hora(s)

Tech Stocks' Narrative Is Increasingly Relying on Anthropic

The narrative of tech stocks is increasingly relying on Anthropic. Anthropic, the AI company behind Claude, has become central to the financial stories of major tech giants. Elon Musk dissolved xAI, merging it into SpaceX as SpaceXAI, and secured an exclusive deal to rent the massive "Colossus 1" supercomputing cluster to Anthropic. In return, Anthropic expressed interest in future space-based compute collaborations. Google and Amazon are also deeply invested. Google plans to invest up to $40 billion and provide significant compute power, while Amazon holds a 15-16% stake. Both companies reported massive quarterly profit surges largely due to valuation gains from their Anthropic holdings. Crucially, Anthropic has committed to multi-billion dollar cloud compute contracts with both Google Cloud and AWS. This creates a clear divide: the "A Camp" (Anthropic-Google-Musk) versus the "O Camp" (OpenAI-Microsoft). The A Camp's strategy intertwines equity, compute orders, and profits, making Anthropic a "systemic financial node." Its performance directly impacts its partners' financials and stock prices. In contrast, OpenAI, while leading in user traffic, faces commercialization challenges, lower per-user revenue, and a recently restructured relationship with Microsoft. The AI industry is shifting from a race for raw compute (symbolized by Nvidia) to a focus on monetizable applications, where Anthropic currently excels. However, this concentration of market hope on one company amplifies systemic risk. The rise of powerful open-source models like DeepSeek-V4 poses a significant threat, as they could undermine the value proposition of closed-source models like Claude. The article suggests ongoing geopolitical efforts to suppress such competitors will be a long-term strategic focus for Anthropic's allies.

marsbitHace 1 hora(s)

Tech Stocks' Narrative Is Increasingly Relying on Anthropic

marsbitHace 1 hora(s)

Trading

Spot
Futuros

Artículos destacados

Cómo comprar CORE

¡Bienvenido a HTX.com! Hemos hecho que comprar CORE (CORE) sea simple y conveniente. Sigue nuestra guía paso a paso para iniciar tu viaje de criptos.Paso 1: crea tu cuenta HTXUtiliza tu correo electrónico o número de teléfono para registrarte y obtener una cuenta gratuita en HTX. Experimenta un proceso de registro sin complicaciones y desbloquea todas las funciones.Obtener mi cuentaPaso 2: ve a Comprar cripto y elige tu método de pagoTarjeta de crédito/débito: usa tu Visa o Mastercard para comprar CORE (CORE) al instante.Saldo: utiliza fondos del saldo de tu cuenta HTX para tradear sin problemas.Terceros: hemos agregado métodos de pago populares como Google Pay y Apple Pay para mejorar la comodidad.P2P: tradear directamente con otros usuarios en HTX.Over-the-Counter (OTC): ofrecemos servicios personalizados y tipos de cambio competitivos para los traders.Paso 3: guarda tu CORE (CORE)Después de comprar tu CORE (CORE), guárdalo en tu cuenta HTX. Alternativamente, puedes enviarlo a otro lugar mediante transferencia blockchain o utilizarlo para tradear otras criptomonedas.Paso 4: tradear CORE (CORE)Tradear fácilmente con CORE (CORE) en HTX's mercado spot. Simplemente accede a tu cuenta, selecciona tu par de trading, ejecuta tus trades y monitorea en tiempo real. Ofrecemos una experiencia fácil de usar tanto para principiantes como para traders experimentados.

192 Vistas totalesPublicado en 2024.12.13Actualizado en 2025.03.21

Cómo comprar CORE

Discusiones

Bienvenido a la comunidad de HTX. Aquí puedes mantenerte informado sobre los últimos desarrollos de la plataforma y acceder a análisis profesionales del mercado. A continuación se presentan las opiniones de los usuarios sobre el precio de CORE (CORE).

活动图片