Author: Eric SJ

Web3 is transitioning from the “user growth era” to the “business model validation era.” In a previous article, I discussed five already-validated Web3 business models:
-
Transaction Fees
-
Stablecoin Reserve Yield
-
Funding Rate Spread
-
Block Space Sales
-
Protocol-Level Service Fees
These models answer the question: How do they make money? But two more critical questions remain:
-
Some revenue streams look “sexy,” but may not be sustainable long-term.
-
Some revenue streams appear slow but may hold greater business value.
A formula to explain: Revenue = User Demand × Usage Scale × Pricing Power × Market Environment
For example, a protocol earning $100 million a year might represent a genuine commercial loop, or it might just be riding a market cycle. The question is the sustainability of that cycle (e.g., the previous Pump).
Money earned during a casino's peak season and money earned from infrastructure rent might both be revenue, but their future prospects differ.
This article will deconstruct these five validated Web3 business models from the perspectives of their revenue drivers and long-term economic moats.
1. Transaction Fee Revenue: Looking at Trading Volume and User Activity
Transaction fees are the easiest-to-understand business model in Web3. The logic is simple: Trading Revenue = Trading Volume × Fee Rate
Thus, the factors influencing revenue are easy to break down.
Trading volume and market activity show a positive correlation, the most obvious variable in the transaction fee model.
In bull markets, asset prices rise, users' willingness to trade increases, leverage demand grows, and trading volume naturally rises. Therefore, revenue for CEXs, DEXs, and Perp DEXs grows rapidly.
But in bear markets, user trading and leverage demand decline simultaneously, and fee revenue also drops significantly.
-
This is why the transaction fee model's revenue is the most cyclical.
At the same time, an increase in trading volume doesn't necessarily mean the business model and its loop are stronger. What's more important is whether your volume comes from genuine user growth or just short-term incentive-driven traffic.
Take Hyperliquid @HyperliquidX as an example. Its future revenue growth depends not only on the overall perpetual contract market size but also on whether it can continue to attract: on-chain traders and market makers, which are the foundation of liquidity.
Because what trading platforms are truly competing for is not the product, but the liquidity network.
Next is the fee rate.
Trading platforms cannot raise fees indefinitely because the fee itself is a competitive tool. When competition intensifies: reducing fees, rebating fees, and increasing user incentives all affect the final revenue.
Therefore, the long-term growth of the transaction fee model requires simultaneously satisfying: market expansion, increasing market share, and stable fee rates.
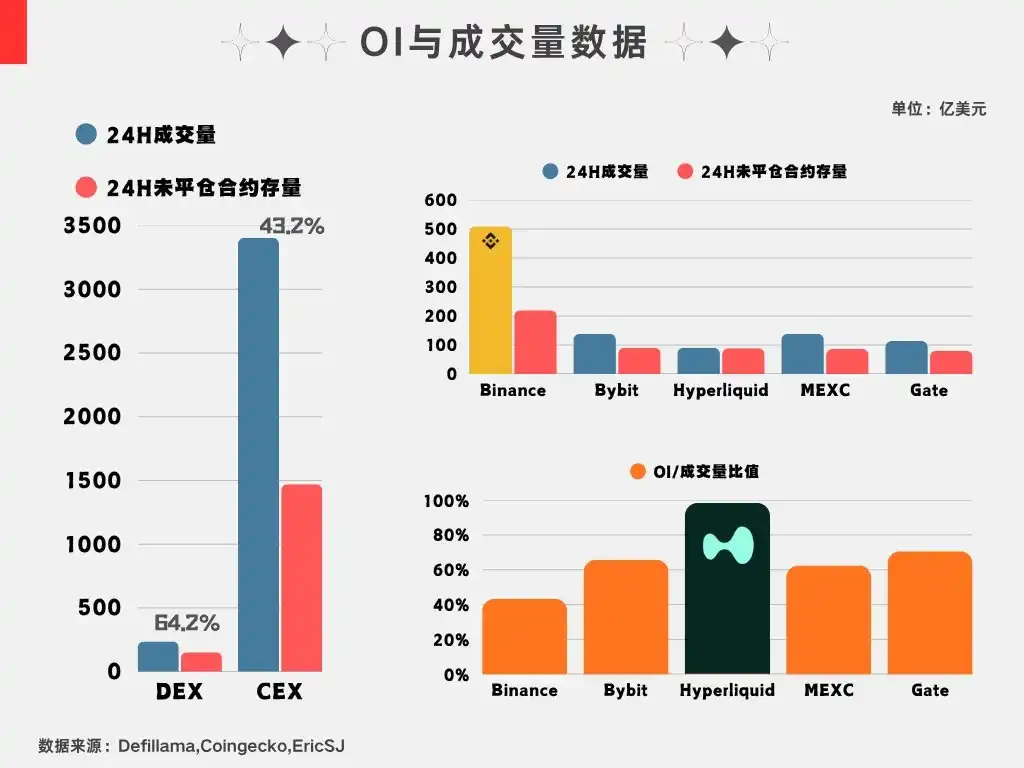
Early DEXs and current Perp DEXs, to compete, have attracted funds into their protocols for trading through 0% fees to increase their market share. But this raises a question worth pondering: When fees return to normal levels, are those funds still willing to stay in the protocol?
The OI indicator is a good parameter. The chart below shows OI data I compiled last month. In the current environment with no major overall changes, this to some extent reflects the willingness of funds to keep their risk exposure in a particular place.
2. Stablecoin Revenue: Primarily Looking at Scale and Interest Rate Environment
The stablecoin reserve yield model is essentially: Revenue = Stablecoin Scale × Reserve Asset Yield Rate. Therefore, the influencing factors are these two.
First, scale, the most critical variable. USDT and USDC revenue come from how much dollar-denominated assets are deposited on-chain.
If the stablecoin supply grows, reserve scale expands, and revenue naturally increases; conversely, if the scale decreases, revenue is also affected.
-
The chart below shows Tether's scale for Q1 2026, achieving approximately $1.04 billion in net profit at such scale.
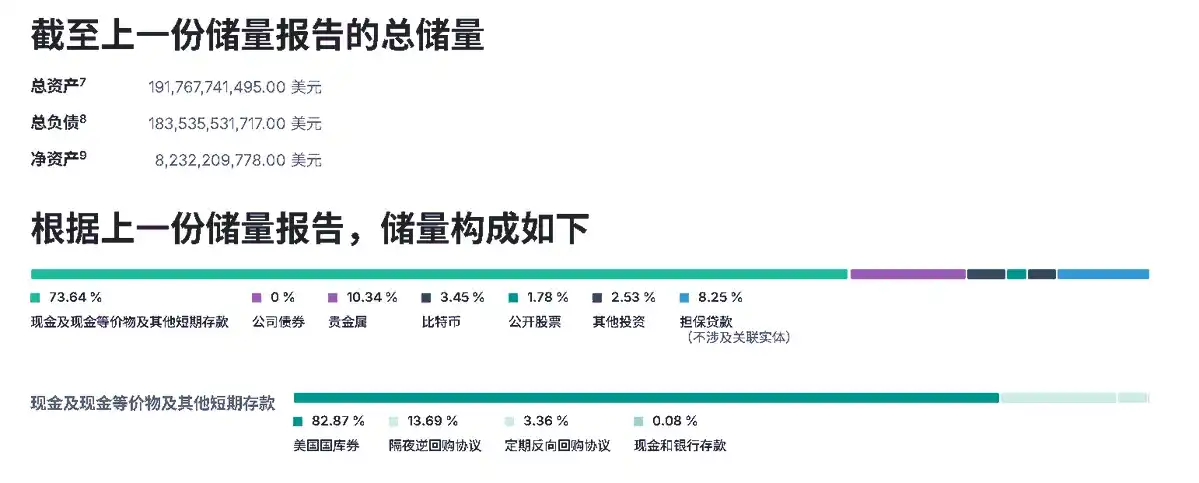
Therefore, the core competition for stablecoins is not just issuing more tokens, but which one can become the dollar infrastructure on-chain. In other words, in the current compliance context, which stablecoin can become the issuance entry point determines the thickness of its future economic moat.
The second factor is the interest rate environment.
Stablecoin issuers typically allocate to: US Treasuries, money market funds, and cash equivalents. Thus, their revenue is highly dependent on the risk-free interest rate. Reserve yield increases in a high-rate environment; it decreases in a low-rate environment.
Therefore, even if stablecoin scale continues to grow, issuer revenue can still be affected by interest rate cycles. However, this model has a remarkable point: it doesn't experience huge volatility, growth is predictable (the flip side is a lack of imagination), and once funds enter, they are not easily moved in the short term.
Moreover, large funds tend to gravitate towards time-tested “brands.” That is, the longer something exists, the thicker its moat becomes, which is why it's increasingly difficult for new stablecoins to capture market share.
And this market is slowly opening up new incremental channels. Once a project is adopted as a traditional entry point onto the chain, it becomes a stable cash cow.
3. Funding Rate Spread Revenue: Looking at Capital Demand and Risk Management
In the funding rate spread model, I previously gave two examples: Aave lending and Ethena funding rate arbitrage.
Their essence is profiting from the supply-demand imbalance of capital.
Take Aave as an example. Revenue comes from borrowing demand. In an uptrend cycle, user risk appetite increases, using loans to amplify leverage further. This is the source of demand, driving capital utilization and protocol revenue growth. The logic is the same as the transaction fee cycle, both stemming from risk appetite.
4. Block Space Revenue: Primarily Looking at On-Chain Activity
The block space sales model is also clear: Revenue = Block Space Demand × Gas Unit Price.
The structure is simple, but it's worth discussing because this model has some revenue expectation issues (in my opinion).
Theoretically, the more on-chain users, transactions, and applications, the higher the block space demand, and revenue naturally increases, because an unused highway has no fee-collecting value.
However, the Gas unit price is a hard constraint. Looking at industry trends, Gas has been on a declining trend, which actually impacts revenue.
Add competition between different chains—Ethereum, Solana, L2s, DA layers all form competitive relationships—and Gas fees become even more competitive. Many chains frequently launch 0-Gas activities to attract liquidity and boost on-chain activity.
This involves a game between demand growth and unit price decline.
Take Ethereum. Two cycles ago, Ethereum's logic was simple: Limited block space → users compete for transaction ordering → demand increases → Gas rises → network revenue increases;
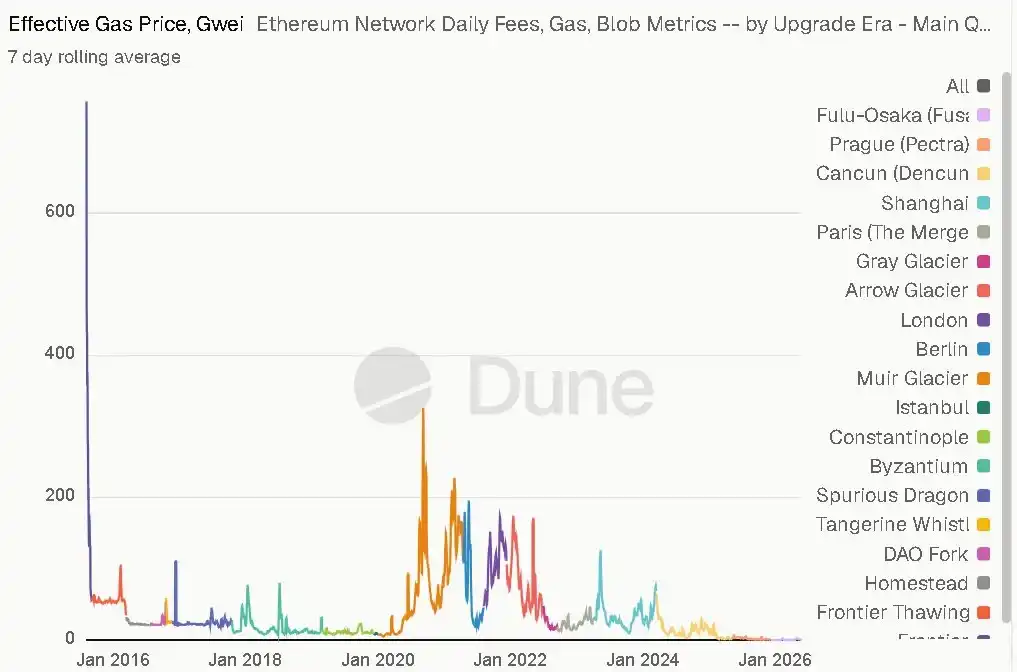
But with the emergence of more chains, improved transaction execution efficiency, and more alternative options in the market, Gas has been driven down. This creates a commercial contradiction:
-
On one hand: More users and applications need block space;
-
On the other hand: Technological advancements continuously reduce block space costs.
For users, this is good because transactions become cheaper. But for chains acting as “block space suppliers”: unit revenue declines.
This is somewhat similar to internet infrastructure development. Early on, bandwidth was scarce and expensive. Later, as bandwidth continually expanded, prices kept falling. Ultimately, market value doesn't solely belong to those providing underlying resources, but concentrates more on those with users, ecosystems, and platform capabilities.
Therefore, the core question for the future block space business model isn't just: “Is there demand?”
But rather: Can demand growth offset the decline in unit price?
5. Protocol-Level Service Fees: Looking at Usage Scale and Positioning
Infrastructure service fees are more like the Web3 version of SaaS. Oracles are a typical example.
Its revenue mainly comes from the B-side: continuous usage by project teams.
The more projects using the protocol, the larger the revenue scale, and migration costs become significant. Once integrated, the cost to replace is high.
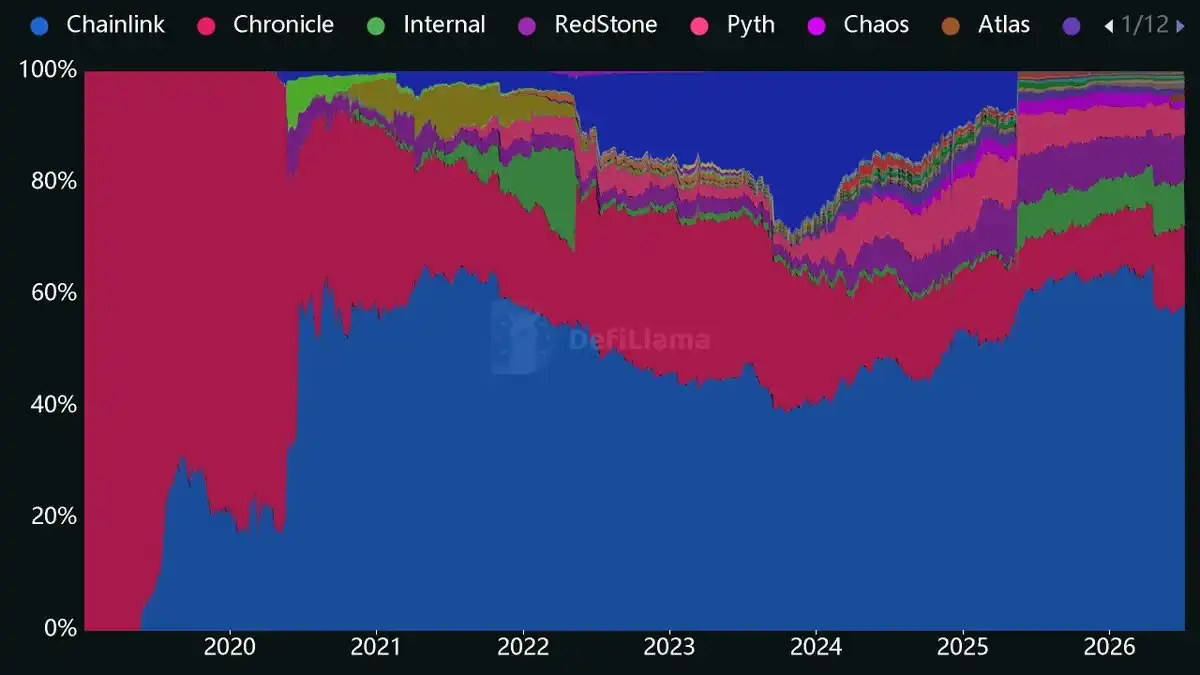
However, there's a prerequisite: it must become the industry standard itself. For example, the current Chainlink occupies well over half of the oracle market share. As a result, other projects in this sector have little competitive space; the moat is very thick. Even if a cheaper product appears, it's difficult to easily displace existing B-side integrations.
This type of infrastructure sells not a one-time product, but rather: an ecosystem position. Therefore, its long-term value depends on: whether more and more projects build around it.
Summary
Comparing the five business models together:
1. Both the transaction fee and funding rate spread models are highly cyclical, driven fundamentally by the risk appetite of on-chain capital.
2. Both the stablecoin reserve yield and protocol-level service fee models, once established, have very thick moats, rooted in the high migration costs on the supply side.
3. The block space sales model faces the persistent issue of declining unit prices. It requires consideration of the trade-off between scale and unit price. Valuing it purely based on revenue is quite unreasonable (at least currently).