Fragmentation drains up to $1.3B a year from tokenized assets: Report

cointelegraphPublished on 2025-12-19Last updated on 2025-12-19

Abstract

Fragmentation across blockchain networks is causing significant economic drain in the tokenized asset market, with inefficiencies costing up to $1.3 billion annually, according to a report from RWA.io. The lack of interoperability traps liquidity and prevents capital from moving freely, causing identical or economically equivalent real-world assets (RWAs) to trade at price differences of 1% to 3% across different chains. These inefficiencies hinder arbitrage and price discovery. Additionally, moving capital between chains results in transaction losses of 2% to 5% due to fees, slippage, and operational risks. If unresolved, these issues could escalate to $30–75 billion in annual losses as the tokenized RWA market grows to an estimated $16–30 trillion by 2030. Despite these challenges, tokenized assets continue gaining adoption, with recent moves by companies like Securitize and Coinbase to launch onchain stock trading.

Fragmentation across blockchain networks is already imposing a measurable economic cost on the tokenized asset market, with inefficiencies translating into up to $1.3 billion in annual value drag.

In a report sent to Cointelegraph, real-world asset (RWA) data provider RWA.io argued that while blockchains accelerated innovation, they also created walls that trap liquidity and prevent capital from moving freely across networks.

As a result, tokenized RWAs have increasingly behaved like disconnected markets rather than a single, unified financial system. The research found that identical or economically equivalent assets routinely trade at different prices across chains, while moving capital between networks remained costly and complex.

Researchers stated that these inefficiencies hinder the market’s ability to self-correct through arbitrage, a mechanism that facilitates efficient price discovery.

“This fragmentation is the single greatest impediment to the market realizing its multi-trillion-dollar potential,” said Marko Vidrih, co-founder and chief operating officer at RWA.io.

“In traditional finance, the EU-wide SEPA Instant mandate shows how value can move across accounts in seconds. Tokenized assets should be just as frictionless,” Vidrih added.

RWA market growth from 2020 to 2025. Source: RWA.io

Price inefficiencies and capital friction across chains

The report states that one of the most obvious consequences of fragmentation is the persistent price divergence for identical assets issued on different blockchains.

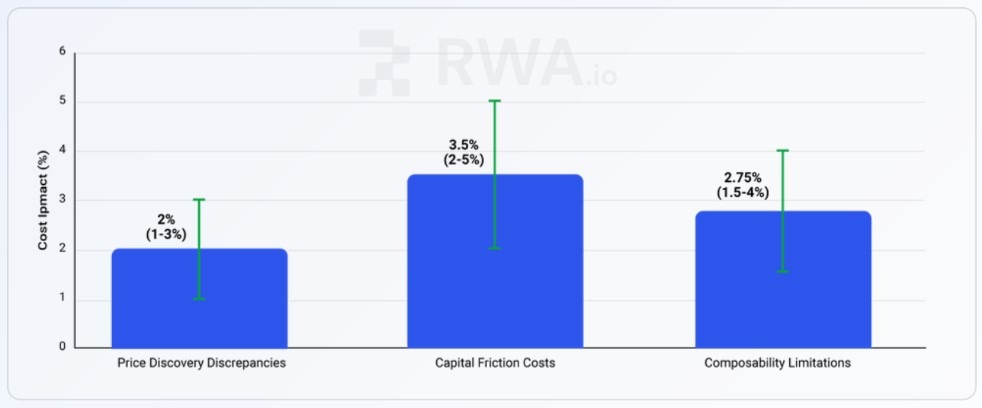
According to the report, economically identical tokenized assets often trade at spreads of 1% to 3% across major networks, despite representing claims on the same underlying assets. In traditional finance, arbitrage would quickly eliminate such market gaps.

However, crosschain arbitrage remains unviable due to technical hurdles, fees, delays and operational risks, the report claims. It states that the costs to relocate assets often exceed the price discrepancy, allowing inefficiencies to persist.

Beyond price discovery, RWA.io estimated that moving capital between non-interoperable chains results in losses of 2% to 5% per transaction. This is because of exchange fees, slippage, transfer costs, gas fees and timing risks. In aggregate, the report models an average loss of about 3.5% per capital reallocation.

Should these fragmentation patterns persist, RWA.io estimated that the friction costs could drain between $600 million $1.3 billion from the market annually.

Economic costs of market fragmentation. Source: RWA.io

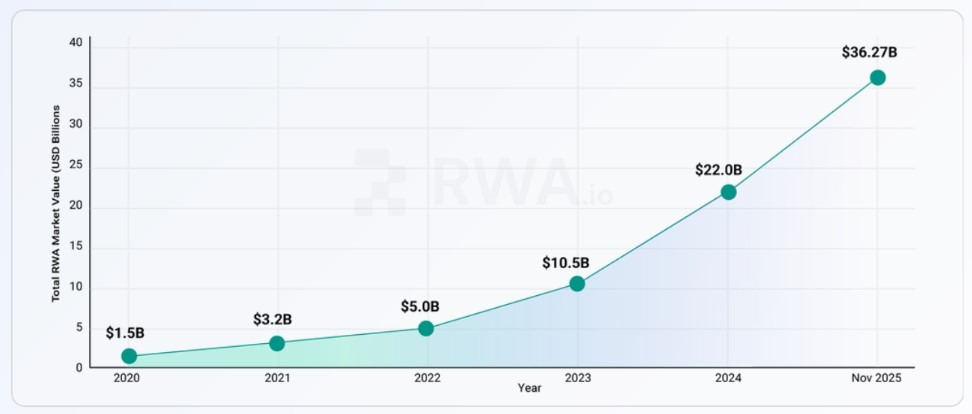
RWA.io projects that tokenized real-world assets could grow into a $16 trillion to $30 trillion market by 2030, and warns that if current inefficiencies persist, the associated value drag would scale with it.

Applying today’s fragmentation-related frictions to a market of that size implies potential annual losses of $30 billion to $75 billion, turning infrastructure shortcomings into a material constraint on long-term growth.

Related: Tokenized stocks may be onchain, but the SEC still wants the keys

Tokenized assets gain traction despite inefficiencies

Despite claims of inefficiency, tokenized assets continue to gain traction across both crypto-native platforms and traditional financial institutions. Just this week, companies have made moves to tokenize equities.

On Tuesday, RWA-focused company Securitize announced plans to launch compliant, onchain stock trading.

On Thursday, crypto exchange Coinbase launched a stock trading feature, allowing users to invest directly in stocks through its application.

Magazine: Koreans ‘pump’ alts after Upbit hack, China BTC mining surge: Asia Express

Related Questions

QWhat is the estimated annual economic cost of fragmentation on the tokenized asset market according to the RWA.io report?

AThe report estimates that fragmentation drains between $600 million and $1.3 billion from the tokenized asset market annually.

QWhat is identified as the 'single greatest impediment' to the tokenized asset market reaching its multi-trillion-dollar potential?

AFragmentation across blockchain networks is identified as the single greatest impediment to the market realizing its multi-trillion-dollar potential.

QWhat is the typical price spread for identical tokenized assets trading on different blockchains?

AEconomically identical tokenized assets often trade at spreads of 1% to 3% across major blockchain networks.

QWhy does cross-chain arbitrage fail to correct price inefficiencies in the tokenized asset market?

ACross-chain arbitrage remains unviable due to technical hurdles, fees, delays, operational risks, and the fact that the costs to relocate assets often exceed the price discrepancy.

QWhat is the projected size of the tokenized real-world asset market by 2030, and what could the associated losses be if fragmentation persists?

ARWA.io projects the market could grow to $16 trillion to $30 trillion by 2030. If current inefficiencies persist, the associated annual losses could scale to $30 billion to $75 billion.

Related Reads

Analyzing 10 Key BTC Top Indicators: Why Is the Current Bull Market Different from Previous Ones?

"Analysis of 10 Key Bitcoin Top Indicators: Why the Current Bull Run Differs from the Past" This analysis examines 10 classic on-chain and technical indicators to assess whether Bitcoin has reached its cycle top. Historically, market peaks were marked by multiple indicators flashing extreme overbought signals simultaneously. However, the current bull run (as of Q4 2025) shows notably divergent, more moderate readings. Key findings include: The Pi Cycle Top indicator has not yet triggered a crossover signal. The Puell Multiple remains in a moderate 1-2 range, indicating miner selling pressure is not extreme. The Bitcoin Rainbow Chart shows price is in the yellow-orange zone, not the red "sell" bubble territory. The MVRV Z-Score sits in a neutral 2-4 range, far from previous cycle peaks of 7-10. The Altcoin Season Index remains low (30-40), showing no major capital rotation from BTC to altcoins. Long-Term Holder (LTH) supply shows a slow distribution, but Short-Term Holder (STH) supply, while rising, did not peak concurrently with the price high on October 6th. Net Unrealized Profit/Loss (NUPL) has declined to 0.34 from a high of 0.64 in March 2024. The analysis concludes that the market's structure has fundamentally changed. The explosive, retail-driven peaks of 2017 and 2021 are being replaced by a more gradual, institutional-led market, largely attributed to Bitcoin ETF inflows providing stability. This suggests Bitcoin is transitioning from a cyclical asset to a mainstream reserve, making historical indicator thresholds less reliable and requiring adjusted analysis frameworks for future cycles.

深潮Hace 29 min(s)

Analyzing 10 Key BTC Top Indicators: Why Is the Current Bull Market Different from Previous Ones?

深潮Hace 29 min(s)

Trading

Spot
Futures

Discussions

Welcome to the HTX Community. Here, you can stay informed about the latest platform developments and gain access to professional market insights. Users' opinions on the price of A (A) are presented below.

活动图片