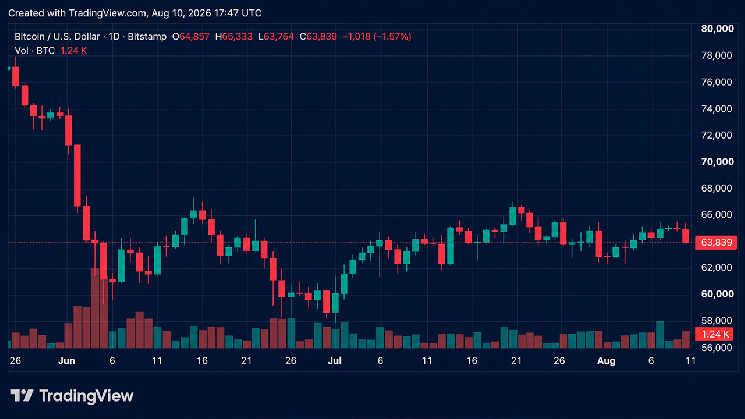
CryptoQuant analysts believe that the leading cryptocurrency is in a phase of forming a local top, after which the risk of a new sell-off remains high. At the same time, on-chain activity has returned to 2018-2019 levels, which may correspond to a market bottom formation structure, but is not a standalone buy signal.
Bitcoin Approaches Potential Top Zone
According to CryptoQuant's assessment, Bitcoin's current movement could be "wave iv" within a broader downtrend. It is characterized by weak momentum, complex price patterns, and prolonged movements, the statement said.
The first target of this wave in the $62,541-$67,894 range has already been reached. At the same time, analysts identify a more precise zone of $66,317-$68,965 where a local top could form. An alternative scenario with a continuation of the rally to $70,000 is also not ruled out.
After reaching these levels, the risk of transitioning to the next wave of selling will increase. Additional bearish signals cited by CryptoQuant include a bearish divergence between price and the MACD indicator, the RSI approaching overbought territory, and declining trading volumes during the six-week rally since July 1st.
In case the downward movement continues, the next target could be the $51,336 level, which is approximately 21% below current values. If Bitcoin first rises to $70,000, the potential drop is estimated at around 26%.
Network Activity Returns to 2018-2019 Levels
At the same time, on-chain data shows signs of a potential bottom formation. The 30-day and 100-day EMAs of active Bitcoin addresses recently dropped to levels close to those seen in 2018-2019, experts noted.
As of July 19th, the 30-day EMA was 609,688 addresses compared to 570,710 in July 2018. The 100-day EMA reached 621,957 on July 27th versus 605,433 in January 2019.
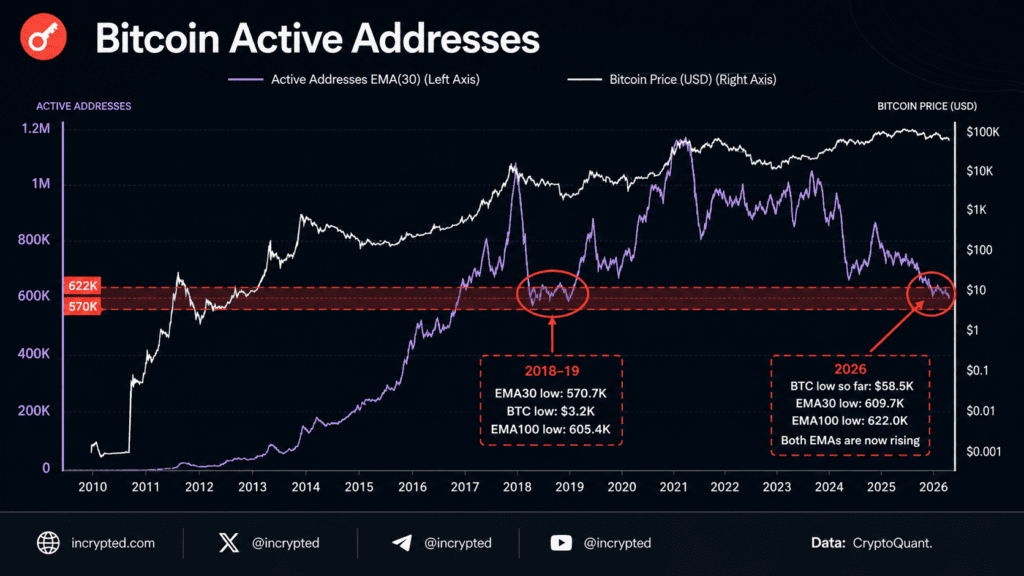
However, both indicators have turned upward after the July lows. As of August 8th, they stood at 664,764 and 640,603 addresses, respectively. Bitcoin also remains above the June low of $58,535, analysts emphasized.
According to CryptoQuant, this aligns with the hypothesis of a bottom forming, but historical data does not confirm it definitively and does not allow for determining the timing of a potential reversal.
The key levels remain 609,688 and 621,957 for the 30-day and 100-day EMAs respectively, as well as $58,535 for the Bitcoin price. Trading below the latter level would invalidate the current bottom formation hypothesis.
$67,000 and $72,000 Remain Key Resistance
An additional factor of pressure is the cost basis of recent buyers. According to UTXO Realized Price Age Bands data, the realized price of coins aged one to three months is around $67,000, while those aged three to six months is around $72,000, the message stated.
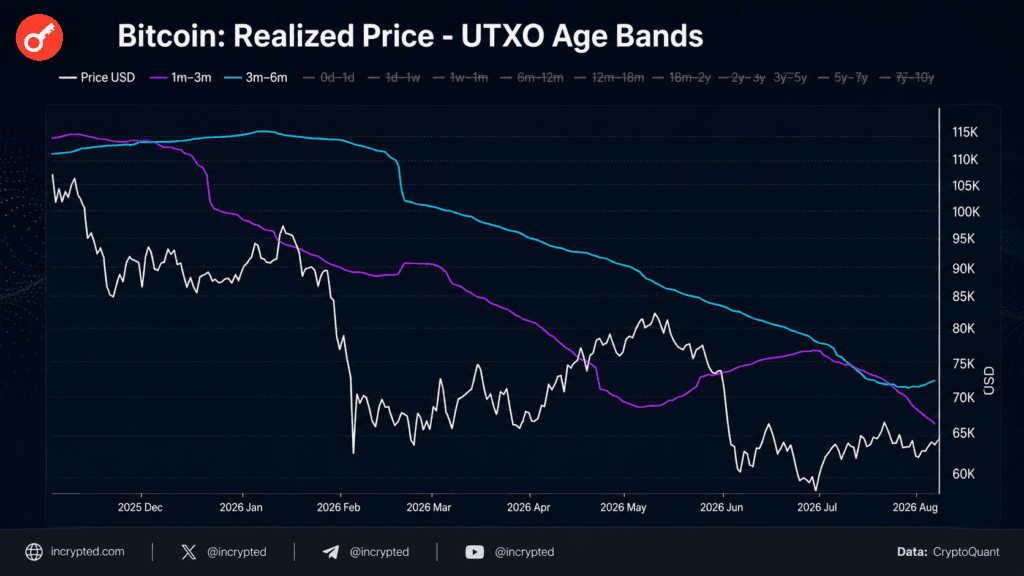
With the current price around $65,000, both cohorts are in the zone of unrealized losses. Therefore, the $67,000 level could become the first resistance point: holders of recently acquired coins may use a return to their cost basis to reduce positions.
The $72,000 level is the next threshold. Breaking through it would mean the market is absorbing potential supply from recent buyers and would strengthen the recovery scenario.
As long as Bitcoin remains below these levels, CryptoQuant maintains a cautious outlook and does not recommend viewing the current situation as a signal for large purchases. Analysts see stronger cyclical entry points near $51,000.
Recall that earlier, CryptoQuant named the $70,000 level as one that would determine Bitcoin's future fate.
end-content