In the analysis a month ago, the author repeatedly reminded investors that the rally starting near $80,600 was more likely a technical correction rather than a trend-level行情. Based on the structure, sentiment, and cycle判断 at that time, we needed to remain vigilant about the risk of a secondary decline after the rebound.
The actual performance of the current market恰好印证了 the author's analysis over the past few months, also illustrating that structural analysis often holds more reference value when sentiment is most optimistic.
Core Summary:
• Bitcoin fell below the key level of $80,600 last week, establishing a weekly level C-wave adjustment, consistent with the earlier judgment of the overall market trend structure.
• Strategy Execution (short-term) effectiveness verified: Last week's trading strictly followed the既定 strategy, completing one short-term operation (1x leverage), successfully achieving a 5.1% return.
• Core View (short-term) Verification: Early last week, the coin price rebounded to near the lower轨 of the rising channel (around $90,500), showing明显衰竭 of upward momentum, forming a technical pattern of "breakout pullback failure". Subsequently, the price fell rapidly,连续失守 multiple support levels, and finally broke below the $80,000 integer关口.
The following will详细回顾 the行情预判, strategy execution, and specific trading process.
I. Discussing Bitcoin's Decline from a Technical Angle
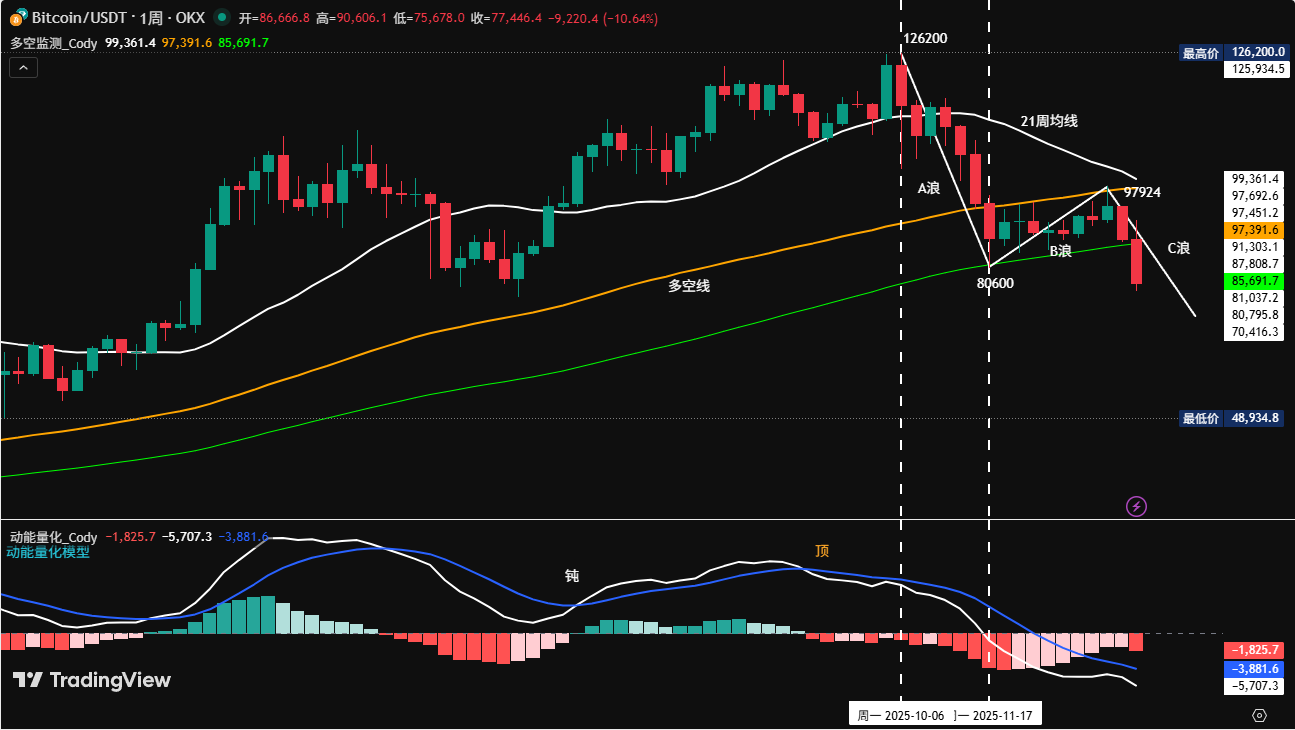
Figure 1
1. Continuity and Consistency Technical Analysis of Previous Bitcoin Price Structure:(See Figure 1)
• Bitcoin entered an adjustment phase after hitting a high of $126,200 on October 6, 2025, falling to $80,600 by November 21, lasting 46 days with a maximum decline of about 36%. Through our self-created trading system, we learned that after the market closed on November 24, Bitcoin's weekly price had fallen below the Bull-Bear Monitoring Model's bull-bear line (yellow line in Figure 1), while the white动能线 of the Momentum Quantification Model had fallen below the zero axis. These two signals formed a共振, leading us to judge that Bitcoin had entered a medium-term bearish trend. Therefore, the author pointed out in the weekly reviews on December 28, 2025, and January 4, 2026 that the rally starting from the low of $80,600 was of an oversold rebound nature.
• After Bitcoin's price rebounded to a high of $97,924 on January 16, 2026, market sentiment一度 turned optimistic, widely believing the adjustment was over and a new upward trend had begun. However, based on comprehensive judgment from our self-built models, we clearly stated in the weekly review on January 18 that the current行情 was still a "rebound, not a reversal", that the 21-week moving average would become the bull-bear分水岭; and also提示 that the current行情 was in the B-wave rebound stage, followed by a C-wave decline, which would also break below the B-wave starting point $80,600.
• In the weekly review on January 25, the author further analyzed from the price structure, pointing out that the adjustment from the high of $126,200 presented an A-B-C three-wave structure. The C-wave decline starting from $97,924 needed to first break below $80,600, with the next target looking at $75,200.
2. Technical Structure of the C-wave Adjustment and Key Support Analysis:(See Figure 1)
• A-wave: $126,200 to $80,600,历时 46 days, decline 36%.
• B-wave: $80,600 to $97,924,历时 54 days, gain 21.5%.
• C-wave: $97,924 to present, Downward key support and共振 logic:
• $74,500~$75,200 region (50% Fibonacci retracement of the A-wave decline and共振 region of the April 2025 adjustment low)
• $69,000~$72,500 region (61.8% Golden Ratio level of the A-wave decline and共振 region of a previous high, this region has strong support)
• $64,500~$65,500 region (Previous震荡中枢)
3. Although Bitcoin's price has fallen to around $75,000, the author believes that it is not appropriate to be overly bearish on the market at present. With continuously improving market liquidity and the impact of positive policy expectations, the probability of a deep price decline is reduced (this is also different from the adjustment after the November 2021 high of $69,000), but this may also lead to a prolonged C-wave adjustment time, forming a pattern of exchanging time for space.
II. Last Week's Market Review:(01.26~02.01)
1. Last Week's Short-term Operation Review: As shown in (Figure 2)
First,展示成果:

We strictly followed the trading signals issued by the self-built Spread Trading Model and Momentum Quantification Model mentioned in all previous articles, combined with预判 of the market trend, and completed one short-term operation, this trade盈利 10%.
Specific trade details and复盘如下:
Bitcoin 30-minute K-line chart:(Momentum Quantification Model + Spread Trading Model)
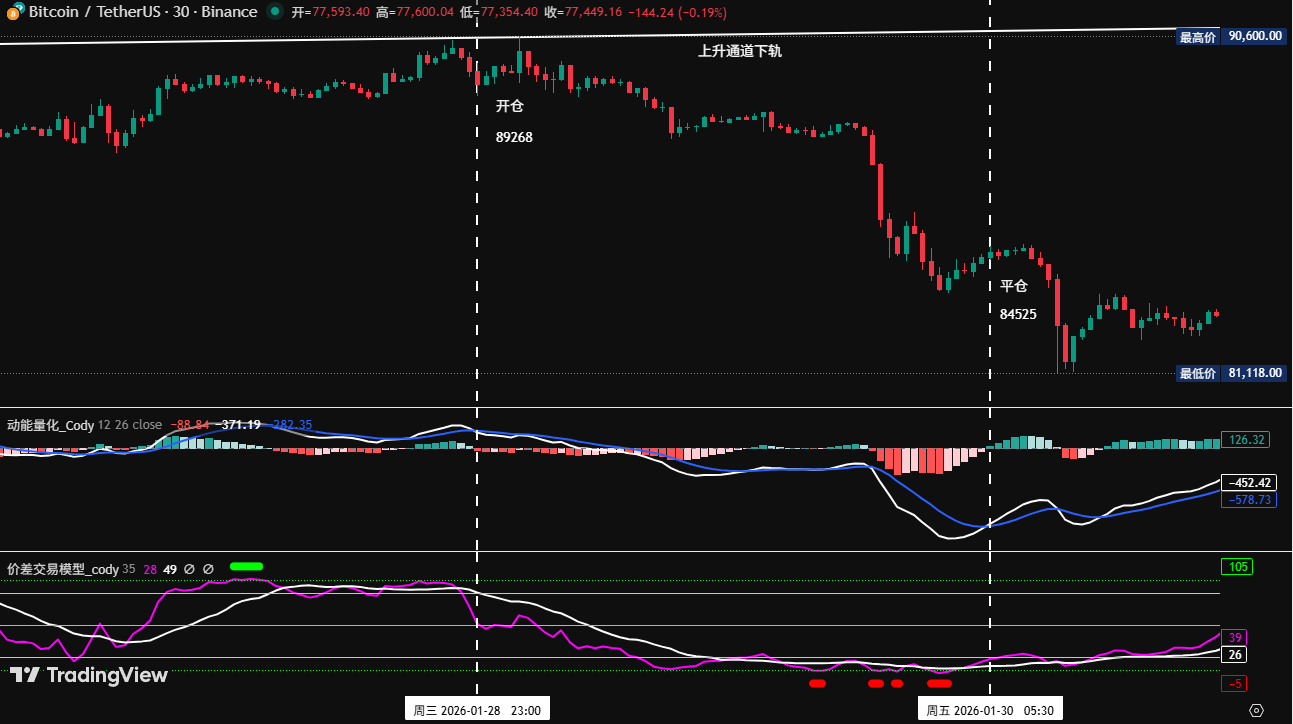
Figure 2
2. Short-term Trade Recap:
• First Trade (Profit 5.1%): This operation executed Plan A (Go short on effective break below the rising channel's lower轨) strategy: When the price pulled back to the lower轨 of the rising channel showing weak upward momentum, the Spread Model first issued a top预警 signal (green dot), then it and the Momentum Model共振 triggered a top signal. We established a 30% short position at $89,268, after which the market trend adjusted. When the price fell to the $84,000 support level, the Spread Model率先 issued a触底预警 signal (red dot),随后 the Momentum Quantification Model and Spread Trading Model again共振 generated a bottom signal. Based on this, we平仓 all positions at $84,525, achieving successful profitability.
2. Last Week's Trend Prejudgment and Operation Strategy Review:
1. Last Week's Core View: Focus on the effective confirmation after breaking below the rising channel's lower轨. If effectively broken, the price will accelerate adjustment, first target around $84,000.
2. Core Level Review:
Resistance watch $88,500~$91,200 region; Support watch $84,000, important support watch $80,000~$80,600 region.
3. Operation Strategy Review:
• Midline Strategy: Price pulled back to the rising channel's lower轨 to confirm the break was effective, we followed the plan and established a 60% short position near $89,000.
• Short-term Strategy: Because the price effectively broke below the rising channel's lower轨, choose Plan A to execute operations:
• Open Position: After effective break down and combined with model top signals, can establish a 30% short position.
• Risk Control: Initial stop loss for short positions set about 1.5% above the cost price(i.e., 1.015*cost price).
• Close Position: When falling near important support levels and combined with model signals, can gradually close positions to take profits.
III. Bitcoin Weekly and Daily Charts共振 Turning Bearish: Has the Bottom Been Reached?
Combining market operation, the author conducts a deep analysis of Bitcoin's price structure from multiple models and dimensions based on the self-built trading system.
1. As shown in (Figure 3), analysis from the weekly chart:
Bitcoin Weekly K-line chart:(Momentum Quantification Model+Sentiment Quantification Model)
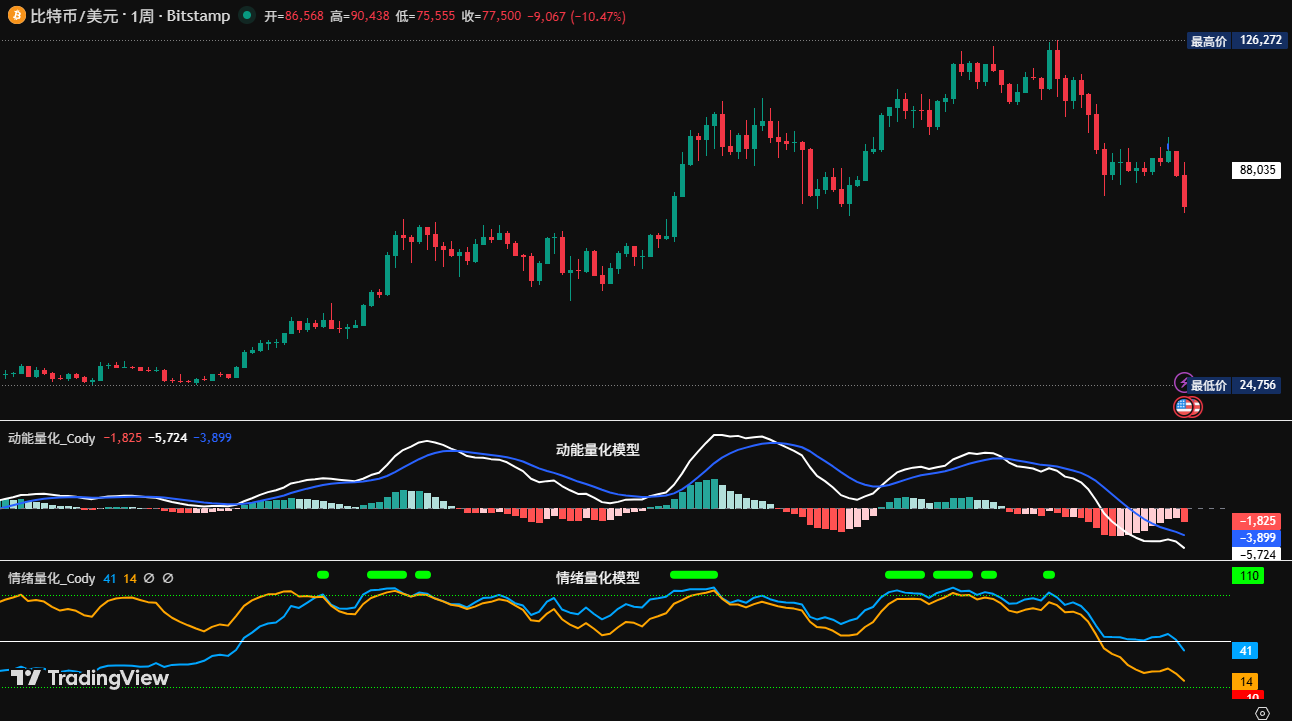
Figure 3
• Momentum Quantification Model: Technical indicators show that shorting momentum continued to be released last week, both momentum lines declined synchronously, negative energy bars turned放大, showing an accelerating adjustment state.
Momentum Quantification Model predicts: Coin price decline index: High
• Sentiment Quantification Model: Blue sentiment line value 41, strength zero; Yellow sentiment line value 13 (接近 bottom region), strength zero, peak value is 0.
Sentiment Quantification Model predicts: Coin price pressure and support index: Neutral
• Digital Monitoring Model: Monitoring (top/bottom) digital signals did not appear, accelerating decline.
Digital Monitoring Model predicts: Bottom signal not appeared; Weekly K-line closed with a large阴线, decline about 11.19%.
The above data predicts: Bitcoin weekly bearish trend, beware of震荡下跌 risk.
2. As shown in (Figure 4), analysis from the daily chart:
Bitcoin Daily K-line chart:(Momentum Quantification Model+Sentiment Quantification Model)
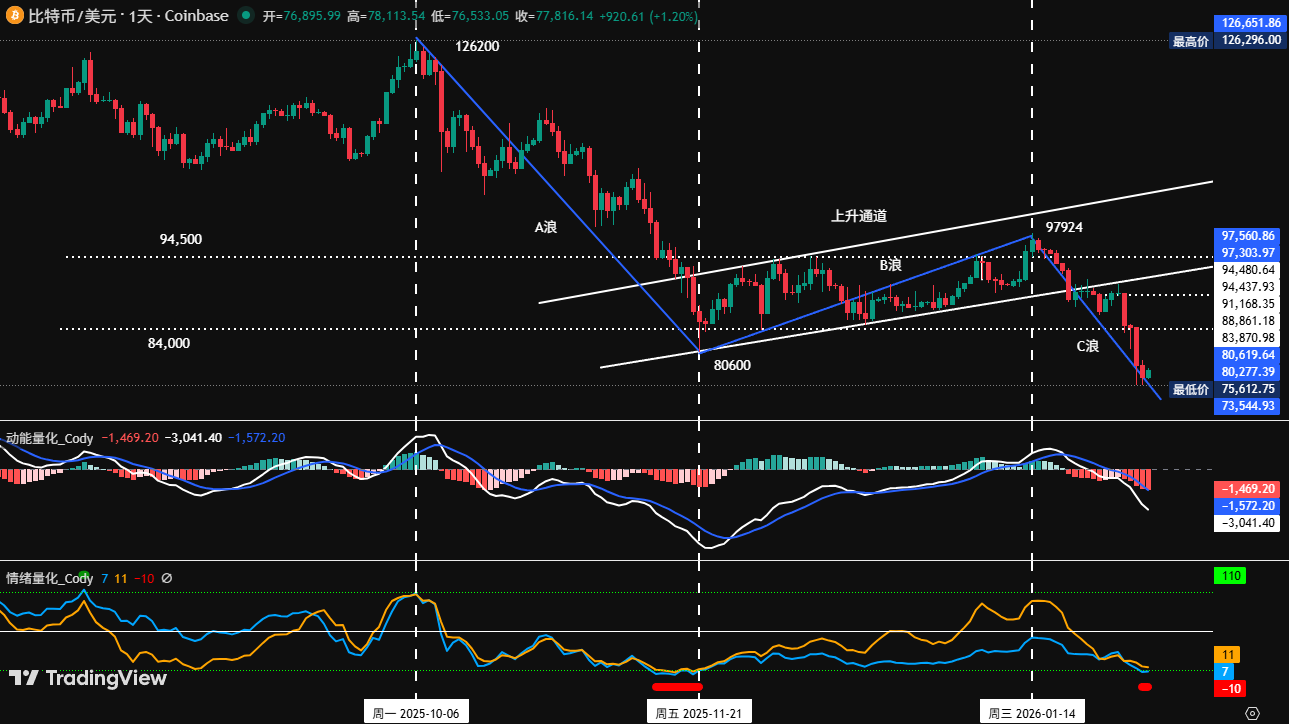
Figure 4
• Momentum Quantification Model: Last week overall presented a "pullback to channel lower轨 confirmation - accelerated decline" pattern. After Sunday's close, both momentum lines fell below the zero axis, negative energy bars gradually放大.
Momentum Quantification Model predicts: Daily level entered bear market, shorting momentum accelerating release.
• Sentiment Quantification Model: After last week's daily close, blue sentiment line value 6, strength 2, first appearance of bottom预警 signal (red dot); yellow sentiment line value 12, strength zero.
Sentiment Quantification Model predicts: Pressure and support index: Support strength is weak
The above data suggests: Probably not at the bottom yet!
IV. This Week's Market Prediction:(02.02~02.08)
1. This Week's Core View: This week is highly likely to maintain a range震荡 pattern. Focus on the压制 role of the $80,000~$80,600 region, and the support role of the $74,500~$75,200 region.
2. Core Resistance Levels:
• First Resistance Area: $80,000~$80,600 region (Previous low region)
• Second Resistance Area: Around $84,000 (Previous box lower edge)
• Important Resistance Area: $86,000~$86,500 region (Previous筹码密集成交区)
3. Core Support Levels:
• First Support Level: $74,500~$75,200 region (Last April's low region)
• Important Support Level: $69,000~$72,500 region (Previous adjustment中枢 upper edge region)
V. How to Operate This Week:(02.02~02.08)
1. Midline Strategy: Maintain 60% short position. If the rebound breaks through and stabilizes above the $86,000~$86,500 region, can reduce position to 40%.
2. Short-term Strategy: Utilize 30% of position, set stop loss points, based on support and resistance levels, look for "spread" opportunities. (Use 30 minutes as the operation cycle).
3. In operation, to dynamically respond to market evolution and combine real-time model signals, we have formulated A/B two sets of short-term operation plans:
• Plan A: If the price rebounds to the $80,000~$80,600 region and confirms the break is effective: (Sell on resistance)
• Open Position: When the retest confirms pressure and combined with model top signals, can establish a 30% short position.
• Risk Control: Initial stop loss for short positions set about 1.5% above the cost price(i.e., 1.015*cost price).
• Close Position: When falling near important support levels and combined with model signals, can gradually close positions to take profits.
• Plan B: If the price effectively breaks below the $74,500~$75,200 region: (Sell short on break below support)
• Open Position: When effectively breaking below the support level and combined with model共振 signals, can establish a 30% short position.
• Risk Control: Initial stop loss for short positions set about 1.5% above the cost price(i.e., 1.015*cost price).
• Close Position: When falling to support levels and combined with model signals, can gradually close positions to take profits.
VI. Special Tips:
1. When opening a position: Immediately set the initial stop loss level.
2. When profit reaches 1%: Move the stop loss to the opening cost price (break-even point), ensuring principal safety.
3. When profit reaches 2%: Move the stop loss to the position of 1% profit.
4. Continuous Tracking: Thereafter, for every additional 1% profit the price makes, move the stop loss同步 1%, dynamically protecting and locking in profits.






