Bitcoin Weak and Volatile, Is a Big Fluctuation Coming?

深潮Publicado a 2025-12-11Actualizado a 2025-12-11

Resumen

Bitcoin remains trapped in a structurally fragile range, with rising unrealized losses, elevated realized losses, and significant profit-taking by long-term holders. Despite persistent selling pressure, patient demand has anchored the price above the Realized Price (~$81.3K). A reclaim of the $95K level (0.75 cost basis quantile) and the Short-Term Holder cost basis (~$102.7K) is possible if seller exhaustion emerges. Off-chain conditions remain weak, with negative ETF flows, thin spot liquidity, and muted speculative interest in futures markets. Options markets show a defensive stance, with traders accumulating short-term implied volatility and demanding downside protection ahead of the FOMC meeting. Market stability relies on patient buyers absorbing sales, but the path forward depends on whether liquidity improves and sellers retreat, or if time-driven bearish pressure persists. Post-FOMC, implied volatility is expected to decay into year-end barring a hawkish surprise.

Written by: Chris Beamish, CryptoVizArt, Antoine Colpaert, Glassnode

Compiled by: AididiaoJP, Foresight News

Bitcoin remains trapped in a fragile range, with increasing unrealized losses, long-term holders selling, and persistently weak demand. ETFs and liquidity remain sluggish, futures markets are weak, and options traders are pricing in short-term volatility. The market is currently stable, but confidence is still lacking.

Summary

Bitcoin remains in a structurally fragile range, pressured by increasing unrealized losses, high realized losses, and significant profit-taking by long-term holders. Despite this, demand is anchoring the price above the true market mean.

The market has failed to reclaim key thresholds, particularly the short-term holder cost basis, reflecting continued selling pressure from recent high buyers and experienced holders. If signs of seller exhaustion emerge, a retest of these levels is possible in the short term.

Off-chain indicators remain weak. ETF flows are negative, spot liquidity is thin, futures open interest shows a lack of speculative confidence, making prices more sensitive to macro catalysts.

The options market shows a defensive setup, with traders buying short-term implied volatility (IV) and consistently showing demand for downside protection. Volatility surface signals indicate short-term caution, but longer-term sentiment is more balanced.

With the FOMC meeting as the last major catalyst of the year, implied volatility is expected to gradually decay in late December. Market direction depends on whether liquidity improves and sellers step back, or whether the current time-driven bearish pressure persists.

On-Chain Insights

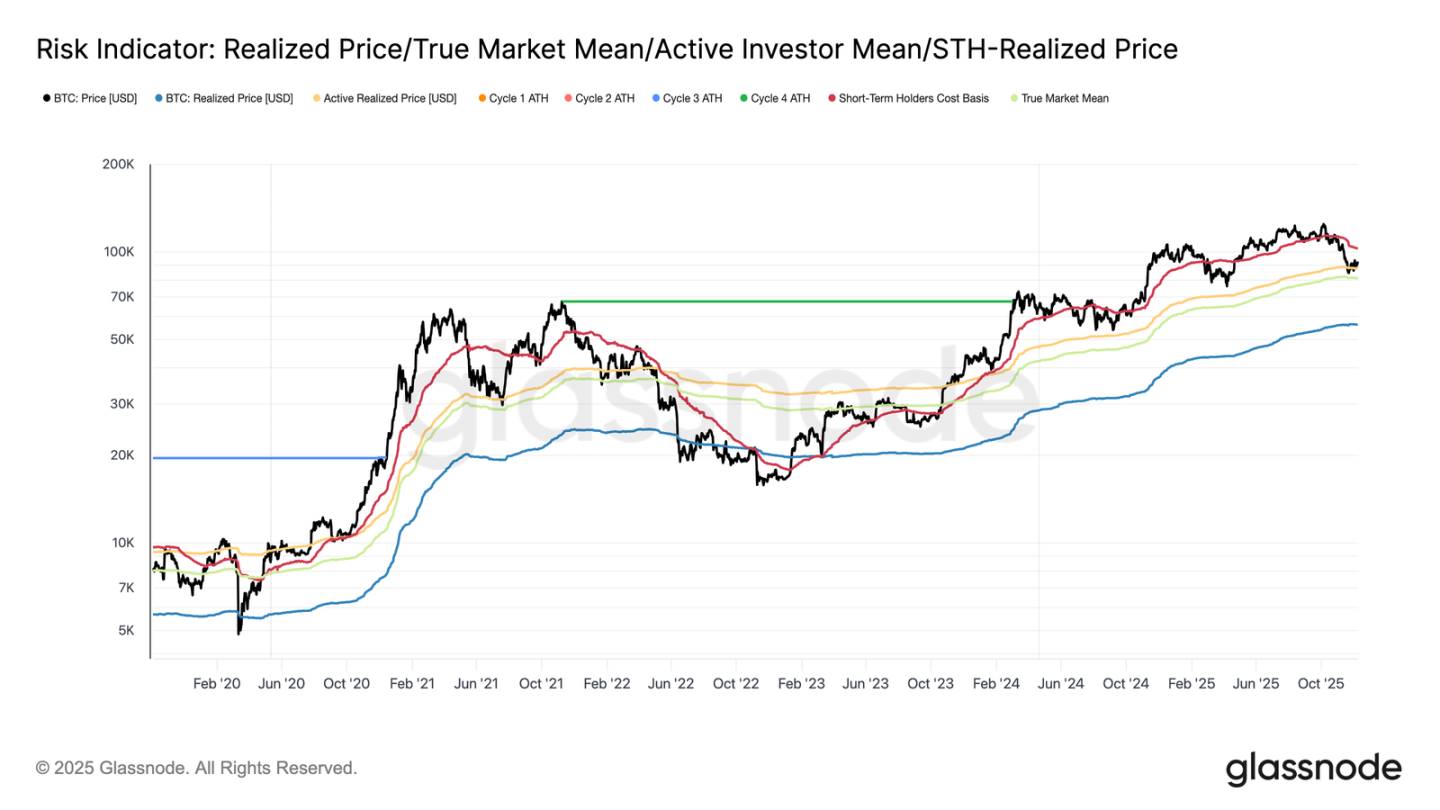
Bitcoin entered the week still confined to a structurally fragile range, bounded above by the short-term holder cost basis ($102.7k) and below by the true market mean ($81.3k). Last week, we highlighted weakening on-chain conditions, thin demand, and a cautious derivatives landscape, collectively echoing the market setup of early 2022.

Although the price barely holds above the true market mean, unrealized losses continue to expand, realized losses are rising, and spending by long-term investors remains elevated. The key ceiling to reclaim is the 0.75 cost basis quantile ($95k), followed by the short-term holder cost basis. Until then, barring a new macro shock, the true market mean remains the most likely area for bottom formation.
Time is Not on the Bulls' Side

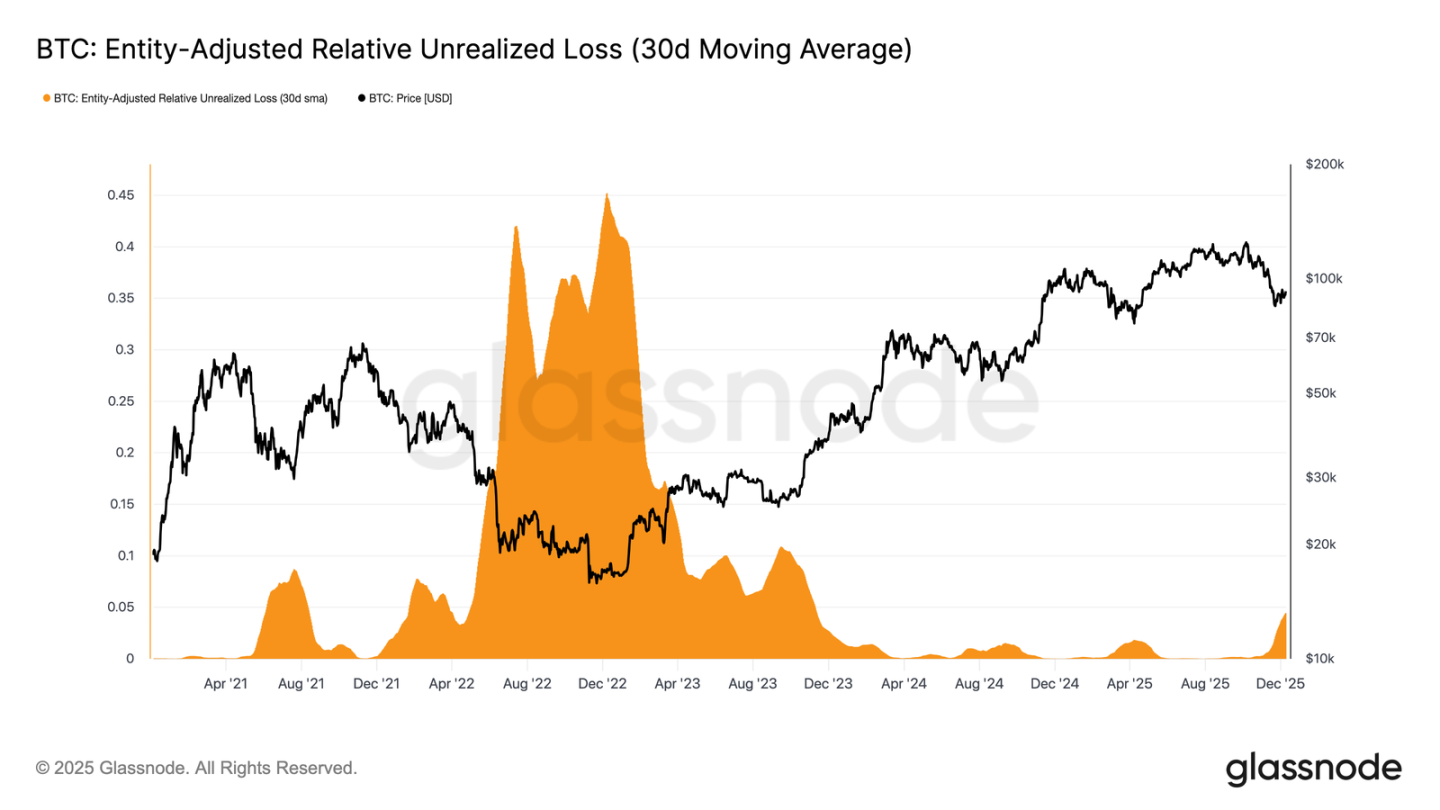
The market is stuck in a mild bearish phase, reflecting the tension between modest capital inflows and persistent selling pressure from high buyers. As the market drifts in a weak but bounded range, time becomes a negative force, making it harder for investors to bear unrealized losses and increasing the likelihood of realizing losses.

The Relative Unrealized Loss (30-day SMA) has climbed to 4.4%, after staying below 2% for nearly two years, marking a shift from a phase of euphoria to one of increased stress and uncertainty. This indecision currently defines this price range, and resolving it will require a new wave of liquidity and demand to rebuild confidence.
Losses Mounting

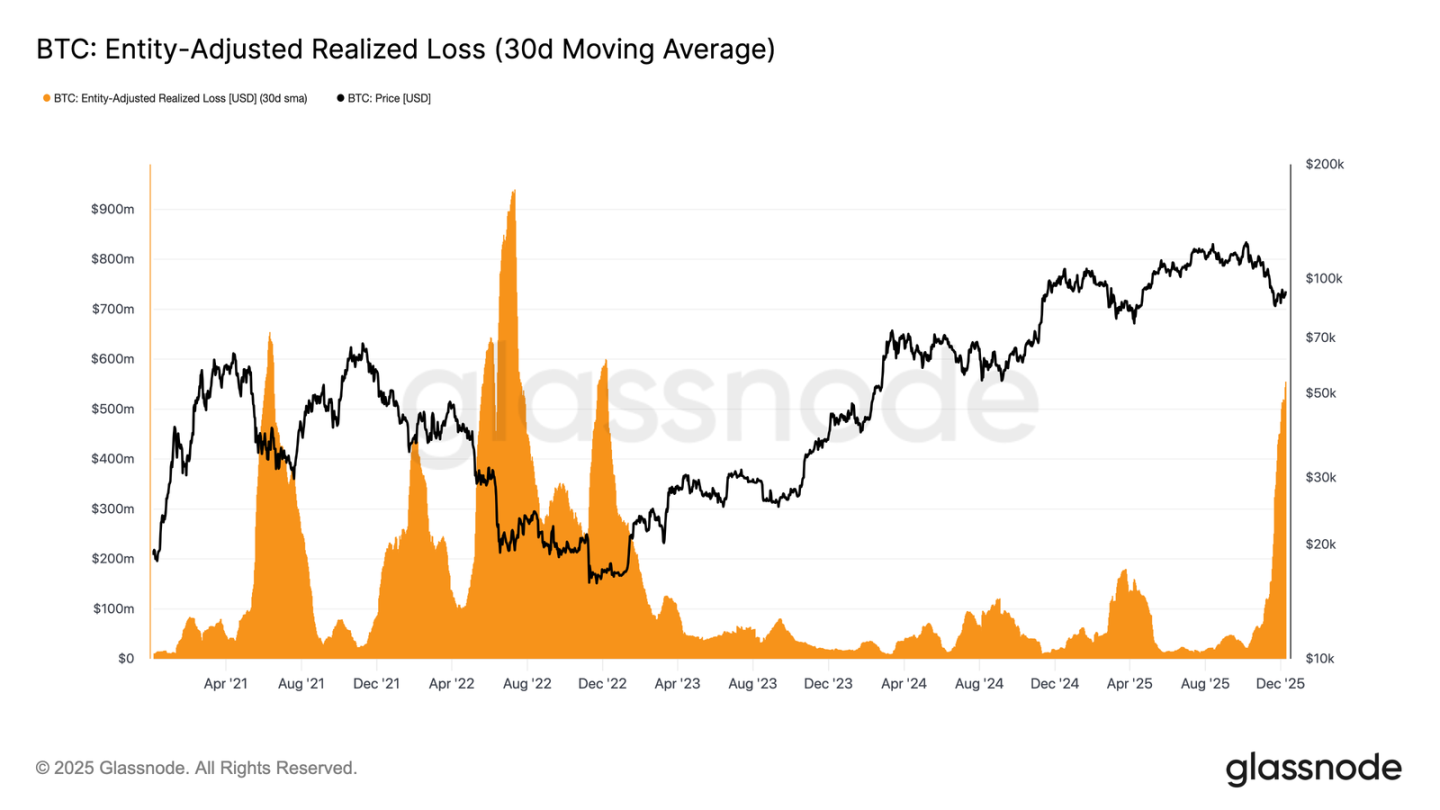
This time-driven pressure is even more evident in spending behavior. Although Bitcoin has rebounded from the November 22nd low to around $92.7k, the Entity-Adjusted Realized Loss (30-day SMA) has continued to climb, reaching $555 million per day, the highest level since the FTX collapse.

Such high realized losses during a modest price recovery reflect the growing frustration of high buyers, who are choosing to capitulate as the market strengthens rather than holding through the rebound.
Hindering a Reversal

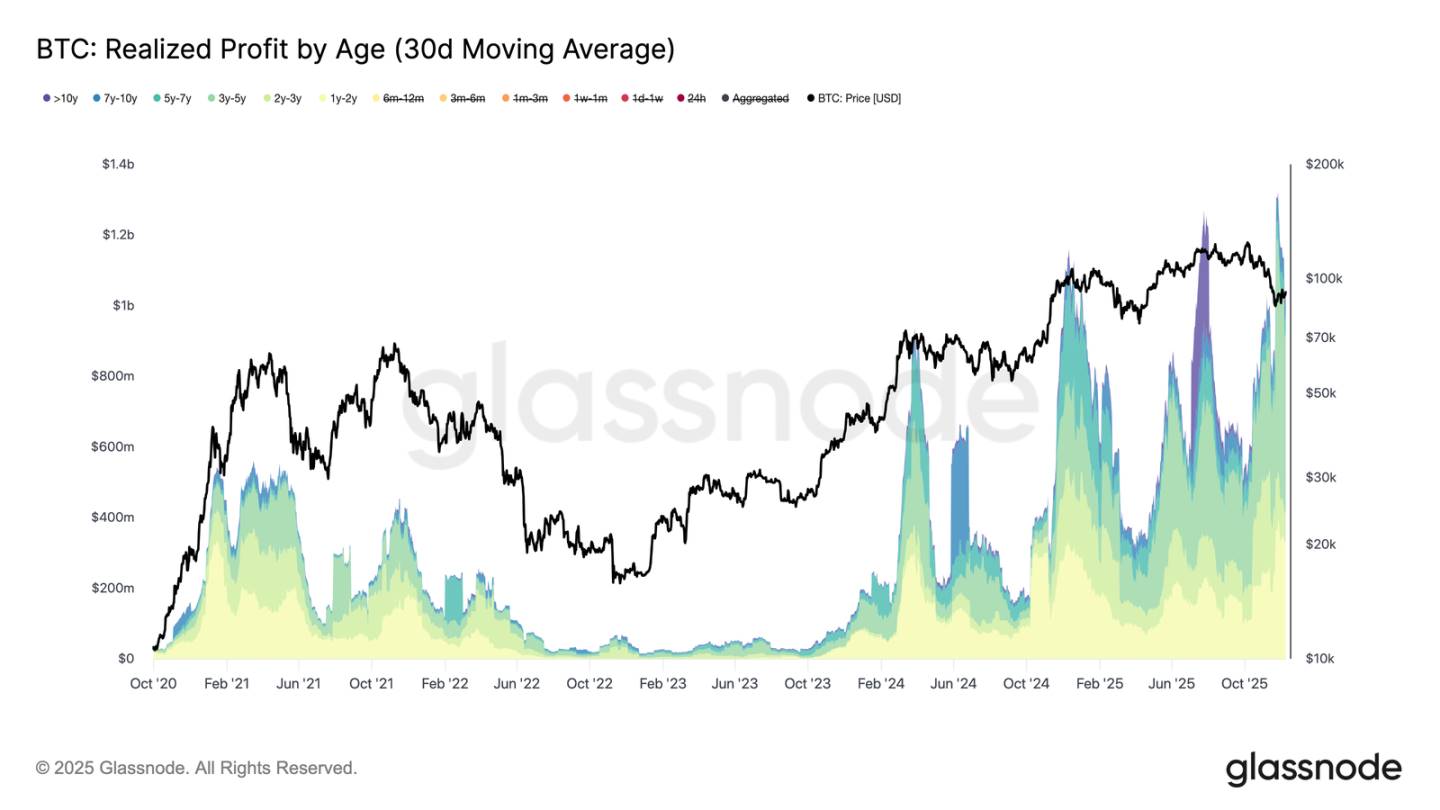
Rising realized losses further hinder recovery, especially when they coincide with a surge in realized profits from veteran investors. During the recent rebound, realized profits for holders over 1 year (30-day SMA) exceeded $1 billion per day, peaking at over $1.3 billion near the new all-time high. The combination of high buyer capitulation and substantial profit-taking by long-term holders explains why the market is still struggling to reclaim the short-term holder cost basis.

However, despite such significant selling pressure, the price has stabilized and even slightly recovered above the true market mean, suggesting that sustained and patient demand is absorbing the sell-off. In the short term, if sellers begin to show signs of exhaustion, this underlying buying pressure could drive a retest of the 0.75 quantile (~$95k) and even the short-term holder cost basis.
Off-Chain Insights

ETF Woes

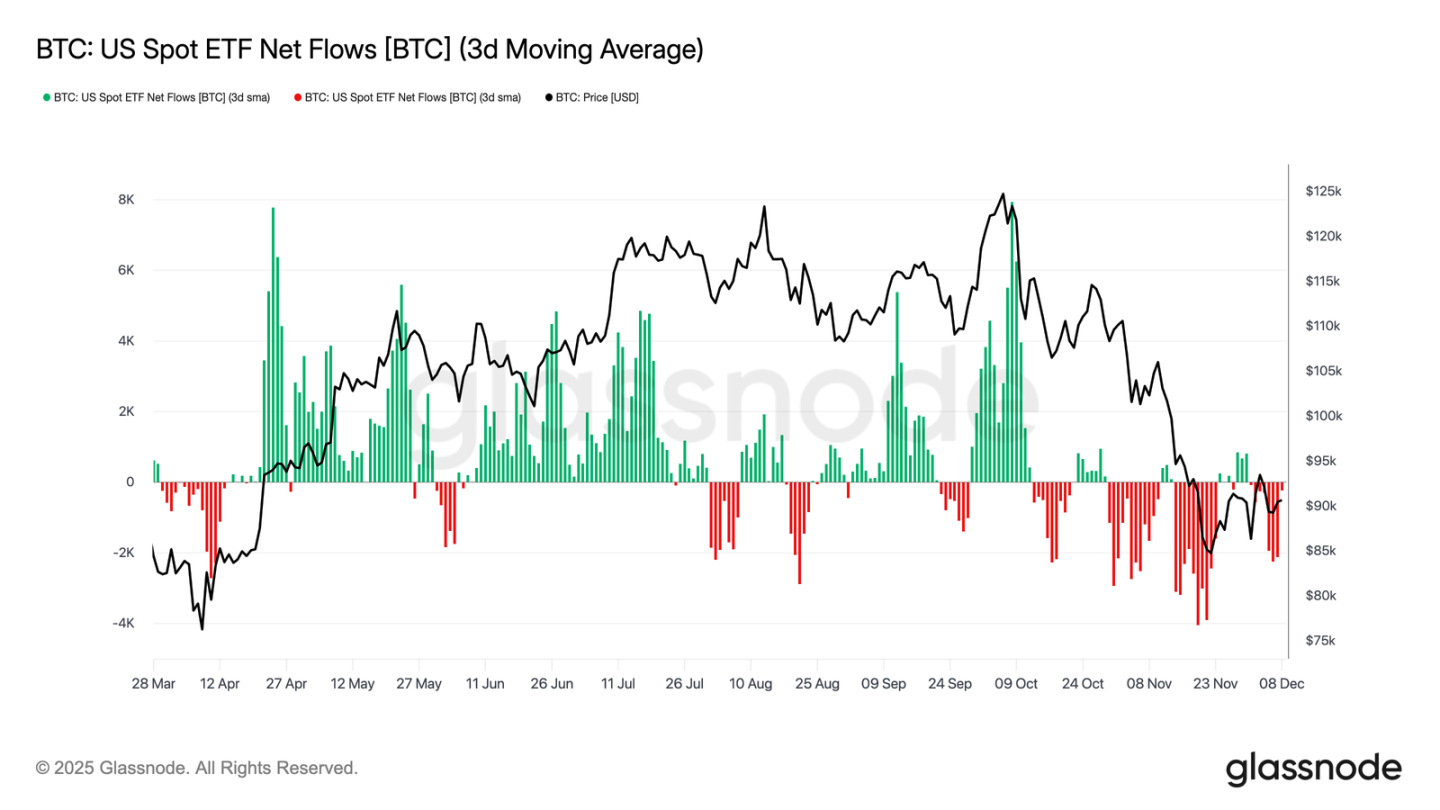
Turning to the spot market, U.S. Bitcoin ETFs had another quiet week, with the three-day average net inflows remaining negative. This continues the cooling trend that began in late November, marking a clear departure from the strong inflow regime that supported price appreciation earlier this year. Redemptions from several major issuers remained steady, highlighting a more risk-off stance from institutional allocators amid a shaky broader market environment.

As a result, the demand buffer in the spot market has thinned, reducing immediate buyer support and leaving prices more vulnerable to macro catalysts and volatility shocks.
Liquidity Remains Subdued

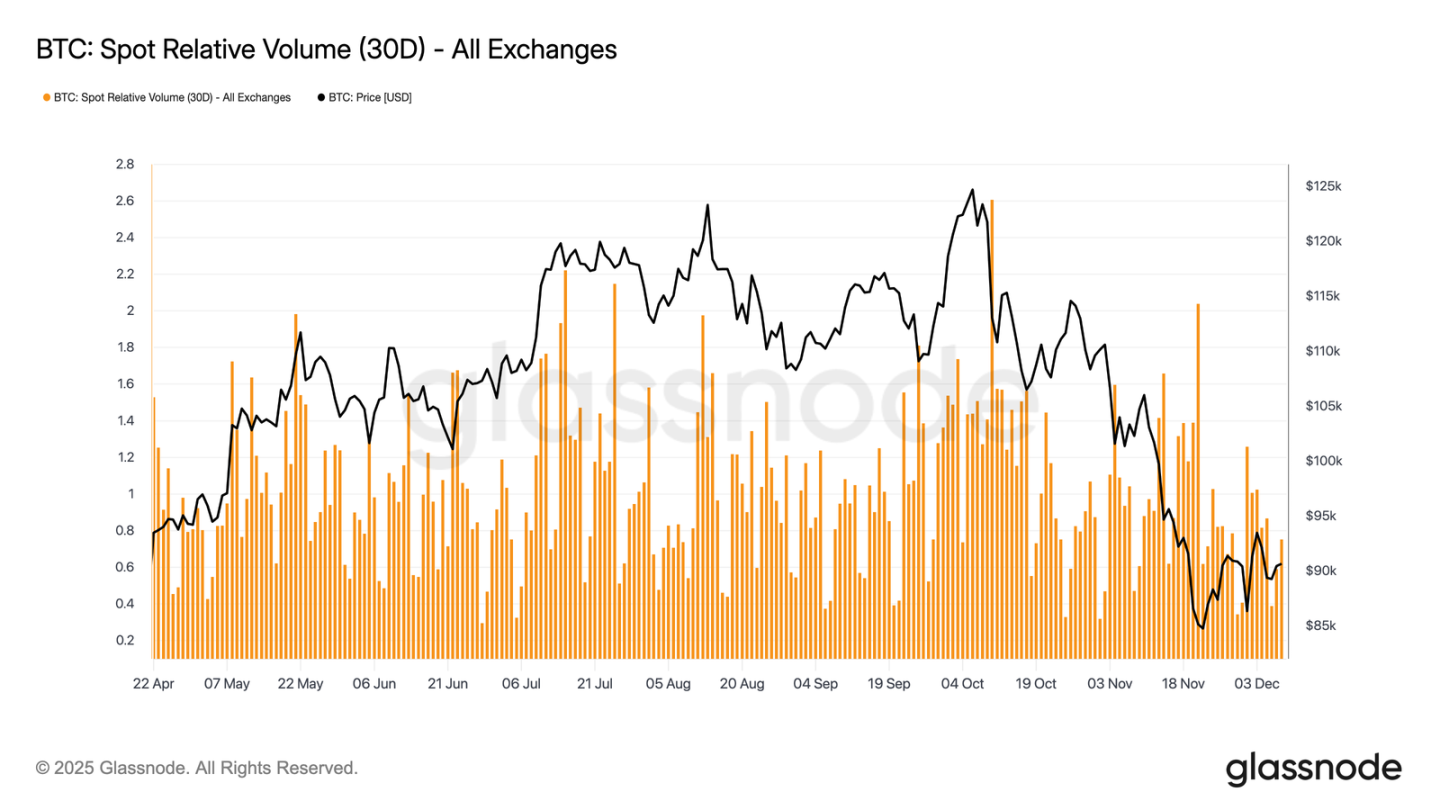
Parallel to weak ETF flows, Bitcoin's spot relative volume continues to hover near the lower end of its 30-day range. Trading activity has weakened persistently from November into December, reflecting both price declines and reduced market participation. The contraction in volume reflects a more defensive positioning overall, with fewer liquidity-driven flows available to absorb volatility or sustain directional moves.

With spot markets quieting down, attention now turns to the upcoming FOMC meeting, which could serve as a catalyst to reactivate market participation depending on its policy tone.
Futures Market Muted

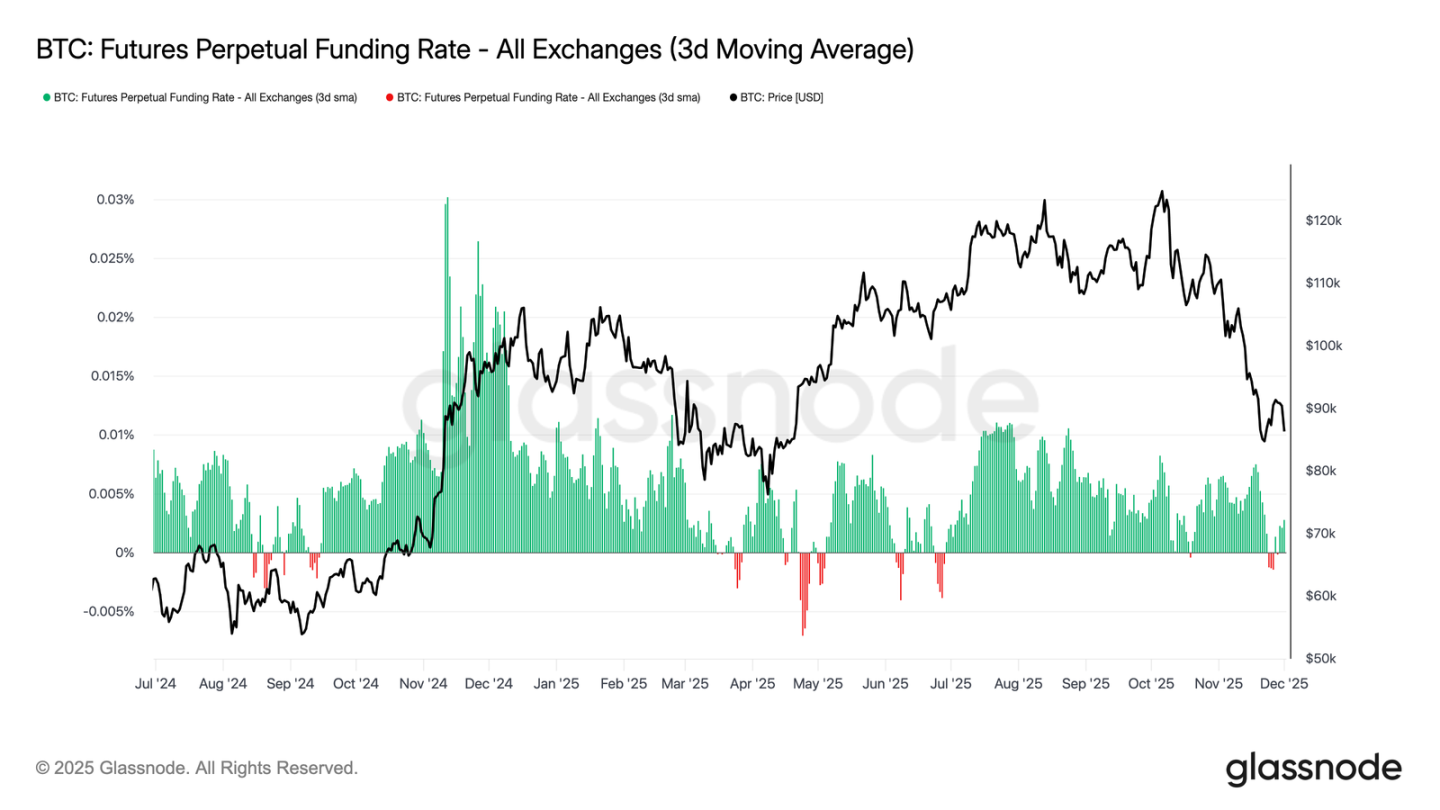
Continuing the theme of subdued market participation, the futures market also shows limited interest in leverage, with open interest failing to rebuild substantially and funding rates holding near neutral. These dynamics highlight a derivatives environment defined by caution rather than confidence.

In the perpetual swap markets, funding rates hovered around zero to slightly negative this week, highlighting the continued exodus of speculative long positions. Traders maintain balanced or defensive postures, applying little directional pressure via leverage.

With derivative activity muted, price discovery leans more on spot flows and macro catalysts rather than speculative expansion.
Short-Term Implied Volatility Spikes

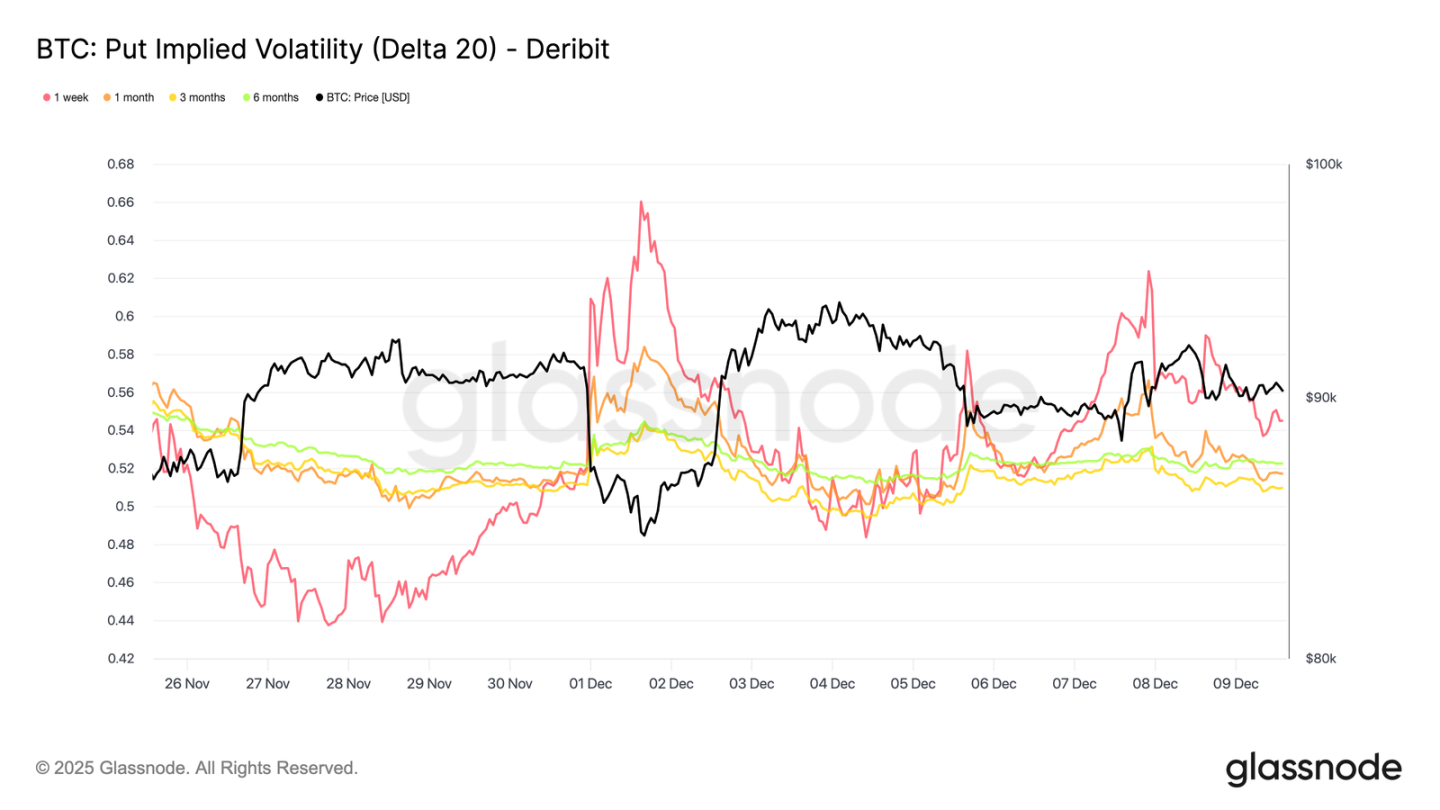
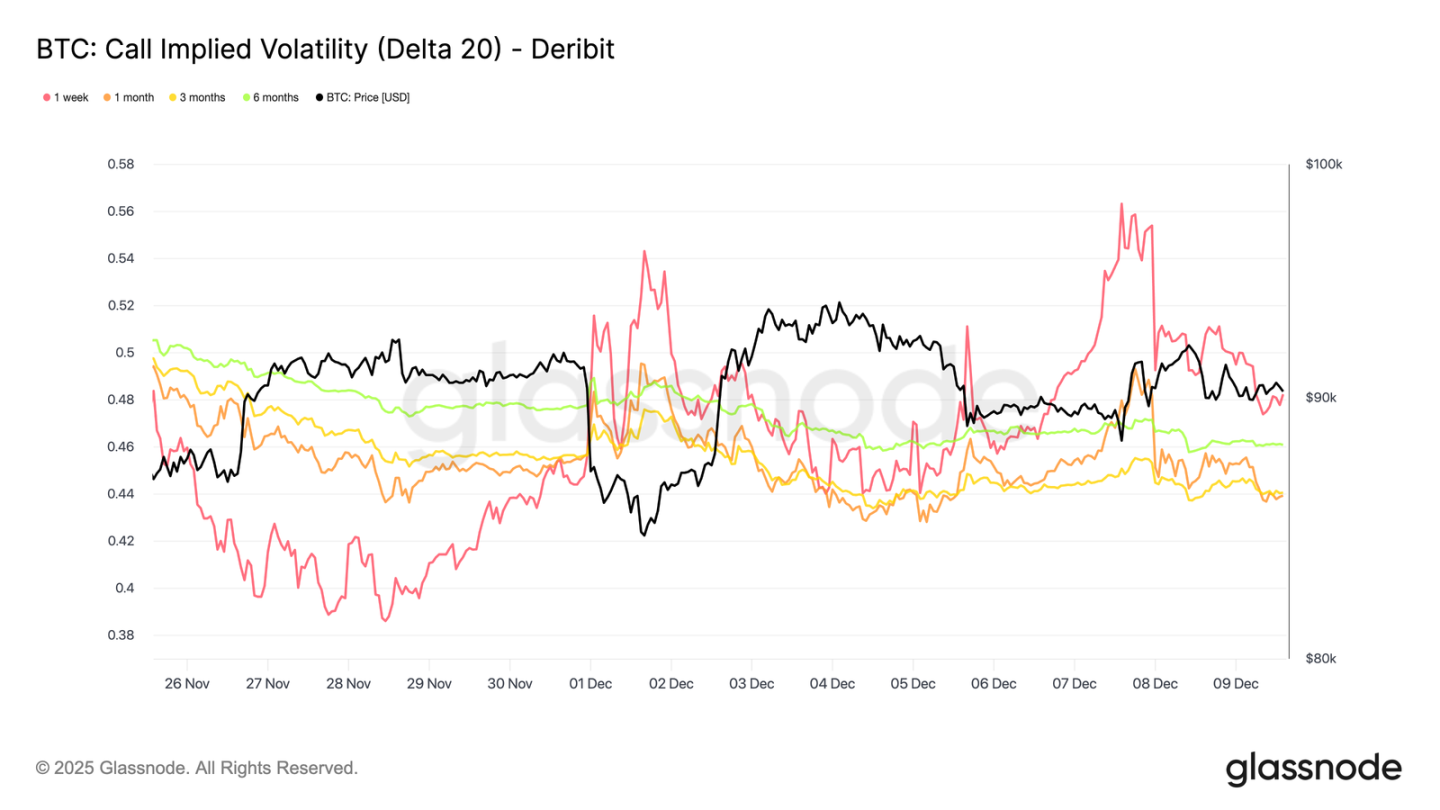
Turning to the options market, Bitcoin's flat spot activity contrasts with a sudden rise in short-term implied volatility, as traders position for larger price moves. Interpolated Implied Volatility (which estimates IV using fixed delta values rather than relying on listed strikes) provides a clearer view of how risk is priced across maturities.

On 20-Delta calls, 1-week IV rose by about 10 volatility points compared to last week, while longer tenors remained relatively flat. The same pattern appears on 20-Delta puts, with short-term downside IV rising while longer tenors stay calm.

Overall, traders are accumulating volatility where they expect stress, favoring convexity over selling into the December 10th FOMC meeting.
Downside Demand Returns

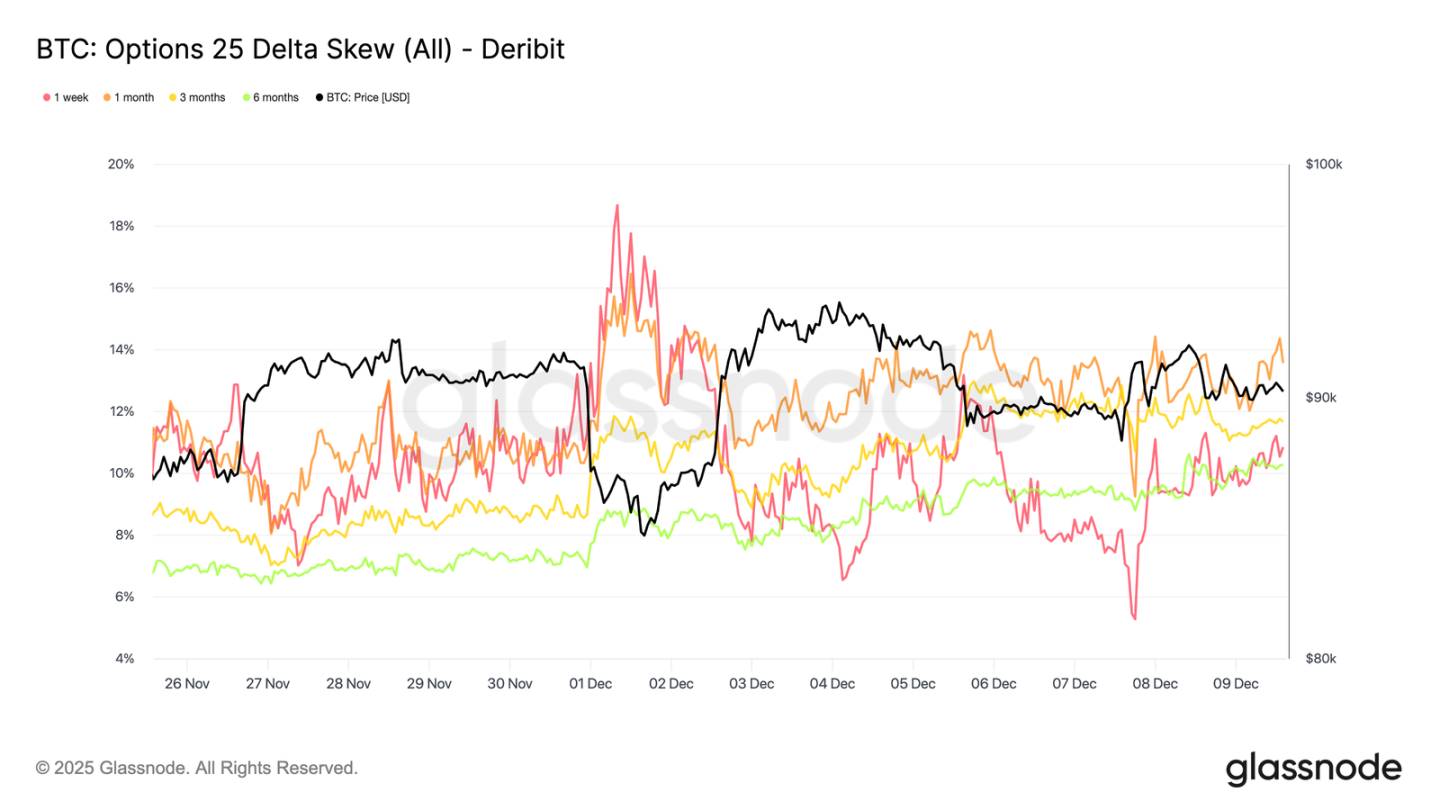
Accompanying the rise in short-term volatility, downside protection is again commanding a premium. The 25-delta skew, which measures the relative cost of puts versus calls at the same delta value, has climbed to around 11% for the 1-week tenor, indicating a clear increase in demand for short-term downside insurance ahead of the FOMC.

Skew remains tightly clustered across tenors, ranging from 10.3% to 13.6%. This compression suggests that the preference for put protection is curve-wide, reflecting a consistent risk-off tilt rather than isolated pressure at the short end.
Volatility Accumulation

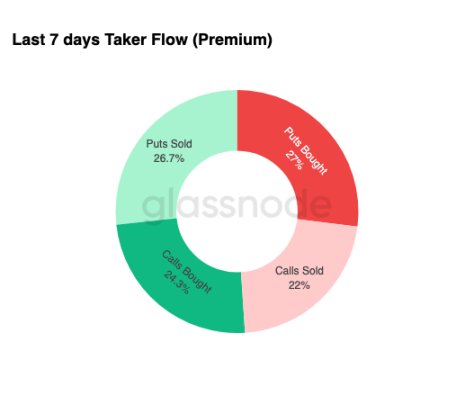
Summarizing the options market conditions, weekly flow data reinforces a clear pattern: traders are buying volatility, not selling it. Paid option premiums dominate the total notional flow, with puts slightly leading. This does not reflect a directional bias, but a state of volatility accumulation. When traders buy both sides, it signals hedging and convexity-seeking behavior, not sentiment-based speculation.

Coupled with rising implied volatility and a downside-leaning skew, the flow picture suggests market participants are preparing for a volatility event with a downward bias.
Post-FOMC

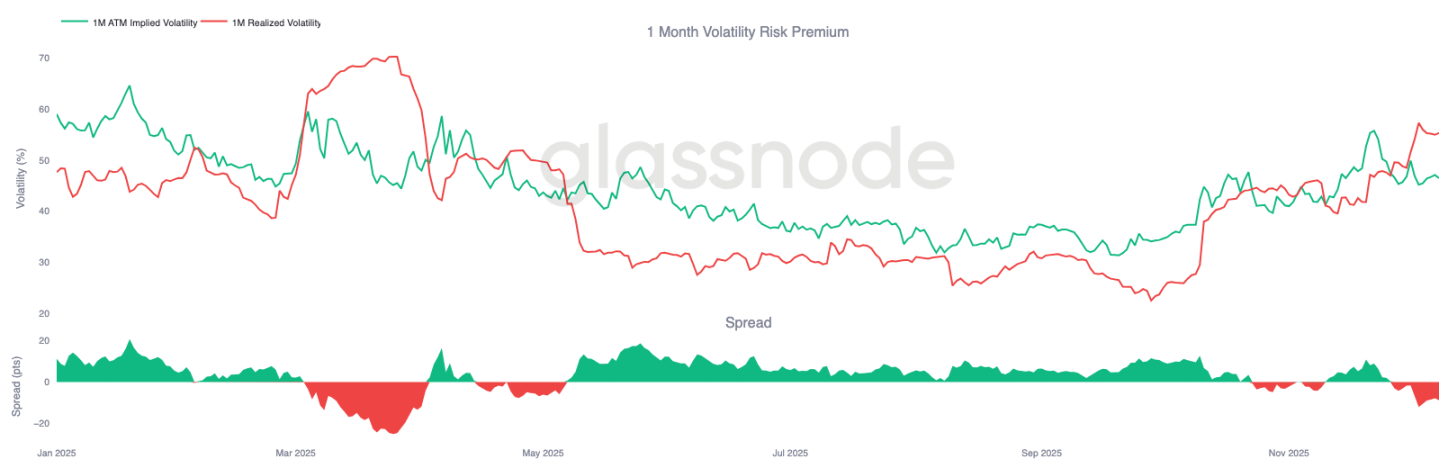
Looking ahead, implied volatility has already begun to ease, and historically, IV tends to compress further once the last major macro event of the year passes. With the December 10th FOMC meeting as the last meaningful catalyst, the market is preparing to transition into a low-liquidity, mean-reverting environment.

Post-announcement, sellers typically re-enter the market, accelerating IV decay into year-end. Barring a hawkish surprise or a significant shift in guidance, the path of least resistance points to lower implied volatility and a flatter volatility surface persisting into late December.
Conclusion

Bitcoin continues to trade in a structurally fragile environment, with rising unrealized losses, high realized losses, and substantial profit-taking by long-term holders collectively anchoring price action. Despite persistent selling pressure, demand remains resilient enough to hold price above the true market mean, suggesting patient buyers are still absorbing the sell-off. If signs of seller exhaustion begin to emerge, a near-term push toward $95k and the short-term holder cost basis remains possible.

Off-chain conditions echo this cautious tone. ETF flows remain negative, spot liquidity is subdued, and futures markets lack speculative participation. The options market reinforces the defensive posture, with traders accumulating volatility, buying short-term downside protection, and positioning for a near-term volatility event ahead of the FOMC.

Taken together, the market structure suggests a weak but stable range, underpinned by patient demand but constrained by persistent selling pressure. The near-term path depends on whether liquidity improves and sellers step back, while the longer-term outlook hinges on the market's ability to reclaim key cost basis thresholds and move beyond this time-driven, psychologically taxing phase.


Criptos en tendencia

Preguntas relacionadas

QWhat are the key factors contributing to Bitcoin's current structurally fragile trading range according to the article?

ABitcoin is trapped in a fragile range due to increasing unrealized losses, elevated realized losses, and significant profit-taking by long-term holders, while demand remains weak and fails to reclaim key thresholds like the short-term holder cost basis.

QHow are ETF flows and liquidity conditions affecting the Bitcoin market as described in the article?

AETF flows have turned negative, and spot liquidity remains thin, reducing immediate buyer support and making prices more vulnerable to macro catalysts and volatility shocks.

QWhat does the options market indicate about trader expectations for Bitcoin's near-term price movement?

AOptions traders are pricing in short-term volatility, buying short-dated implied volatility and showing increased demand for downside protection, particularly around the FOMC meeting, indicating defensive positioning and anticipation of potential price swings.

QWhy is time described as a negative force for Bitcoin bulls in the current market environment?

ATime is negative for bulls because prolonged consolidation in a weak range increases pressure on investors with unrealized losses, making them more likely to capitulate and realize losses, which hinders price recovery.

QWhat potential catalyst could trigger a change in market dynamics, and what is the expected outcome post-FOMC?

AThe FOMC meeting is seen as the last major catalyst for the year. If there are no hawkish surprises, implied volatility is expected to decay into year-end, with markets transitioning to a low-liquidity, mean-reverting environment unless liquidity improves or selling pressure subsides.

Lecturas Relacionadas

After R&D Investment Catches Up with the U.S., Is the Sino-U.S. Chip Competition Still Just About Money?

The article examines the significance of recent data showing China's total R&D expenditure, measured by purchasing power parity (PPP), catching up to or slightly surpassing that of the United States in 2024. It argues that while this milestone reflects China's immense capacity to mobilize research resources, the competition in semiconductors now extends far beyond sheer financial input. The analysis highlights key differences: China's R&D is heavily skewed towards experimental development (over 80%), focusing on product engineering and industrialization, whereas the U.S. allocates a proportionally larger share (about 15%) to basic research. Furthermore, leading U.S. semiconductor firms reinvest a significant portion of their substantial global sales revenue into R&D, creating a sustainable commercial innovation cycle that is difficult to replicate. The article emphasizes that semiconductor progress depends on converting R&D into commercially viable products that pass rigorous customer validation and achieve repeat orders, not just on spending levels. It concludes that as China enters the top tier of R&D spenders, the critical challenges shift to improving resource allocation efficiency, fostering long-term basic research, and building effective mechanisms to bridge the gap between laboratory discoveries and reliable, market-ready industrial capabilities.

marsbitHace 28 min(s)

After R&D Investment Catches Up with the U.S., Is the Sino-U.S. Chip Competition Still Just About Money?

marsbitHace 28 min(s)

Top 10% of American Households Capture 88% of Wealth, How Is the AI Era Cake Divided?

AI Worsens Wealth Inequality as Top 10% of US Families Garner 88% of Stock Gains (2019-2026) A report from the China Finance 40 Forum highlights that the AI boom is significantly widening wealth inequality in the United States. From 2019 to Q1 2026, wealth from directly held stocks by US households nearly doubled from $29 trillion to approximately $55 trillion, with rapid growth concentrated post-2023, coinciding with the AI-driven stock market surge. The distribution of these gains has been starkly uneven. Between 2022 and Q1 2026, the wealth increase of about $21 trillion was captured almost entirely by the wealthiest families: the top 10% secured roughly 88% ($18.5 trillion), while the bottom 50% received only about 1% ($0.2 trillion). This has contributed to a growing disparity in disposable income shares. The report, referencing economic historian Robert Allen, draws parallels to historical technological shifts like the "Engels' Pause" during the First Industrial Revolution, where worker wages stagnated despite productivity gains. It suggests AI could induce a similar period where capital收益 outpace labor income, exacerbating inequality. Huang Yiping of Peking University identifies four mechanisms through which AI impacts income distribution: capital-bias (reducing labor's income share), task polarization (hollowing out middle-skill jobs), skill-based digital divides, and wealth amplification through assets. He warns that if this trend continues, strong supply growth driven by AI could be undermined by persistently weak consumer demand, threatening sustainable economic growth. To address these challenges, the report proposes a three-pronged strategy: 1) Defensive measures like strengthening social safety nets and antitrust enforcement; 2) Empowering workers through education reform and lifelong learning to collaborate with AI; and 3) Rebalancing via policies such as potential taxes on AI超额收益 and mechanisms for broader sharing of technology's benefits, ensuring AI's红利 are more equitably distributed.

marsbitHace 34 min(s)

Top 10% of American Households Capture 88% of Wealth, How Is the AI Era Cake Divided?

marsbitHace 34 min(s)

Trading

Spot

Artículos destacados

Cómo comprar O

¡Bienvenido a HTX.com! Hemos hecho que comprar O1 exchange (O) sea simple y conveniente. Sigue nuestra guía paso a paso para iniciar tu viaje de criptos.Paso 1: crea tu cuenta HTXUtiliza tu correo electrónico o número de teléfono para registrarte y obtener una cuenta gratuita en HTX. Experimenta un proceso de registro sin complicaciones y desbloquea todas las funciones.Obtener mi cuentaPaso 2: ve a Comprar cripto y elige tu método de pagoTarjeta de crédito/débito: usa tu Visa o Mastercard para comprar O1 exchange (O) al instante.Saldo: utiliza fondos del saldo de tu cuenta HTX para tradear sin problemas.Terceros: hemos agregado métodos de pago populares como Google Pay y Apple Pay para mejorar la comodidad.P2P: tradear directamente con otros usuarios en HTX.Over-the-Counter (OTC): ofrecemos servicios personalizados y tipos de cambio competitivos para los traders.Paso 3: guarda tu O1 exchange (O)Después de comprar tu O1 exchange (O), guárdalo en tu cuenta HTX. Alternativamente, puedes enviarlo a otro lugar mediante transferencia blockchain o utilizarlo para tradear otras criptomonedas.Paso 4: tradear O1 exchange (O)Tradear fácilmente con O1 exchange (O) en HTX's mercado spot. Simplemente accede a tu cuenta, selecciona tu par de trading, ejecuta tus trades y monitorea en tiempo real. Ofrecemos una experiencia fácil de usar tanto para principiantes como para traders experimentados.

261 Vistas totalesPublicado en 2026.06.19Actualizado en 2026.06.29

Cómo comprar O

Cómo comprar PROS

¡Bienvenido a HTX.com! Hemos hecho que comprar Pharos (PROS) sea simple y conveniente. Sigue nuestra guía paso a paso para iniciar tu viaje de criptos.Paso 1: crea tu cuenta HTXUtiliza tu correo electrónico o número de teléfono para registrarte y obtener una cuenta gratuita en HTX. Experimenta un proceso de registro sin complicaciones y desbloquea todas las funciones.Obtener mi cuentaPaso 2: ve a Comprar cripto y elige tu método de pagoTarjeta de crédito/débito: usa tu Visa o Mastercard para comprar Pharos (PROS) al instante.Saldo: utiliza fondos del saldo de tu cuenta HTX para tradear sin problemas.Terceros: hemos agregado métodos de pago populares como Google Pay y Apple Pay para mejorar la comodidad.P2P: tradear directamente con otros usuarios en HTX.Over-the-Counter (OTC): ofrecemos servicios personalizados y tipos de cambio competitivos para los traders.Paso 3: guarda tu Pharos (PROS)Después de comprar tu Pharos (PROS), guárdalo en tu cuenta HTX. Alternativamente, puedes enviarlo a otro lugar mediante transferencia blockchain o utilizarlo para tradear otras criptomonedas.Paso 4: tradear Pharos (PROS)Tradear fácilmente con Pharos (PROS) en HTX's mercado spot. Simplemente accede a tu cuenta, selecciona tu par de trading, ejecuta tus trades y monitorea en tiempo real. Ofrecemos una experiencia fácil de usar tanto para principiantes como para traders experimentados.

275 Vistas totalesPublicado en 2026.06.22Actualizado en 2026.06.29

Cómo comprar PROS

Qué es VERONA

I. Introducción al Proyecto VERONA es una blockchain construida para todos, en todas partes a través de la abstracción de cadenas. Utilizando su capa de Abstracción Generalizada, VERONA se distingue por integrar funcionalidades complejas de blockchain, como cuentas, firmas e interoperabilidad, directamente a nivel de protocolo. Este enfoque permite interactuar con aplicaciones de blockchain sin necesidad de entender las tecnologías subyacentes.1) Información Básica Nombre: VERONA (VERONA)III. Enlaces Relacionados Enlace al sitio web oficial: https://xion.burnt.com/ Libro Blanco: https://xion.burnt.com/whitepaper.pdf Exploradores: https://explorer.burnt.com/ Redes Sociales: https://x.com/burnt_xion Nota: La introducción del proyecto proviene de los materiales publicados o proporcionados por el equipo oficial del proyecto, que es solo para referencia y no constituye asesoramiento de inversión. HTX no se hace responsable de ninguna pérdida directa o indirecta resultante.

317 Vistas totalesPublicado en 2026.06.22Actualizado en 2026.06.22

Qué es VERONA

Discusiones

Bienvenido a la comunidad de HTX. Aquí puedes mantenerte informado sobre los últimos desarrollos de la plataforma y acceder a análisis profesionales del mercado. A continuación se presentan las opiniones de los usuarios sobre el precio de A (A).

活动图片