Bitcoin Social Euphoria Hits Yearly High Amid CLARITY Act Buzz

bitcoinistPublicado a 2026-05-18Actualizado a 2026-05-18

Resumen

Bitcoin social sentiment has surged to a yearly high following the U.S. Senate Banking Committee's bipartisan approval of the CLARITY Act. Data from Santiment shows a ratio of 1.55 bullish comments for every 1 bearish comment, indicating a "FOMO zone" similar to a peak in late April. Analysts note such high optimism often signals a short-term profit-taking opportunity, contrasting with the better contrarian buy signal seen during recent "FUD zone" pessimism. Despite near-term caution, the CLARITY Act is viewed as a long-term positive, aiming to establish a clearer federal regulatory framework for digital assets by defining roles for the SEC and CFTC. The bill, supported by major crypto firms, now awaits a full Senate vote, with a critical window for passage before the August recess.

The CLARITY Act’s landmark committee approval has sent Bitcoin sentiment soaring to its highest point in months.

Data from Santiment shows that bullish Bitcoin commentary on social media has climbed to one of its greediest readings of the year, with 1.55 bullish comments for every 1.00 bearish comment. The on-chain data, however, indicates that the crowd may be getting ahead of itself.

Bitcoin Sentiment Points To Greed After CLARITY Act Vote

The passage of the Digital Asset Market Clarity Act through the Senate Banking Committee moved both price and crowd psychology simultaneously. The move came after the US Senate Banking Committee advanced the CLARITY Act in a 15-9 bipartisan vote, sending the important market-structure bill to the full Senate.

Interestingly, Santiment’s data shows that Bitcoin social sentiment has moved back into a FOMO zone. On May 15, Santiment’s social sentiment ratio for Bitcoin reached 1.55 bullish comments for every 1.00 bearish comment, placing it within a FOMO Zone.

That reading mirrors a prior peak recorded on April 25, when the ratio reached 1.58 bullish-to-bearish. Any time the ratio of positive to negative commentary on social media crosses this FOMO zone, then it is an ideal temporary profit-taking moment.

This does not mean Bitcoin has to crash because the crowd has turned optimistic. The same Santiment chart shows that the better contrarian setup came on April 18, when the bullish-to-bearish ratio dropped to 0.59. This was deep in the FUD Zone, before Bitcoin mounted a recovery.
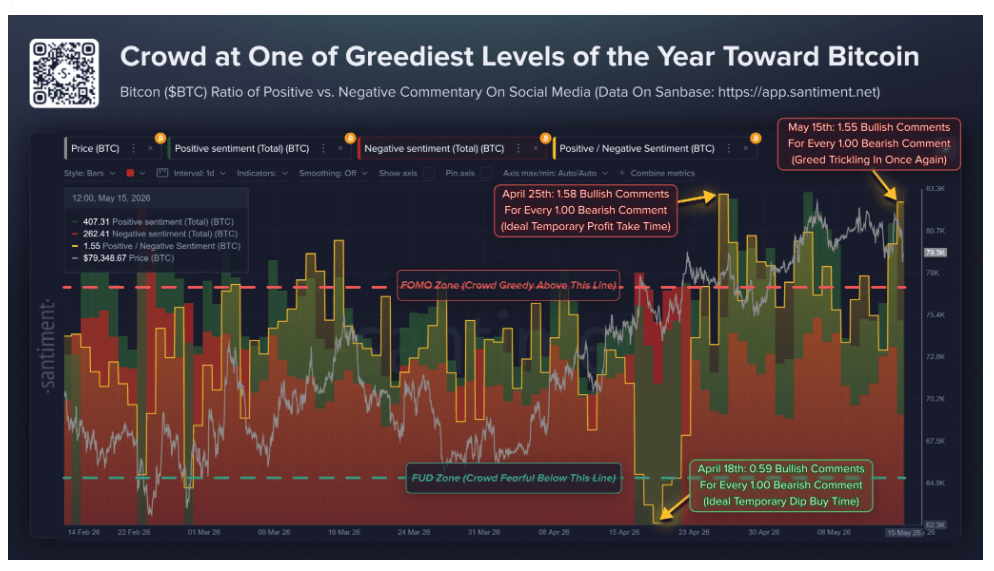
Bitcoin Ratio Of Positive vs. Negative Commentary. Source: @SantimentData On X

CLARITY Act Still Bullish For Bitcoin In The Long Run

The caution around short-term sentiment does not cancel the long-term importance of the CLARITY Act. The bill is designed to create a clearer federal framework for digital assets, including a more defined division of authority between the Securities and Exchange Commission and the Commodity Futures Trading Commission.

BTCUSD currently trading at $78,486. chart: TradingView

The bill was championed by major crypto companies, including Coinbase, Circle, and Ripple, all of which have sought a degree of regulation for the crypto industry. Senior figures linked to these companies also reacted positively on social media after the Senate Banking Committee advanced the legislation.

Coinbase CEO Brian Armstrong, for instance, stated in a post on X: “looking forward to a bipartisan law that cements the US as the world’s crypto capital. Let’s get CLARITY done.”

The bill still needs to be available for a vote from the full Senate, where 60 yes votes will be required. Projections from SoSoValue show a key window between mid-May and early August, with the House recess beginning July 27 and the Senate recess beginning August 10.

If lawmakers fail to complete full Senate consideration and reconciliation before that period, the bill could be pushed deeper into the fall agenda, and the difficulty of passage will rise significantly.
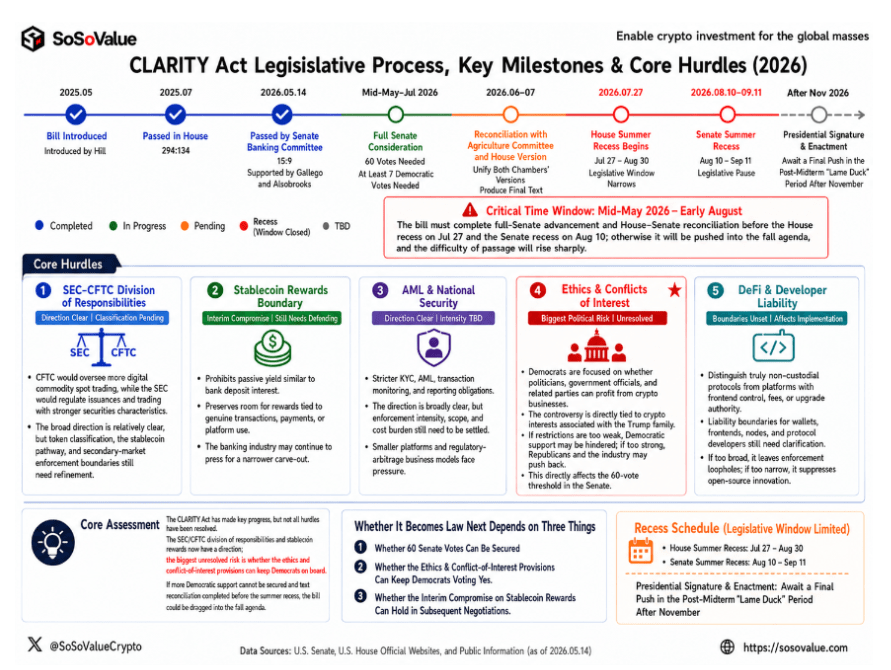
Clarity Act Legislative Process. Source: SoSoValue

Featured image from Unsplash, chart from TradingView

Preguntas relacionadas

QWhat specific event caused Bitcoin social sentiment to reach a yearly high?

AThe landmark committee approval of the CLARITY Act by the US Senate Banking Committee caused Bitcoin social sentiment to soar to its highest point in months.

QAccording to Santiment's data, what was the ratio of bullish to bearish Bitcoin comments on social media on May 15?

AOn May 15, Santiment's data showed a ratio of 1.55 bullish comments for every 1.00 bearish comment regarding Bitcoin on social media.

QWhat is the main purpose of the CLARITY Act as described in the article?

AThe CLARITY Act is designed to create a clearer federal framework for digital assets, including a more defined division of authority between the Securities and Exchange Commission (SEC) and the Commodity Futures Trading Commission (CFTC).

QWhich major crypto companies are mentioned as champions of the CLARITY Act?

AMajor crypto companies championing the CLARITY Act include Coinbase, Circle, and Ripple.

QWhat are the key legislative deadlines mentioned for the CLARITY Act to be passed by the full Senate?

AProjections show a key window between mid-May and early August, with the House recess beginning July 27 and the Senate recess beginning August 10. If not passed before this period, the bill could be pushed into the fall agenda, making passage significantly more difficult.

Lecturas Relacionadas

Bitcoin’s path to $80K may hinge on THIS hidden trend

Bitcoin's potential path toward $80,000 is influenced by conflicting market signals. Data shows the Coinbase Bitcoin Premium Index has recorded its longest-ever streak of consecutive negative premiums, indicating muted institutional demand or net selling from U.S. institutions. While such a trend often signals short-term weakness, it doesn't necessarily forecast a long-term bear market. Additionally, a bearish crossover occurred in Bitcoin's Net Unrealized Profit/Loss (NUPL), with its short-term average falling below the longer-term average, suggesting declining investor profitability and waning market momentum. Historically, major bear market bottoms saw the 100-day NUPL drop below zero, but this cycle it remains positive, implying either an unprecedented bottom or a further decline is needed. Currently trading around $63,148, Bitcoin has seen weekly gains but remains below its May peak. Technical indicators present a mixed picture: the MACD shows bullish momentum, while the RSI signals bearish pressure. A positive development is the return of inflows to Bitcoin ETFs after eight weeks of outflows. Analysts hold divergent views; some highlight a key liquidity zone between $48,000-$50,000 where a market bottom could form, while others maintain a more optimistic long-term outlook. Ultimately, while some bullish signs exist, a strong push from institutional investors appears crucial for Bitcoin to challenge the $80,000 level.

ambcryptoHace 20 min(s)

Bitcoin’s path to $80K may hinge on THIS hidden trend

ambcryptoHace 20 min(s)

Unexpected Weak Non-Farm Payrolls Data Pushes BTC to Rebound 11%, FOMC Minutes to Test the Narrative of This Rally

Bitcoin has rebounded 11% from its 21-month low, but the sustainability of this rally hinges entirely on the Federal Reserve's release of the June FOMC meeting minutes. The bounce was triggered by a weaker-than-expected US jobs report, which showed only 57,000 jobs added in June—about half of economists' forecasts. This data prompted traders to scale back bets on further Fed rate hikes, fueling a rally in Bitcoin alongside gold and stocks. The upcoming minutes are critical. They will reveal whether Fed officials, in their mid-June meeting, were already expressing concerns about a weakening labor market, tight credit conditions, or the risks of overtightening—factors that would support the market's recent dovish shift. Conversely, if the discussion focused on persistent inflation and the conditions for more rate hikes, the rally's foundational narrative would crumble. Market indicators show the rebound's fragility. While US spot Bitcoin ETFs saw a significant single-day inflow, it followed a prolonged period of outflows. On-chain data indicates a substantial increase in Bitcoin being moved to exchanges, creating potential sell pressure. Options market positioning suggests key price levels around $60,000 and $62,000 that could either stabilize or accelerate price movement. In essence, Bitcoin's 11% gain is built on speculation about the Fed's private deliberations three weeks ago. The FOMC minutes will replace that speculation with concrete details, and the discrepancy between market expectations and the actual record will determine whether Bitcoin holds above $64,000 or falls back toward $58,000.

marsbitHace 31 min(s)

Unexpected Weak Non-Farm Payrolls Data Pushes BTC to Rebound 11%, FOMC Minutes to Test the Narrative of This Rally

marsbitHace 31 min(s)

Just Now, The World's First Ultra-High-Frame World Model Was Born, Nvidia Content 0, Racing to 50 FPS

Just Now, Global First Ultra-High-Frame World Model Born, 0% NVIDIA, Speeds to 50 FPS A Chinese team has developed MoWorld, the world's first Flash World Model, achieving real-time interactive inference exceeding 50 FPS. Crucially, it is entirely built on domestic NPUs (National Processing Units), bypassing NVIDIA GPUs. Developed by Moxin Technology in collaboration with Zhejiang University's Pan Yunhe academician team, MoWorld represents a complete, closed-loop system from training and distillation to deployment on domestic computing power. The model tackles the critical industry bottleneck of real-time performance, essential for applications like robotics, gaming, and digital worlds. MoWorld achieves this through a full-stack redesign for NPUs, including a proprietary 3D-annotated data pipeline, system-level optimizations for long-sequence training (up to 2000 frames), and inference optimizations like dynamic mixed-precision quantization. On a Huawei Ascend 910C platform, a 14B MoE parameter model achieves over 50 FPS, reducing typical inference costs by 70% compared to equivalent GPU solutions. This breakthrough lowers the deployment barrier, potentially accelerating the industrialization of world models. Key application areas include gaming/entertainment (offering 6-DoF camera control for immersive exploration), embodied AI/autonomous driving (providing a high-fidelity digital training ground), film pre-visualization, and 3D reconstruction/digital twins due to its strong geometric consistency. MoWorld demonstrates that a full-stack domestic compute ecosystem can support cutting-edge, real-time world models, positioning China at a competitive starting line in defining next-generation spatial intelligence standards. The project underscores a shift in competition from model scale to real-world usability and cost-effective deployment.

marsbitHace 1 hora(s)

Just Now, The World's First Ultra-High-Frame World Model Was Born, Nvidia Content 0, Racing to 50 FPS

marsbitHace 1 hora(s)

Pacific 'Fever': How Extreme Weather Becomes Wall Street's Cash Machine?

"Pacific Fever": How Extreme Weather Becomes Wall Street's ATM? The summer of 2026 sees unusually fierce weather across China and globally. The common driver behind this global pattern is a powerful El Niño event, potentially the strongest since 1950, as declared by NOAA. This phenomenon, characterized by warming central/eastern Pacific waters, disrupts global atmospheric circulation, raising risks of floods, droughts, and heatwaves, further intensified by climate change. For financial markets, especially commodities, El Niño is not just weather but a major trading theme. History shows its price impact is profound. In the 1970s, El Niño-driven anchovy collapse in Peru fueled a soybean boom, giving Richard Dennis his first million. Anthony Ward's cocoa empire was built on superior weather intelligence. Most recently in 2024, West African droughts caused cocoa prices to soar over 400%, delivering huge gains for trend-following hedge funds. In 2026, markets are again pricing in future El Niño-induced supply shocks. Despite high current inventories, prices for palm oil, rubber, and sugar have rallied on anticipation of upcoming Southeast Asian droughts and weak Indian monsoons. Analysts identify key indicators to watch: the Niño3.4 index, Indian monsoon rainfall, Malaysian palm oil stocks, and the fundraising scale of specialized weather funds like Moreton Capital. Beyond trading opportunities, a concerning narrative is gaining traction online, linking El Niño with fertilizer shortages and energy supply disruptions to warn of potential global food crises within months. While alarmist, it highlights a deeper truth: the cascading effects of climate-driven weather extremes ultimately translate into higher costs of living for everyone, far beyond the trading floor.

marsbitHace 1 hora(s)

Pacific 'Fever': How Extreme Weather Becomes Wall Street's Cash Machine?

marsbitHace 1 hora(s)

Pacific 'Fever': How Extreme Weather Becomes Wall Street's ATM?

"Pacific 'Fever': How Extreme Weather Becomes Wall Street's Piggy Bank" The article examines how the 2026-2027 El Niño, potentially the strongest since 1950, is not only disrupting global weather but also creating major financial opportunities. It links recent extreme events in China and worldwide to this climate phenomenon, which alters atmospheric patterns, increasing risks of floods, droughts, and heatwaves. The core narrative explores how financial markets capitalize on these disruptions. A hedge fund is raising $500 million specifically to bet on El Niño-affected crops like South African corn and Malaysian palm oil. Historically, such strategies have yielded massive profits. Examples include Richard Dennis ("Turtle Trader") making his first fortune in the 1970s soy boom triggered by El Niño's impact on Peruvian anchovies (a key fishmeal source), and Anthony Ward's cocoa empire built on superior weather intelligence. The 2024 cocoa price surge, driven by West African drought, enriched quantitative trend-following funds. Currently, markets are preemptively bidding up palm oil, rubber, and sugar futures based on anticipated future supply shocks, despite high current inventories. The article details El Niño's asymmetric global impacts: causing drought in Southeast Asia (hurting palm oil/rubber) and India (affecting sugar/cotton), but bringing beneficial rains to South American soy and sugarcane. Key metrics to watch include the Niño3.4 index, Indian monsoon data, and Malaysian palm oil stocks. The true price effects often materialize *after* the El Niño peaks, suggesting 2027 may see the real volatility. The conclusion warns that beyond trading gains, the convergence of El Niño, energy shortages, and fertilizer scarcity poses a systemic risk, potentially raising the cost of living for everyone, turning a climate event into a global economic story.

链捕手Hace 1 hora(s)

Pacific 'Fever': How Extreme Weather Becomes Wall Street's ATM?

链捕手Hace 1 hora(s)

Trading

Spot
活动图片