Bitcoin Price At $59,000 Is The Line In The Sand, Here’s What You Should Know

bitcoinistPublicado a 2026-03-30Actualizado a 2026-03-30

Resumen

Bitcoin's price is currently consolidating between $60,000 and $74,000, with a decisive breakout direction likely determining the market's next major move. Analysts highlight the critical importance of the 200-Week Moving Average, currently at $59,000, as a key support level. Historically, holding above this level has preceded significant bull runs—such as those in 2015, 2019, and 2023—leading to new all-time highs. Maintaining above $59,000 suggests long-term bullish momentum, with dips viewed as buying opportunities. However, a break below this level could signal a bear market and further declines. The macro structure remains optimistic, urging investors to avoid short-term fear.

Over the last few weeks, the Bitcoin price has ping-ponged between $60,000 and $74,000, suggesting that the direction that the price breaks out of in this range could be determinant of what direction the entire market takes next. After dropping more than 45% already, all attention has now shifted to when the pioneer cryptocurrency will make a new bottom. So far, bulls have held up surprisingly well, but there is still a ‘line in the sand’ that the price must not cross.

Bitcoin Macro Structure Is Still Bullish

Presently, the Bitcoin price is still holding well above the 200-Week Moving Average, which is very bullish for the price, according to crypto analyst Crypto Patel. The reason for this dates back to the past market cycles, where the 200-Week Moving Average has been the major level to hold or beat.

Digging into the past cycles, Crypto Patel explained that the Bitcoin price had been able to stay above the 200-Week Moving Average back in 2015. The result of this was a major rally that saw the Bitcoin price rally toward $20,000 in the bull market that followed.

Then again, in 2019, the same 200-Week Moving Average held firm, and the resulting bull market led to the 2021 peak of $69,000. Even the third time in 2023, despite the price preciously crashing below $20,000, Bitcoin had managed to hold above the 200-Week Moving Average, and bulls were rewarded as the price would reach $126,000 in 2025.

Source: X

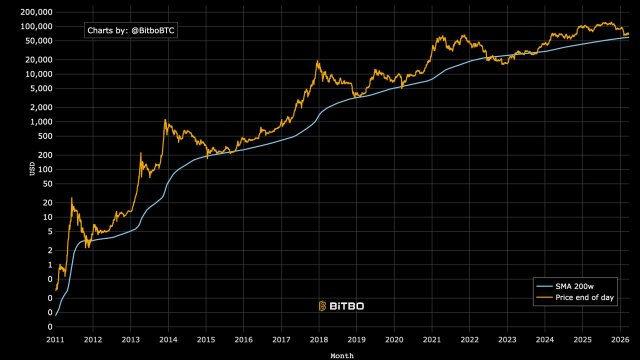
Given this trend, it becomes obvious that the Bitcoin price being above the 200-Week MA is bullish, and likewise, a crash below it would be bearish. This is why it is important for the bulls to maintain a hold on this level.

BTC Price Must Not Fall Below $59,000

Going by the analyst’s post, the current 200-Week Moving Average for Bitcoin lies at $59,000. This immediately makes it the level to defend for the bulls. As Crypto Patel explains, as long as the Bitcoin price stays above this level, then ‘every dip is a gift.’ This means it could be an opportunity to buy.

If historical trends are to be respected, holding the 200W MA would mean that the Bitcoin price would see new all-time highs sometime in 2028. “The Macro Structure Is Still Bullish. Don’t Let Short-Term Fear Shake You Out,” the analyst warns.

Alternatively, a break below this 200-Week Moving Average could be disastrous for Bitcoin, because it would mean that the cryptocurrency has now officially entered bear market territory. It could also bring the harbinger of more decline, sending the cryptocurrency lower before establishing a bottom.

BTC bulls begin to push upward again | Source: BTCUSD on Tradingview.com

Preguntas relacionadas

QWhat is the significance of the $59,000 level for the Bitcoin price according to the article?

AThe $59,000 level represents the current 200-Week Moving Average, which is a critical support level. Historically, Bitcoin has entered a bull market after holding above this level. A break below it could signal an official entry into a bear market.

QWhat historical evidence does the analyst, Crypto Patel, provide to support the importance of the 200-Week Moving Average?

ACrypto Patel points to three previous cycles: in 2015, holding above the 200-Week MA led to a rally to $20,000; in 2019, it led to the 2021 peak of $69,000; and in 2023, it preceded a rally to $126,000 in 2025.

QWhat is the potential consequence if the Bitcoin price breaks below the 200-Week Moving Average?

AA break below the 200-Week Moving Average would be disastrous as it would mean Bitcoin has officially entered bear market territory and could lead to further decline before a bottom is established.

QWhat is the analyst's advice for investors if the price holds above the $59,000 level?

AThe analyst advises that as long as the price stays above $59,000, 'every dip is a gift,' meaning it should be seen as a buying opportunity, and investors should not be shaken out by short-term fear.

QWhat is the projected long-term outcome if Bitcoin respects the historical trend and holds the 200-Week MA?

AIf the historical trend is respected and Bitcoin holds the 200-Week MA, the price is projected to reach new all-time highs sometime in 2028.

Lecturas Relacionadas

Trading

Spot
Futuros

Artículos destacados

Cómo comprar SAND

¡Bienvenido a HTX.com! Hemos hecho que comprar The Sandbox (SAND) sea simple y conveniente. Sigue nuestra guía paso a paso para iniciar tu viaje de criptos.Paso 1: crea tu cuenta HTXUtiliza tu correo electrónico o número de teléfono para registrarte y obtener una cuenta gratuita en HTX. Experimenta un proceso de registro sin complicaciones y desbloquea todas las funciones.Obtener mi cuentaPaso 2: ve a Comprar cripto y elige tu método de pagoTarjeta de crédito/débito: usa tu Visa o Mastercard para comprar The Sandbox (SAND) al instante.Saldo: utiliza fondos del saldo de tu cuenta HTX para tradear sin problemas.Terceros: hemos agregado métodos de pago populares como Google Pay y Apple Pay para mejorar la comodidad.P2P: tradear directamente con otros usuarios en HTX.Over-the-Counter (OTC): ofrecemos servicios personalizados y tipos de cambio competitivos para los traders.Paso 3: guarda tu The Sandbox (SAND)Después de comprar tu The Sandbox (SAND), guárdalo en tu cuenta HTX. Alternativamente, puedes enviarlo a otro lugar mediante transferencia blockchain o utilizarlo para tradear otras criptomonedas.Paso 4: tradear The Sandbox (SAND)Tradear fácilmente con The Sandbox (SAND) en HTX's mercado spot. Simplemente accede a tu cuenta, selecciona tu par de trading, ejecuta tus trades y monitorea en tiempo real. Ofrecemos una experiencia fácil de usar tanto para principiantes como para traders experimentados.

236 Vistas totalesPublicado en 2024.12.10Actualizado en 2025.03.21

Cómo comprar SAND

Discusiones

Bienvenido a la comunidad de HTX. Aquí puedes mantenerte informado sobre los últimos desarrollos de la plataforma y acceder a análisis profesionales del mercado. A continuación se presentan las opiniones de los usuarios sobre el precio de SAND (SAND).

活动图片