Bitcoin Is Entering A Window For A Santa Rally, Analyst Says

bitcoinistPublicado a 2025-12-22Actualizado a 2025-12-22

Resumen

Bitcoin is showing signs of a potential Santa rally, according to CryptoQuant analyst Axel Adler Jr. The market’s current “Regime Score” sits at +16.3, placing it in the upper neutral zone (+15 to +30), which historically has delivered average returns of +3.8% over 30 days. This suggests a tactical bullish setup without excessive optimism. Additionally, the derivatives market shows a skew toward short liquidations, creating mechanical upward pressure as forced buyers enter the market. However, Adler cautions that entering the formal Bull regime (above +30) has historically coincided with local tops. The current “bullish neutrality” offers a favorable window for upside, though a drop in the Regime Score below zero or a shift toward long liquidations would signal exhaustion. Bitcoin traded at $89,864 at the time of writing.

Bitcoin might be stumbling into a very seasonal setup, not because Santa is real, but because positioning and one of those composite “regime” dashboards are flashing the kind of “bullish, but not sweaty” signal traders love to cling to in late December.

CryptoQuant analyst Axel Adler Jr. put it bluntly on X on Monday: “BTC is entering a window for a Santa rally: the Regime Score is bullish but not overheated. Short liquidations are reinforcing the asymmetry in favor of buyers.”
That’s the headline claim. The longer version is basically: the market is in a zone that has historically had decent forward returns, and the derivatives plumbing is currently doing that annoying-but-useful thing where it mechanically pushes price higher when shorts get forced out.

Will Bitcoin See A ‘Santa Rally’ This Year?

In his Monday Substack post, Adler framed it as a tactical setup rather than some grand, end-of-year prophecy. “The BTC market is in the upper part of the Regime Score neutral zone, which has historically shown positive expected returns,” he wrote. Then he tightened the screw: “The current liquidation structure in the futures market indicates a predominance of short position closures, creating additional mechanical pressure in favor of buyers.”

So what’s this Regime Score thing, exactly? Adler describes it as a composite indicator that “combines taker imbalance, OI pressure, funding, ETF flows, exchange flows, and price trend into a single scale from −100 to +100.” The number matters less than the band it sits in. Right now, he says the score “stands at +16.3, corresponding to the upper part of the neutral zone (+15 to +30).”
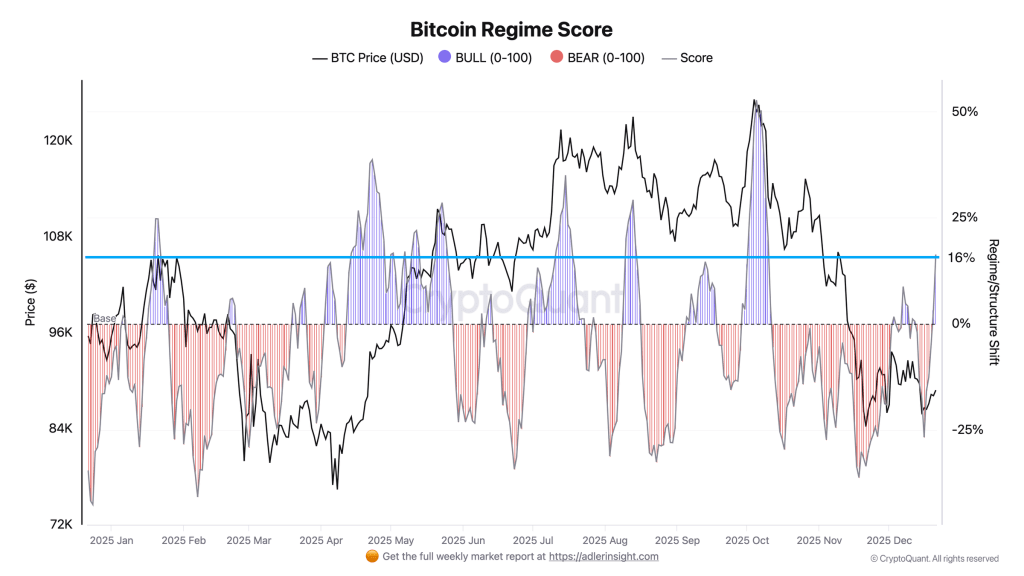
Bitcoin Regime Score | Source: Axel Adler Jr

And that particular subzone is doing the heavy lifting in his argument. “Backtesting for 2025 shows this subzone historically delivered average returns of +3.8% over 30 days,” Adler wrote, contrasting it with the weaker ranges below. He also pointed out that, “unlike the −15 to 0 subzone where expected returns were negative (−1.5% over 7d),” the +15 to +30 band tended to be a more forgiving place to put on risk.

It’s also worth noting how quickly the tape can flip, because his own charting suggests it already did. Adler says the indicator “has emerged from a recent bearish phase (score dropped to −27 a week ago) and is showing recovery.” That’s the kind of detail traders latch onto: not just where you are, but how fast you got there.

But here’s the funny part — the “most bullish” zone, in his backtest, wasn’t actually bullish for forward returns. He flags that “transition into the formal Bull regime (+30 and above) historically coincided with local tops” and that it “delivered negative average returns of −3.3% over 7 days.” In other words, if you wait for the indicator to scream “bull market,” you might be buying the exact moment everyone else is already leaning the same way.

Which is why Adler ends up with a pretty trader-ish conclusion: the current band might be the sweet spot because it’s optimistic without being euphoric.

“This means the current +15–30 zone may be optimal for tactical positions, while aggressive accumulation upon breaking +30 carries elevated risk,” he wrote.

Then there’s the derivatives side — the part that can turn a calm-looking market into a sudden wick up (or down) just because leverage is sitting in the wrong place. Adler’s liquidation dominance oscillator is currently negative, which he reads as a short liquidation skew. “The oscillator’s current value has dropped into negative territory (−11%), while the 30-day moving average remains positive (+10%). This divergence points to a recent surge in forced short position closures,” he wrote.

He doubles down with a second stat: “Long Liquidation Dominance stands at 44%, below the 50% baseline, confirming the predominance of short liquidations.” Put simply: more shorts are getting forced out than longs are getting wiped, and those forced closes are buys.
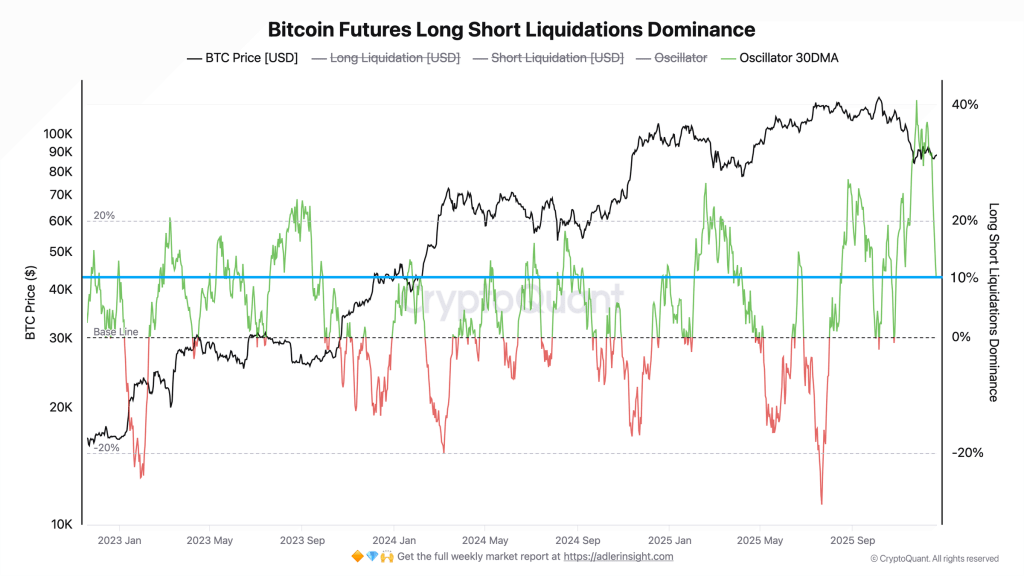
Bitcoin Futures Long Short- Liquidations Dominance | Source: Axel Adler Jr

And his takeaway is basically: this is tactical fuel. “The predominance of short liquidations creates tactical fuel for upside,” Adler wrote, adding that the setup “reinforces the positive signal from Regime Score: the market has not only entered a zone with historically positive expected returns but is also receiving additional support from derivatives structure.”

Still, this is Bitcoin, and these setups don’t last forever. Adler even lays out what would invalidate it, in pretty plain language. “A return of Regime Score below zero accompanied by a reversal of the liquidation oscillator into positive territory (rising long liquidations) would signal exhaustion of the current impulse,” he wrote. Translation: if longs start being the ones getting punished, that “asymmetry” flips.

For now, he’s calling it a “bullish neutrality” moment. Not full-blown melt-up territory, not the kind of reading that screams “local top” either. Just a window where, if the market wants to drift higher into year-end, the positioning doesn’t look like it’s going to fight it.

At press time, Bitcoin traded at $89,864.
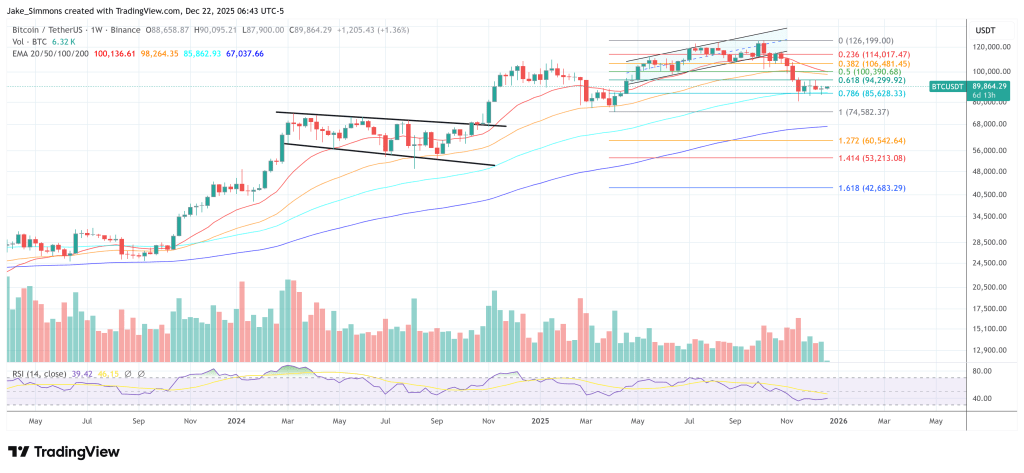
Bitcoin remains stuck between the 0.618 and 0.786 Fib, 1-week chart | Source: BTCUSDT on TradingView.com

Criptos en tendencia

Preguntas relacionadas

QWhat is the current Bitcoin Regime Score and what does it indicate according to Axel Adler Jr.?

AThe current Bitcoin Regime Score is +16.3, which is in the upper part of the neutral zone (+15 to +30). This zone has historically shown positive expected returns of +3.8% over 30 days, indicating a 'bullish, but not overheated' market condition that is optimal for tactical positions.

QHow does the liquidation structure in the futures market currently support a potential price increase?

AThe liquidation dominance oscillator is in negative territory (-11%), indicating a predominance of short position closures. With Long Liquidation Dominance at 44% (below the 50% baseline), this confirms that more shorts are being forced out than longs. These forced short liquidations create mechanical buying pressure, reinforcing the upside for buyers.

QAccording to the analyst, what would invalidate the current bullish tactical setup?

AThe setup would be invalidated by a return of the Regime Score below zero, accompanied by a reversal of the liquidation oscillator into positive territory. This would signal a shift where long liquidations are rising, indicating exhaustion of the current bullish impulse and a flip in market asymmetry.

QWhy does the analyst consider the current 'Bull' regime (score above +30) to be less ideal for entering positions?

AHistorical backtesting shows that a transition into the formal Bull regime (score of +30 and above) has often coincided with local tops and delivered negative average returns of -3.3% over 7 days. This suggests that entering at that point might mean buying when the market is already euphoric and due for a pullback.

QWhat is the overall market condition described by the analyst, and at what price was Bitcoin trading at press time?

AThe overall market condition is described as 'bullish neutrality' or a 'bullish, but not sweaty' signal. It is a tactical setup where the market is optimistic without being euphoric, providing a window for a year-end rally. At press time, Bitcoin was trading at $89,864.

Lecturas Relacionadas

Analyzing the Impact of AI on Economic Growth and Productivity

**Title: Analyzing AI's Impact on Economic Growth and Productivity** This article examines three contrasting views on AI's influence on economic growth and productivity. **The Optimistic View** posits that AI, especially through automating R&D ("recursive self-improvement"), could dramatically accelerate growth, even triggering a technological "singularity" with explosive, potentially infinite, economic expansion. **The Moderate/Mainstream View** acknowledges AI's productivity benefits but emphasizes significant real-world constraints that could limit its impact. These include: limited cost savings per task, structural ceilings on which jobs and industries are "exposed" to AI, adoption bottlenecks (e.g., compute, energy, regulatory hurdles), and the "weak link" effect where non-automatable tasks cap overall gains. Consequently, the realized AI dividend may be far lower than optimistic projections, with estimates typically ranging from 0.1% to 1.3% annual productivity growth. **The Pessimistic View** stems from two strands. The first aligns with the moderate view but applies extremely conservative assumptions about task exposure and efficiency gains, yielding minimal projected impact. The second introduces a demand-side critique: if AI primarily replaces rather than augments labor, it could depress labor's share of income, weaken consumer demand, and create a "demand trap" that ultimately stifles growth, unless offset by redistribution policies. **The authors' assessment** is nuanced: * **Short-term (1-2 years):** AI will support growth primarily through investment spending, not significant productivity gains. * **Medium-term (3-5 years):** Three potential paths emerge based on AI demand and bottleneck severity: 1. **"Optimistic Path":** High demand, few bottlenecks. Rapid productivity gains but risk of major job displacement and social conflict without redistribution. 2. **"Moderate Path" (most likely):** High demand but significant, surmountable bottlenecks. Leads to moderate productivity gains, financial market volatility (K-shaped returns), and sectoral job losses. 3. **"Pessimistic Path":** Low demand or severe bottlenecks. Minimal productivity and growth impact, triggering financial market corrections but allowing a smoother societal transition with less labor disruption. * **Long-term:** AI holds potential for a major productivity revolution and prosperity. The conclusion stresses that no path is smooth. Technologically "optimistic" outcomes could be socially detrimental, while "pessimistic" technological diffusion might be more socially stable. Policymakers must monitor developments and prepare balanced responses to manage economic, financial, and social sustainability.

marsbitHace 25 min(s)

Analyzing the Impact of AI on Economic Growth and Productivity

marsbitHace 25 min(s)

The New Cold War is a Tech Stock War

The New Cold War is a Tech Stock War The article argues that the contemporary geopolitical and economic rivalry between the US and China represents a "New Cold War," but one fundamentally fought through technology and financial markets, not physical barriers or conventional trade. Historically, US dominance was secured through financial systems. The Soviet Union, reliant on the rigid "Transferable Ruble," was ultimately undermined by its dependency on the US dollar for oil trade. Later, Japan's semiconductor challenge was countered not just by tariffs (e.g., Plaza Accord, 301 investigations) but by binding it to US Treasury bonds. China presents a more complex, "embedded" challenger. While it holds vast dollar reserves and US debt like Japan, its industrial base is stronger and more diversified than the Soviet Union's. Surviving the initial 2018 trade war phase, the conflict has evolved into a "tech-financial war." The core battlefield is now the stock market. US tech stocks (AI, semiconductors) are treated as sovereign assets, buoyed by bipartisan national will. China is pushing to strengthen its own financial markets to convert industrial strength into financial power and fund its tech ambitions. Companies like ChangXin (semiconductors), Moonshot AI, and DJI compete not just for market share but as financial proxies for their respective systems. The new paradigm is moving from globally efficient monopolies (Apple, Google) towards companies that achieve monopolistic profits within their respective geopolitical spheres. This competition over "pricing power" and financial valuation in segmented markets defines the current era, making the stock market the primary arena for this tech-centric struggle.

marsbitHace 34 min(s)

The New Cold War is a Tech Stock War

marsbitHace 34 min(s)

Trading

Spot

Artículos destacados

Cómo comprar O

¡Bienvenido a HTX.com! Hemos hecho que comprar O1 exchange (O) sea simple y conveniente. Sigue nuestra guía paso a paso para iniciar tu viaje de criptos.Paso 1: crea tu cuenta HTXUtiliza tu correo electrónico o número de teléfono para registrarte y obtener una cuenta gratuita en HTX. Experimenta un proceso de registro sin complicaciones y desbloquea todas las funciones.Obtener mi cuentaPaso 2: ve a Comprar cripto y elige tu método de pagoTarjeta de crédito/débito: usa tu Visa o Mastercard para comprar O1 exchange (O) al instante.Saldo: utiliza fondos del saldo de tu cuenta HTX para tradear sin problemas.Terceros: hemos agregado métodos de pago populares como Google Pay y Apple Pay para mejorar la comodidad.P2P: tradear directamente con otros usuarios en HTX.Over-the-Counter (OTC): ofrecemos servicios personalizados y tipos de cambio competitivos para los traders.Paso 3: guarda tu O1 exchange (O)Después de comprar tu O1 exchange (O), guárdalo en tu cuenta HTX. Alternativamente, puedes enviarlo a otro lugar mediante transferencia blockchain o utilizarlo para tradear otras criptomonedas.Paso 4: tradear O1 exchange (O)Tradear fácilmente con O1 exchange (O) en HTX's mercado spot. Simplemente accede a tu cuenta, selecciona tu par de trading, ejecuta tus trades y monitorea en tiempo real. Ofrecemos una experiencia fácil de usar tanto para principiantes como para traders experimentados.

366 Vistas totalesPublicado en 2026.06.19Actualizado en 2026.06.29

Cómo comprar O

Cómo comprar PROS

¡Bienvenido a HTX.com! Hemos hecho que comprar Pharos (PROS) sea simple y conveniente. Sigue nuestra guía paso a paso para iniciar tu viaje de criptos.Paso 1: crea tu cuenta HTXUtiliza tu correo electrónico o número de teléfono para registrarte y obtener una cuenta gratuita en HTX. Experimenta un proceso de registro sin complicaciones y desbloquea todas las funciones.Obtener mi cuentaPaso 2: ve a Comprar cripto y elige tu método de pagoTarjeta de crédito/débito: usa tu Visa o Mastercard para comprar Pharos (PROS) al instante.Saldo: utiliza fondos del saldo de tu cuenta HTX para tradear sin problemas.Terceros: hemos agregado métodos de pago populares como Google Pay y Apple Pay para mejorar la comodidad.P2P: tradear directamente con otros usuarios en HTX.Over-the-Counter (OTC): ofrecemos servicios personalizados y tipos de cambio competitivos para los traders.Paso 3: guarda tu Pharos (PROS)Después de comprar tu Pharos (PROS), guárdalo en tu cuenta HTX. Alternativamente, puedes enviarlo a otro lugar mediante transferencia blockchain o utilizarlo para tradear otras criptomonedas.Paso 4: tradear Pharos (PROS)Tradear fácilmente con Pharos (PROS) en HTX's mercado spot. Simplemente accede a tu cuenta, selecciona tu par de trading, ejecuta tus trades y monitorea en tiempo real. Ofrecemos una experiencia fácil de usar tanto para principiantes como para traders experimentados.

387 Vistas totalesPublicado en 2026.06.22Actualizado en 2026.06.29

Cómo comprar PROS

Qué es VERONA

I. Introducción al Proyecto VERONA es una blockchain construida para todos, en todas partes a través de la abstracción de cadenas. Utilizando su capa de Abstracción Generalizada, VERONA se distingue por integrar funcionalidades complejas de blockchain, como cuentas, firmas e interoperabilidad, directamente a nivel de protocolo. Este enfoque permite interactuar con aplicaciones de blockchain sin necesidad de entender las tecnologías subyacentes.1) Información Básica Nombre: VERONA (VERONA)III. Enlaces Relacionados Enlace al sitio web oficial: https://xion.burnt.com/ Libro Blanco: https://xion.burnt.com/whitepaper.pdf Exploradores: https://explorer.burnt.com/ Redes Sociales: https://x.com/burnt_xion Nota: La introducción del proyecto proviene de los materiales publicados o proporcionados por el equipo oficial del proyecto, que es solo para referencia y no constituye asesoramiento de inversión. HTX no se hace responsable de ninguna pérdida directa o indirecta resultante.

429 Vistas totalesPublicado en 2026.06.22Actualizado en 2026.06.22

Qué es VERONA

Discusiones

Bienvenido a la comunidad de HTX. Aquí puedes mantenerte informado sobre los últimos desarrollos de la plataforma y acceder a análisis profesionales del mercado. A continuación se presentan las opiniones de los usuarios sobre el precio de A (A).

活动图片