Bitcoin hunts liquidity as US CPI inflation drops to lowest since 2021

cointelegraphPublicado a 2025-12-18Actualizado a 2025-12-18

Resumen

US CPI inflation dropped to 2.7% year-over-year in November, the lowest level since March 2021, significantly below expectations. This led to increased market volatility, with Bitcoin briefly surpassing $89,000 before retracing. The unexpected decline fuels expectations of Federal Reserve interest rate cuts, with markets pricing in a 26.6% probability of a cut in January. Analysts note Bitcoin's price action resembles early 2025 patterns, suggesting potential further downside toward $75,000. Over $630 million in crypto liquidations occurred amid ongoing volatility and perceived market manipulation.

Bitcoin (BTC) ramped up volatility into Thursday’s Wall Street open as markets reacted to surprise US inflation data.

Key points:

  • Bitcoin traders weather more snap BTC price volatility as CPI surprises to the downside.

  • US inflation unexpectedly drops to multiyear lows, fueling bets of interest-rate cuts.

  • Bitcoin price action continues repeating its early 2025 fractal.

Bitcoin stays erratic after “massive” CPI miss

Data from Cointelegraph Markets Pro and TradingView showed BTC/USD passing $89,000 before reversing lower.

BTC/USD one-hour chart. Source: Cointelegraph/TradingView


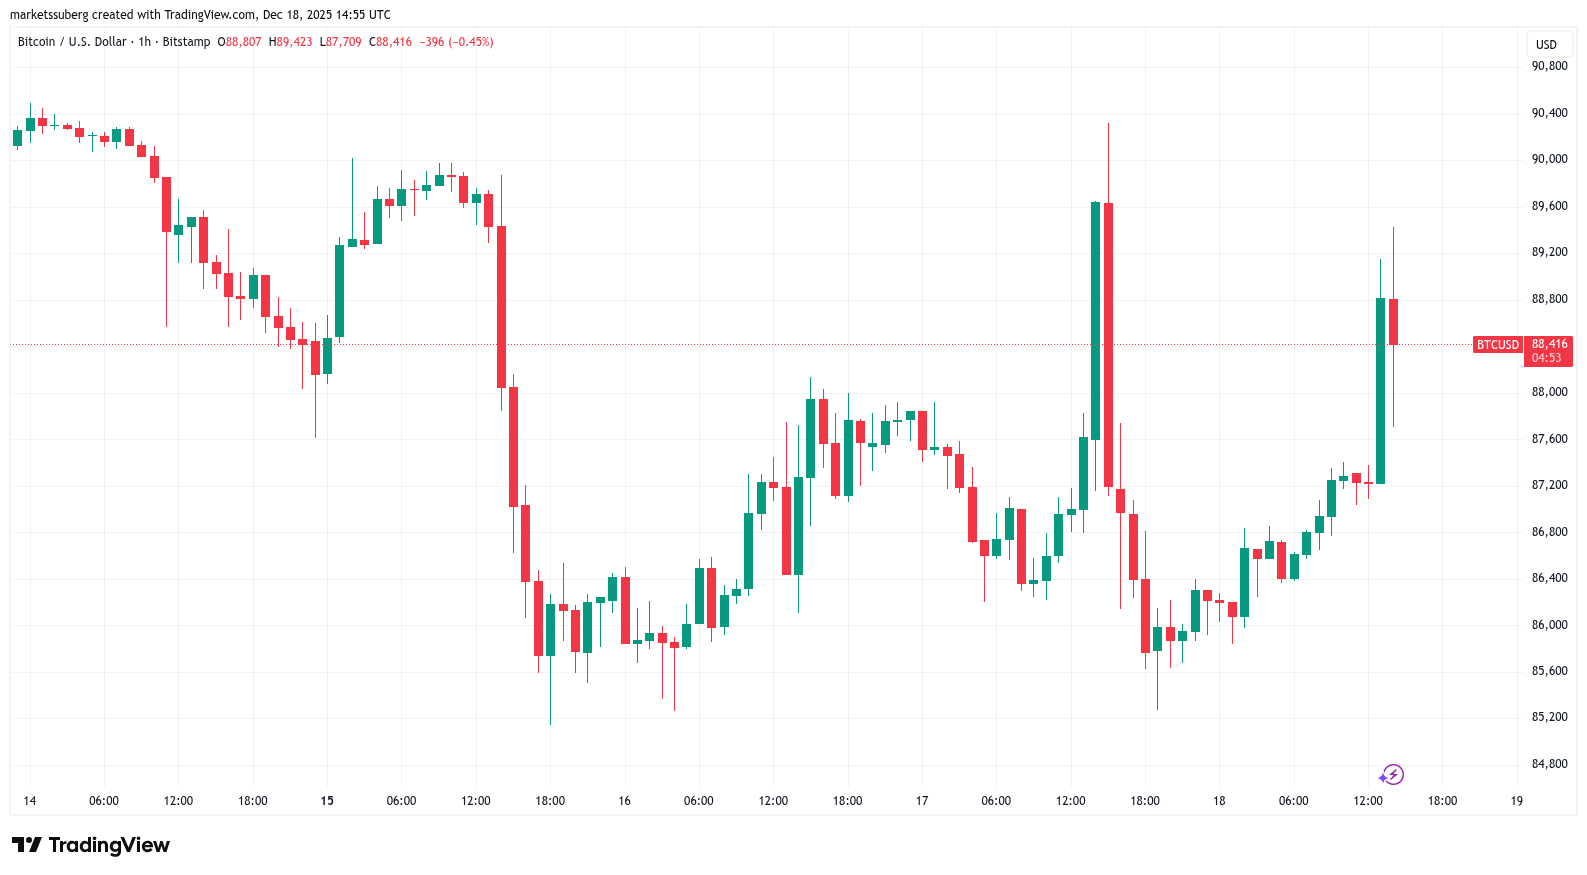
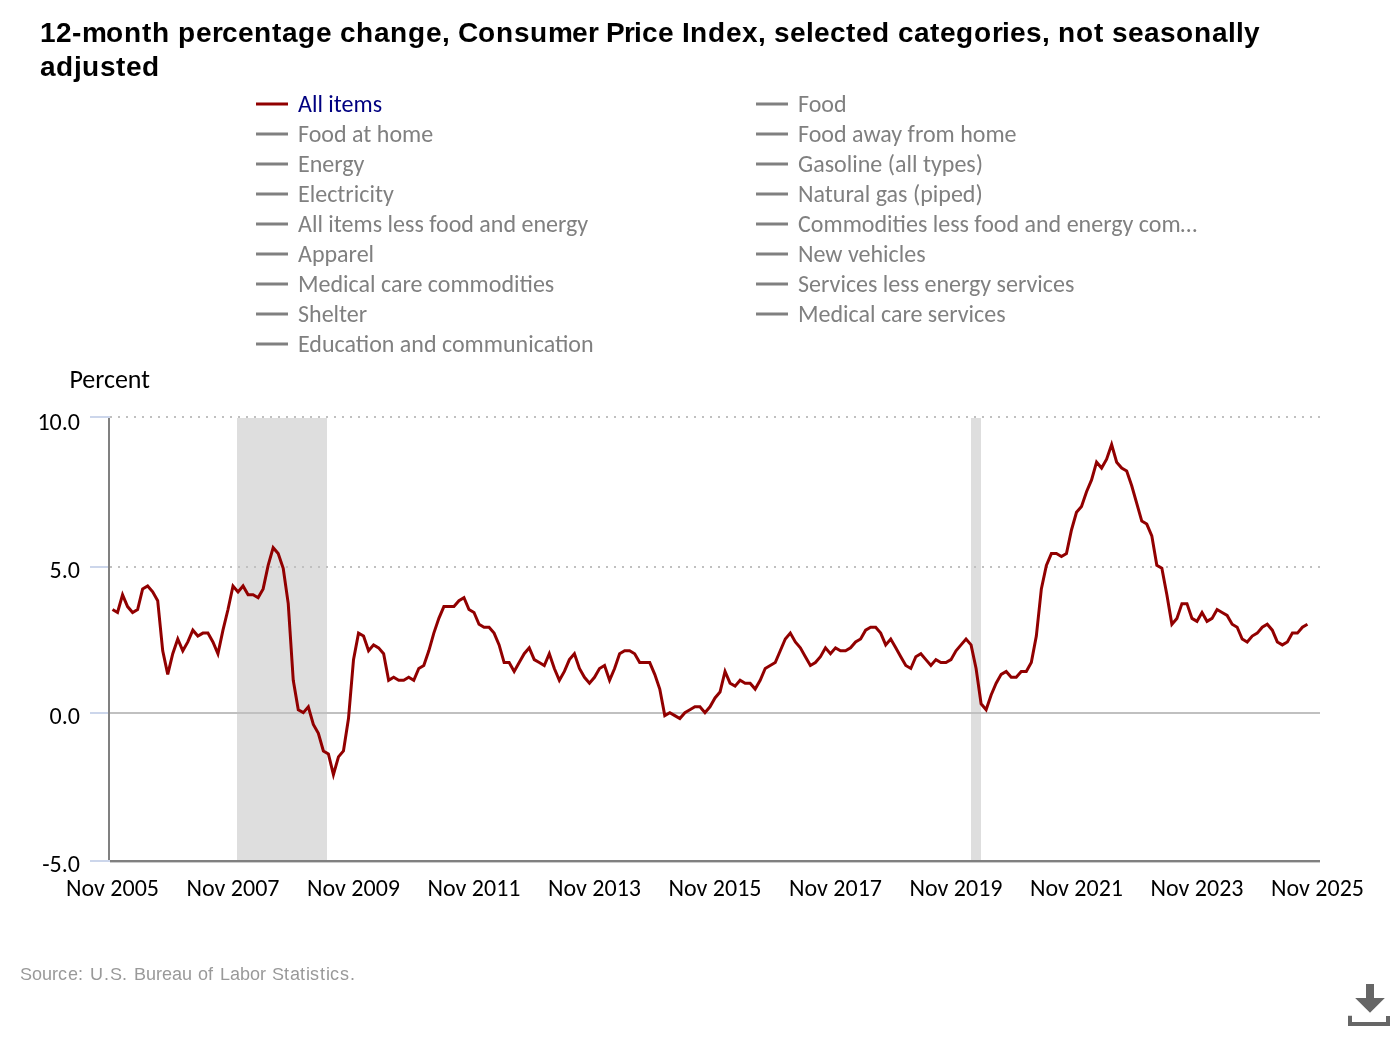
The move followed the November release of the Consumer Price Index (CPI), which printed one of its largest monthly declines since 2023 — firmly against expectations.

“The all items index rose 2.7 percent for the 12 months ending November, after rising 3.0 percent over the 12 months ending September,” an official statement from the US Bureau of Labor Statistics (BLS) confirmed.

The BLS noted that October’s CPI report was not issued due to the government shutdown.

Reacting, trading resource The Kobeissi Letter led the surprise, suggesting that contrarian inflation signals could continue into next year.

“This puts Core CPI inflation in the US at its lowest level since March 2021,” it wrote in a post on X.

“According to this data, inflation is now at its closest point to the Fed's 2% target since the pandemic. 2026 is going to be a wild year.”
US CPI 12-month % change. Source: BLS


Versus the anticipated 3.1% increase, CPI had come in short by a “massive amount,” crypto trader Daan Crypto Trades continued.

“Risk assets like $BTC are rallying on the back of this, combined with a large fall in the dollar and bond yields,” an X post read.

“The 3 month annualized CPI is now just slightly over 2%. This should be very welcomed by the Fed. More rate cuts are expected to get priced in following this data.”
Fed target rate probabilities for January FOMC meeting (screenshot). Source: CME Group


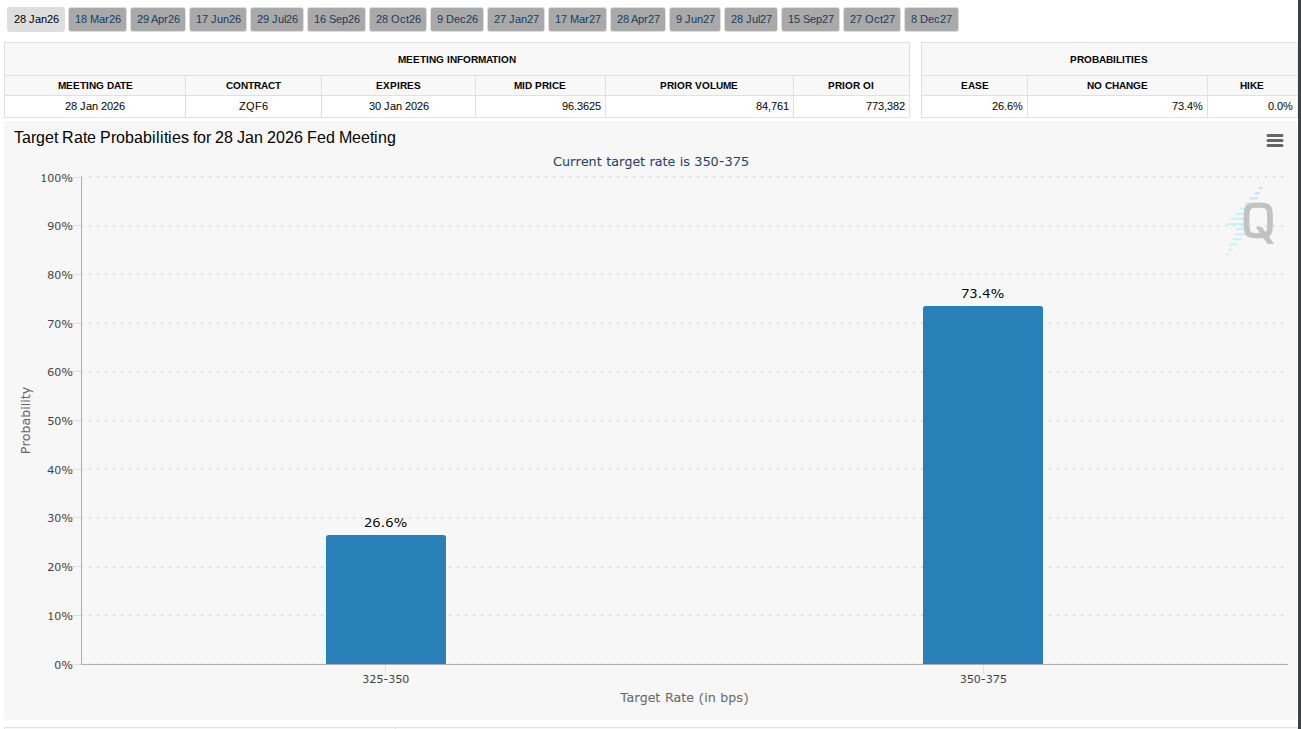
Data from CME Group’s FedWatch Tool put the odds of a fresh interest-rate cut at the Fed’s Jan. 28 meeting at 26.6%.

New long-term BTC price low next?

As Cointelegraph reported, traders were suspicious of Bitcoin price action through this week and last due to “fakeouts” in either direction during US trading sessions.

Related: Bears take over below $90K? 5 things to know in Bitcoin this week

Accusations of market “manipulation” came as BTC/USD hit walls of liquidity both above and below while failing to sustain a new trend.

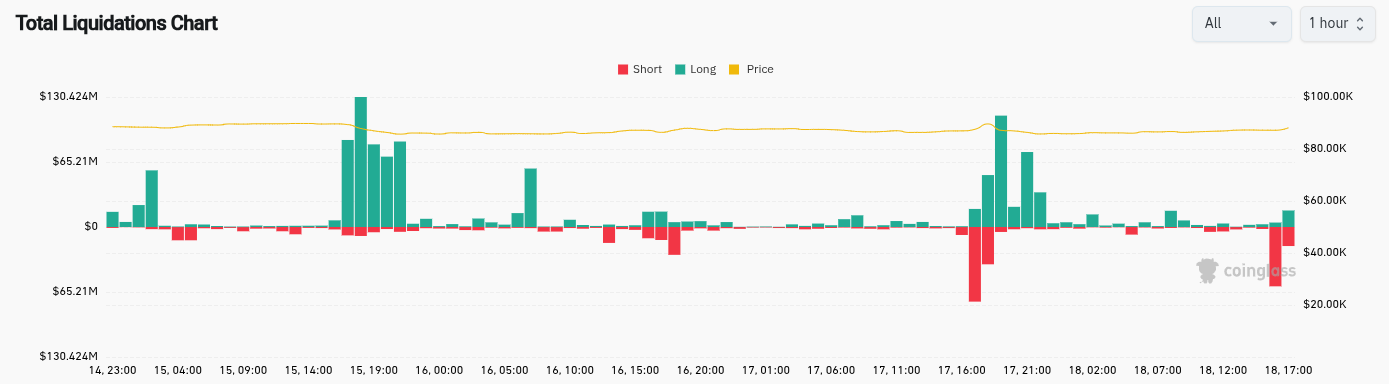
Total crypto liquidations for the 24 hours to the time of writing were over $630 million, per CoinGlass.

Crypto total liquidations (screenshot). Source: CoinGlass


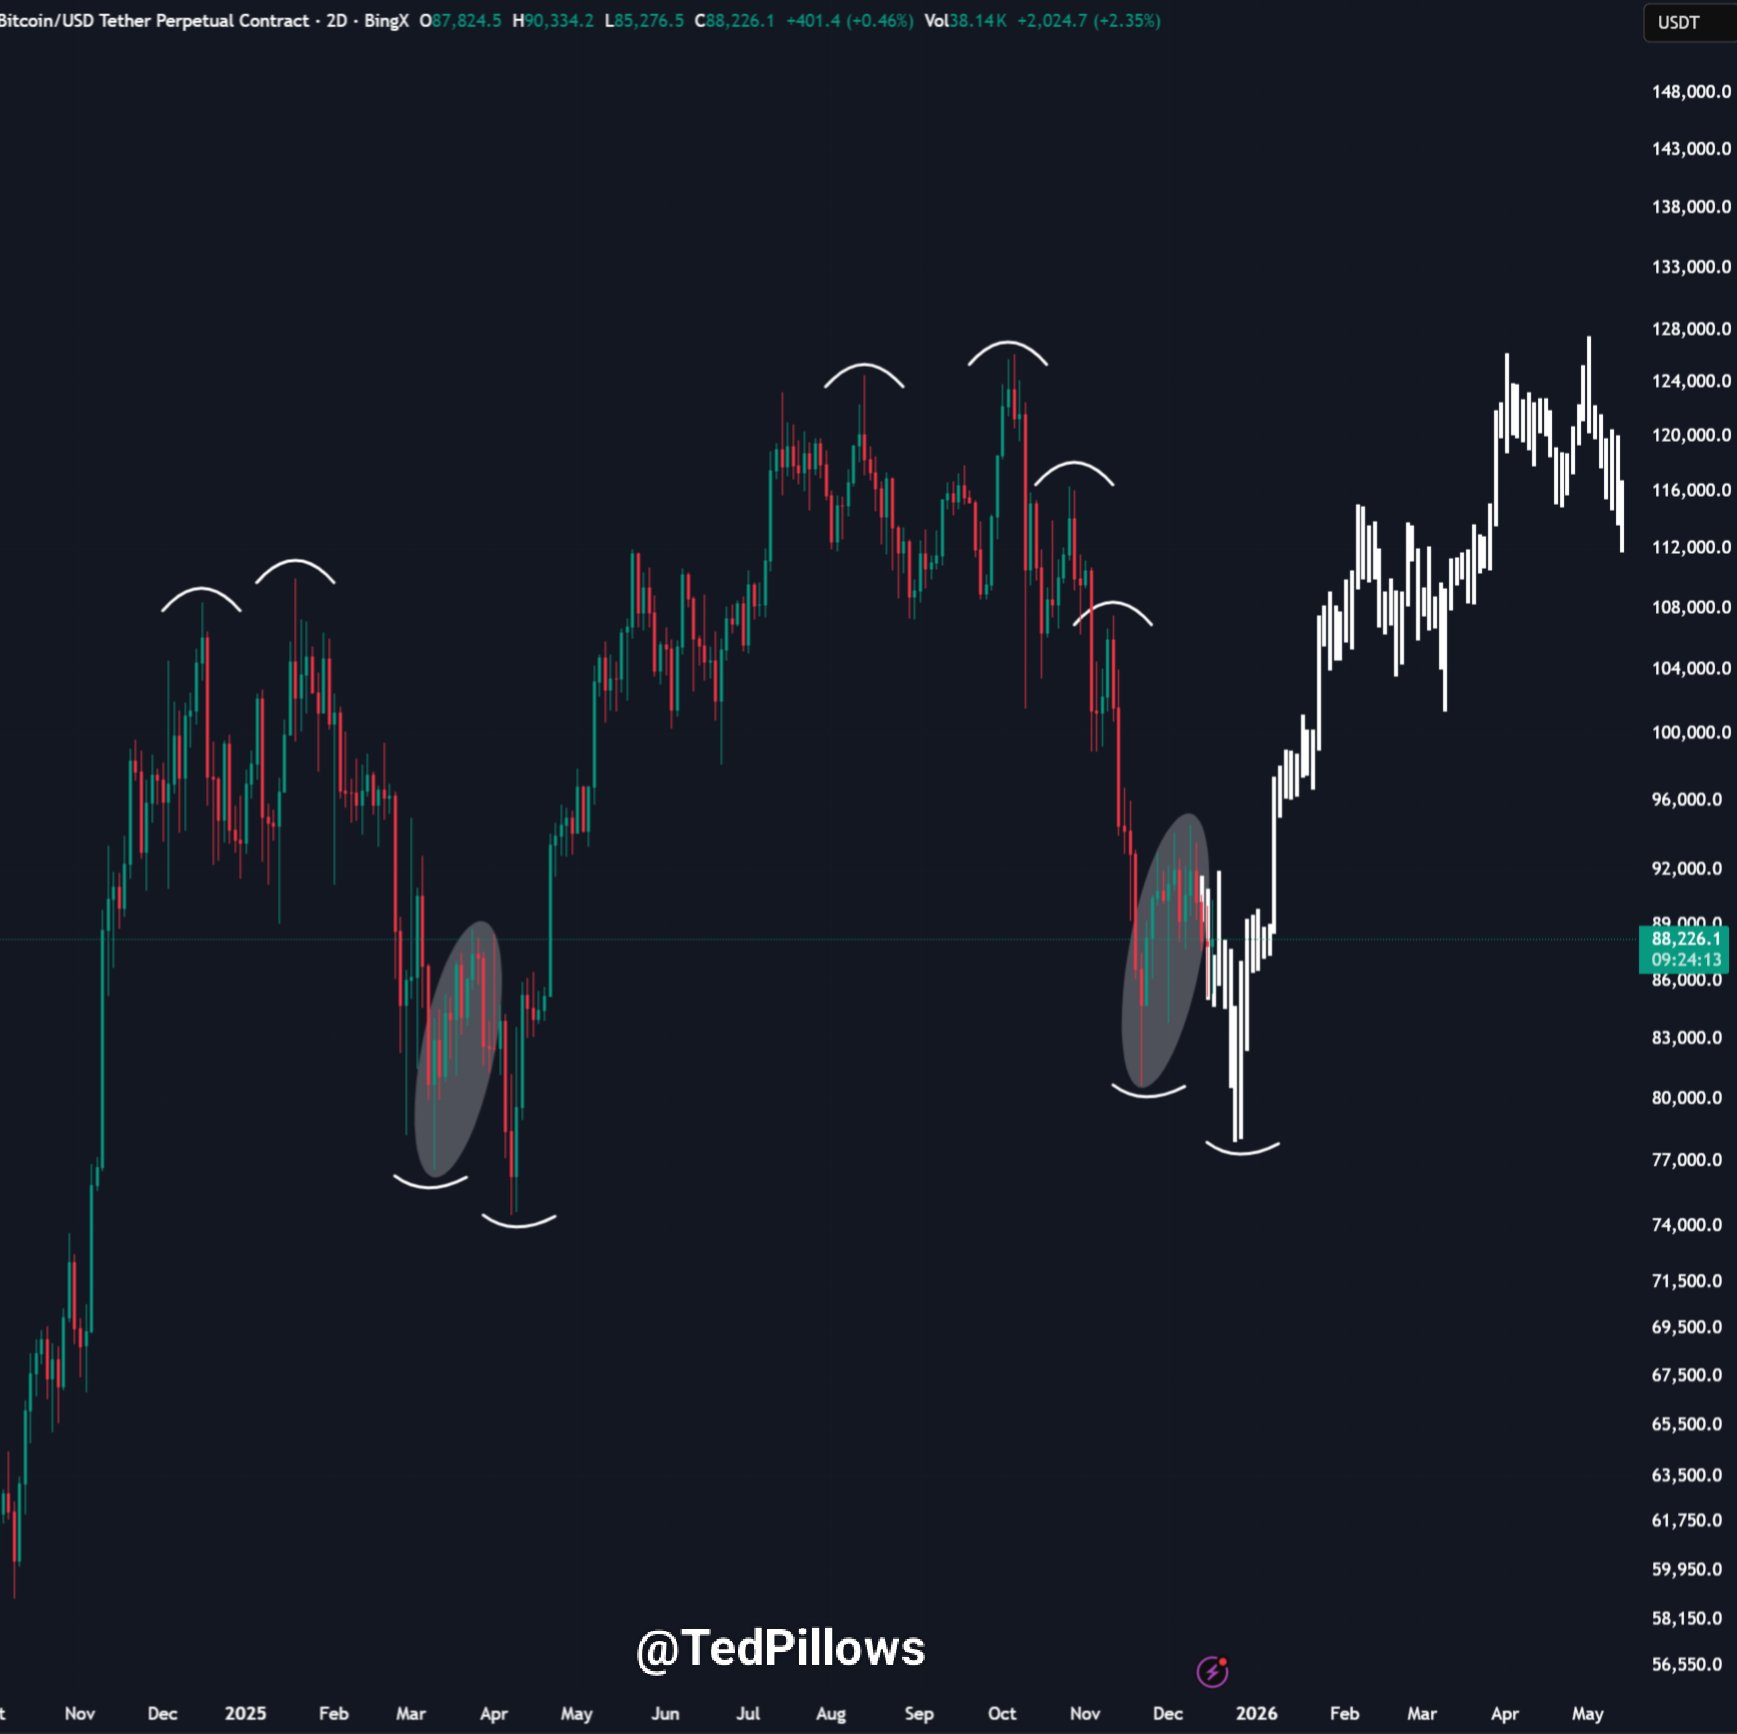
With the snap moves continuing on the day, crypto trader and entrepreneur Ted Pillows eyed similarities to the start of the year.

“$BTC is mimicking the Q1 2025 fractal. What if this plays out?” he queried alongside a chart of Bitcoin futures.

The chart implied another macro bottom for BTC/USD still to come, similar to that seen in early April when the pair briefly dipped below $75,000.

Bitcoin futures chart fractal. Source: Ted Pillows/X

This article does not contain investment advice or recommendations. Every investment and trading move involves risk, and readers should conduct their own research when making a decision. While we strive to provide accurate and timely information, Cointelegraph does not guarantee the accuracy, completeness, or reliability of any information in this article. This article may contain forward-looking statements that are subject to risks and uncertainties. Cointelegraph will not be liable for any loss or damage arising from your reliance on this information.

Preguntas relacionadas

QWhat was the key economic data released that caused Bitcoin's price volatility?

AThe US Consumer Price Index (CPI) for November, which showed inflation dropping to 2.7% year-over-year, the lowest since March 2021 and a significant miss against expectations.

QHow did the unexpected CPI data impact market expectations for Federal Reserve interest rates?

AThe data fueled bets on interest-rate cuts, with the CME Group's FedWatch Tool indicating a 26.6% probability of a rate cut at the Fed's January 28 meeting.

QAccording to the article, what pattern is Bitcoin's price action repeating?

ABitcoin's price action is repeating its early 2025 fractal, which some traders believe could imply another macro price bottom is still to come.

QWhat was the total value of crypto liquidations in the 24 hours surrounding the CPI news?

ATotal crypto liquidations for the 24 hours to the time of writing were over $630 million.

QWhy was the October CPI report not issued, as noted in the article?

AThe October CPI report was not issued due to the US government shutdown.

Lecturas Relacionadas

SemiAnalysis Dissects Huawei's Kirin 9030: Process Technology Halted, So They Folded the Chip

SemiAnalysis has published a detailed teardown report on the HiSilicon Kirin 9030 Pro chipset found in Huawei's Mate 80 Pro. Fabricated using SMIC's most advanced N+3 node without EUV lithography, the analysis reveals significant technical achievements and strategic shifts. The report indicates SMIC's N+3 has achieved transistor density comparable to TSMC's N6 (113.4 vs 107.7 MTr/mm²), primarily through aggressive use of Self-Aligned Quadruple Patterning (SAQP) for its metal layers. This results in a notably small 32.5nm M0 metal pitch. However, SemiAnalysis notes this achievement comes with significantly higher process complexity, cost, and potential yield challenges compared to competitors using more advanced tools. The Kirin 9030 design maximizes this constrained density. While its GPU performance has improved ~70% and matches Qualcomm's 2022 flagship level, the CPU core's IPC lags behind current top-tier designs from Apple and Qualcomm, a gap attributed to the underlying manufacturing technology rather than design capability. Facing long-term restrictions on advanced tools, Huawei is charting a new path. The report highlights the company's "LogicFolding" roadmap, a 3D stacking technique aimed at shortening signal paths to boost performance and efficiency. The goal is to reach 5GHz frequency and a projected density of 295 MTr/mm² by 2031. SemiAnalysis concludes that export controls have not halted China's chip progress but have fundamentally altered its trajectory, making it more expensive and complex. This has spurred innovation in alternative areas like 3D stacking and domestic EDA tool development, with Huawei's supply chain also beginning to integrate Chinese memory from CXMT.

marsbitHace 34 min(s)

SemiAnalysis Dissects Huawei's Kirin 9030: Process Technology Halted, So They Folded the Chip

marsbitHace 34 min(s)

How Will the Price Move Before SpaceX's Next Share Unlock?

TL;DR Investors buying SPCX after SpaceX's IPO are not simply investing in a typical tech stock. It’s a high-valuation asset driven by Musk's narrative, Starlink, and space transport potential, but with a key twist: a very small initial float of ~4% has led to significant post-listing price appreciation. The current price action reflects a timing gap. Before the first lock-up expiration (estimated around August, subject to official confirmation), scarcity and high demand could continue to push prices up. Short-term bulls focus on low float, FOMO, and potential index inclusion. However, bears point to the supply dynamics that will change post-lockup. Existing shareholders still hold over 95% of shares, which will be released in stages starting from the first unlock window. This introduces future selling pressure from low-cost holders. The upcoming Q2 earnings report is a critical catalyst before the unlock. It will test whether the company's fundamentals can justify the current ~$2.1T valuation. Strong results could support the pre-unlock momentum, while weak figures could amplify concerns about future supply. The trading thesis is shifting from immediate scarcity ("can't buy enough") to evaluating future absorption capacity ("who will buy when more supply hits"). The path ahead hinges on the specifics of the unlock schedule, Q2 earnings performance, and whether anticipated passive index buying materializes.

marsbitHace 55 min(s)

How Will the Price Move Before SpaceX's Next Share Unlock?

marsbitHace 55 min(s)

Bitcoin Short-Term Bullish Structure Validated, HYPE Low-Entry Window Opens | Guest Analysis

**Market Analysis Summary (Week of June 2026)** **Overall Market Context:** The market environment is exceptionally complex, with the unexpected US-Iran agreement and the reopening of the Strait of Hormuz triggering a global asset repricing and significant volatility. This heightened noise underscores the importance of a structured analytical framework. **Bitcoin (BTC) Analysis & Strategy:** * **Current Status:** The price has climbed above $65,000, currently in a rebound phase (segment 38-39) following a complex 12-segment correction from the May high of $82,850. * **Key Levels:** * **Primary Resistance:** $69,500–$70,500. A successful breakout above $65,000 targets this zone. * **Primary Support:** $65,000 (immediate), followed by $59,000–$60,000 and $55,000. * **Weekly Outlook & Strategy:** The focus is on the confirmation of the $65,000 level. * **Bullish Scenario (Hold $65K):** A move toward the $69.5K–$70.5K resistance zone is anticipated, which is a potential area for initiating medium-term short positions. * **Bearish Scenario (Break below $65K):** A retest of the $60,000–$62,000 support range is likely. * **Medium-Term Strategy:** Currently neutral. Plan to establish short positions (up to 60% allocation) either in the $69.5K–$70.5K resistance zone upon signs of rejection, or on a confirmed breakdown below $65,000 and further below $59K–$60K. * **Short-Term Strategy:** Utilize 30% capital for scalping opportunities based on support/resistance levels, using 30/60-minute charts. **HYPE Analysis & Strategy:** * **Current Status:** The price has stabilized around $52 after a four-segment decline from the June high of $75.87 and is now in a rebound (segment 50-51). * **Key Levels:** * **Primary Resistance:** $62.50–$64.57. Watch for potential rejection here to form a lower high. * **Primary Support:** $52–$55.50, followed by $47–$49. * **Weekly Outlook & Strategy:** Adopt a "buy on dips, avoid chasing rallies" approach. * **Core View:** Monitor the price action and potential formation of a lower high ("endpoint 51") in the $62.50–$64.57 resistance zone. * **Short-Term Strategy:** Consider light long positions (max 30% allocation) if the price finds support and shows reversal signals in the $52–$54.50 or deeper $47–$49 support zones, confirmed by proprietary quantitative bottom signals. **Trade Review:** Last week's HYPE short-term long trade, executed based on proprietary "Price Difference" and "Momentum" model signals, yielded a profit of approximately 11.88%. The entry was near $54.39 and exit near $60.85. **Risk Management Reminder:** Always set an initial stop-loss upon entry. Move stop-loss to breakeven at +1% profit, then trail it upwards to lock in gains as the trade progresses. *Disclaimer: All analysis, models, and strategies are based on personal technical analysis for educational purposes only, not investment advice. The market carries inherent risk.*

Odaily星球日报Hace 1 hora(s)

Bitcoin Short-Term Bullish Structure Validated, HYPE Low-Entry Window Opens | Guest Analysis

Odaily星球日报Hace 1 hora(s)

Bitcoin Short-Term Bullish Structure Validated, HYPE Accumulation Window Opens | Guest Analysis

**Bitcoin and HYPE Market Analysis: Short-Term Outlook and Trading Strategies** This market analysis examines Bitcoin (BTC) and HYPE amid volatile conditions, providing short-term outlooks and specific trading strategies. **Key Outlooks:** * **Bitcoin (BTC):** Focus is on whether BTC's recent move above $65,000 holds. A successful breakout could lead to a test of the $69,500-$70,500 resistance zone, where medium-term short positions are considered. A failure, breaking below $65,000, may trigger a decline towards the $59,000-$60,000 support area. * **HYPE:** The token completed a four-wave correction and is now rebounding. The key resistance zone is $62.5-$64.57. The trading strategy is "buy on dips," looking for entry opportunities near the $52-$54.5 or deeper $47-$49 support zones, pending confirmation from proprietary models. **BTC Trading Strategy:** * **Medium-term:** Primarily looking to establish short positions (up to 60% allocated capital) if price rallies to the $69,500-$70,500 resistance area and shows signs of reversal. Alternative plans involve initiating shorts on a breakdown below $65,000. * **Short-term:** Allocate up to 30% capital for intraday "spread" trades based on support/resistance levels on 30/60-minute charts. **HYPE Trading Strategy:** * **Short-term:** Adopt a dip-buying approach. Consider light long positions (under 30% capital) when price tests key support levels ($52-$54.5 or $47-$49) and shows stabilization, confirmed by proprietary "Price Spread" and "Momentum Quant" models. **Trade Recap:** The analysis reviews a successful HYPE long trade from the previous week, executed at ~$54.39 and closed at ~$60.85 for an ~11.88% gain, based on signals from the aforementioned models. **Risk Management Emphasis:** The article stresses strict capital allocation (under 30-60%), immediate initial stop-loss placement, and a trailing stop-loss protocol to lock in profits as trades move favorably. ***Disclaimer:** All analysis, models, and strategies are for educational purposes based on technical analysis, not investment advice. Markets are volatile; trade with caution.*

marsbitHace 1 hora(s)

Bitcoin Short-Term Bullish Structure Validated, HYPE Accumulation Window Opens | Guest Analysis

marsbitHace 1 hora(s)

Trading

Spot
Futuros

Artículos destacados

Cómo comprar US

¡Bienvenido a HTX.com! Hemos hecho que comprar Talus Network (US) sea simple y conveniente. Sigue nuestra guía paso a paso para iniciar tu viaje de criptos.Paso 1: crea tu cuenta HTXUtiliza tu correo electrónico o número de teléfono para registrarte y obtener una cuenta gratuita en HTX. Experimenta un proceso de registro sin complicaciones y desbloquea todas las funciones.Obtener mi cuentaPaso 2: ve a Comprar cripto y elige tu método de pagoTarjeta de crédito/débito: usa tu Visa o Mastercard para comprar Talus Network (US) al instante.Saldo: utiliza fondos del saldo de tu cuenta HTX para tradear sin problemas.Terceros: hemos agregado métodos de pago populares como Google Pay y Apple Pay para mejorar la comodidad.P2P: tradear directamente con otros usuarios en HTX.Over-the-Counter (OTC): ofrecemos servicios personalizados y tipos de cambio competitivos para los traders.Paso 3: guarda tu Talus Network (US)Después de comprar tu Talus Network (US), guárdalo en tu cuenta HTX. Alternativamente, puedes enviarlo a otro lugar mediante transferencia blockchain o utilizarlo para tradear otras criptomonedas.Paso 4: tradear Talus Network (US)Tradear fácilmente con Talus Network (US) en HTX's mercado spot. Simplemente accede a tu cuenta, selecciona tu par de trading, ejecuta tus trades y monitorea en tiempo real. Ofrecemos una experiencia fácil de usar tanto para principiantes como para traders experimentados.

560 Vistas totalesPublicado en 2025.12.11Actualizado en 2026.06.02

Cómo comprar US

Discusiones

Bienvenido a la comunidad de HTX. Aquí puedes mantenerte informado sobre los últimos desarrollos de la plataforma y acceder a análisis profesionales del mercado. A continuación se presentan las opiniones de los usuarios sobre el precio de US (US).

活动图片