Bitcoin Capital Continues to Exit: Why A Negative 7dMA Signals A High-Risk Regime

bitcoinistPublicado a 2025-12-27Actualizado a 2025-12-27

Resumen

Bitcoin is struggling to regain market confidence as sentiment deteriorates and apathy dominates trading. Price remains below $90,000, with repeated recovery attempts failing. On-chain data reveals a negative seven-day moving average of net capital flow at approximately -$160 million, indicating more capital is exiting the network through loss-making sales than entering via profits. Despite weak conditions, Bitcoin supply activity remains elevated, with 31.79% of supply moving in the last 180 days. This high activity reflects distribution and stress rather than accumulation, as holders exit positions at unfavorable prices. For the trend to turn positive, net capital flows must recover alongside sustained activity.

Bitcoin is struggling to regain market confidence as sentiment continues to deteriorate and apathy dominates trading behavior. Price remains capped below the $90,000 level, with repeated recovery attempts failing to gain traction. As volatility compresses and participation thins, an increasing number of analysts are warning that the market may face further downside before stability can return. For now, conviction on both sides remains limited, leaving Bitcoin vulnerable to renewed selling pressure.

On-chain data underscores this fragile backdrop. A recent report by Axel Adler examines daily capital inflows and outflows across the Bitcoin network, using a seven-day moving average of net capital flow to assess market health.

This metric captures the balance between realized profits, which represent capital entering the network, and realized losses, which reflect capital being destroyed through loss-making sales. When the net flow turns negative, it signals that participants are selling at a loss more aggressively than they are taking profits.

Currently, the seven-day average stands at approximately negative $160 million, meaning the market has been losing an average of $160 million in capital per day over the past week. The period between December 17 and 24 was marked by sharp volatility, with large outflows interspersed with brief positive days. Although December 25 saw another net inflow, it was not enough to offset prior losses.

Elevated Coin Activity Signals Distribution Under the Surface

On-chain data highlighted by Adler shows that Bitcoin remains unusually active despite weak market conditions. The Bitcoin “% Supply Active (Last 180 Days)” metric tracks the share of total BTC supply that has moved at least once over the past six months.

Currently, that figure stands at 31.79%, slightly above its 30-day average of 31.43% and firmly in the 80th percentile compared with historical data. Activity has also risen sharply on a year-over-year basis, up 14.4%, indicating that coins are changing hands far more frequently than they were a year ago.
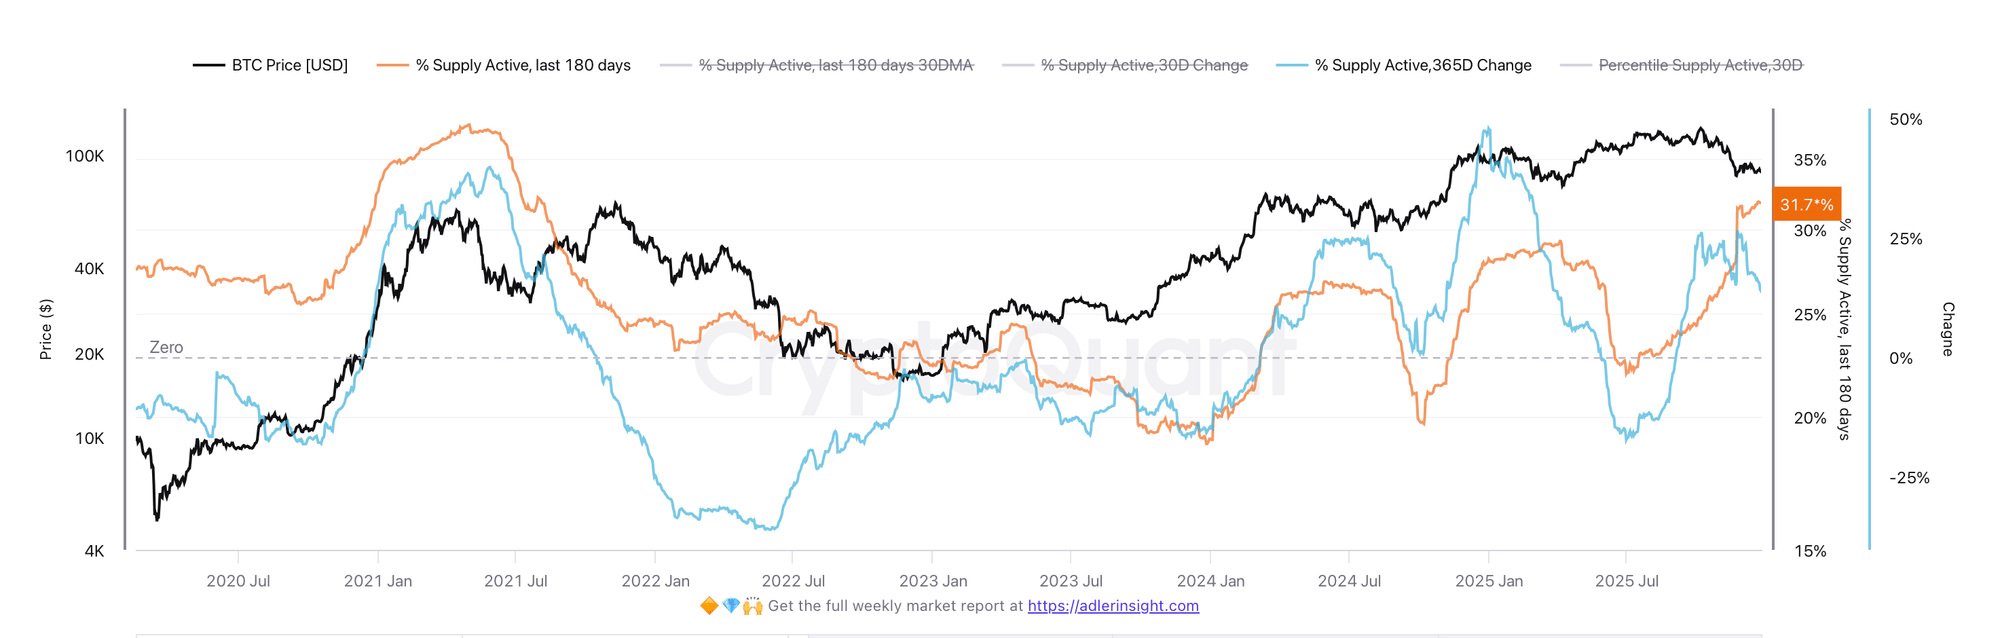
Bitcoin % Supply Active | Source: CryptoQuant

At face value, elevated activity can sometimes signal renewed interest or accumulation. In the current context, however, it carries a more cautionary implication. High supply activity is occurring alongside a negative net capital flow regime, meaning that much of this movement reflects loss-making sales rather than profitable distribution. Coins are not simply rotating between long-term holders; they are being sold under pressure.

This combination challenges the idea that the market is simply apathetic. Instead, it points to active distribution, with holders choosing to exit positions despite unfavorable prices. The distinction is important: apathy implies indecision, while distribution suggests stress.

For this metric to turn constructive, elevated activity would need to persist while net capital flows recover toward zero or positive territory. Only then would increased coin movement begin to reflect accumulation rather than capitulation.


Criptos en tendencia

Preguntas relacionadas

QWhat does a negative 7-day moving average of net capital flow indicate for the Bitcoin market?

AA negative 7-day moving average of net capital flow indicates that participants are selling Bitcoin at a loss more aggressively than they are taking profits, signaling capital destruction and a high-risk regime where the market is losing value.

QWhat is the current value of Bitcoin's 7-day average net capital flow, and what does it represent?

AThe current 7-day average net capital flow is approximately negative $160 million, meaning the Bitcoin market has been losing an average of $160 million in capital per day over the past week.

QHow does the '% Supply Active (Last 180 Days)' metric behave in the current market, and what does it suggest?

AThe '% Supply Active (Last 180 Days)' metric stands at 31.79%, above its 30-day average and in the 80th percentile historically, with a 14.4% year-over-year increase. This elevated activity, combined with negative capital flows, suggests active distribution and loss-making sales rather than accumulation.

QWhat is the difference between market apathy and distribution according to the on-chain analysis?

AMarket apathy implies indecision and lack of trading conviction, while distribution indicates active selling under pressure, with holders exiting positions despite unfavorable prices, reflecting stress and capitulation in the market.

QWhat conditions would need to occur for increased coin movement to signal accumulation rather than capitulation?

AFor increased coin movement to signal accumulation rather than capitulation, elevated supply activity would need to persist alongside a recovery in net capital flows toward zero or positive territory, indicating that coins are being bought for profit rather than sold at a loss.

Lecturas Relacionadas

As Consensus Accelerates, What Are Young Investors Betting On?

Title: As Consensus Forms Faster, What Are Young Investors Betting On? In the rapid evolution of tech investment, a new generation of young investors is navigating a landscape where AI, robotics, commercial aerospace, and quantum computing are advancing simultaneously. Traditional investment logic based on financial models is giving way to a need for deep technical understanding and the ability to act before industry consensus forms. An analysis of trends from the "WAIC FUTURE TECH" list of young investment leaders reveals key shifts in focus. The first major trend is the movement of AI from the digital screen into the physical world. Investment is shifting from large language models and chatbots towards embodied AI, robotics, AI hardware, and edge computing. While demonstrations generate excitement, the real challenge lies in achieving scalable, reliable, and cost-effective delivery in complex real-world environments like factories and logistics. Success depends not just on algorithms but on the integration of sensors, actuators, and control systems. Second, the competitive focus for large models is moving beyond raw capability toward building an "intelligence flywheel." The goal is to create self-reinforcing systems where user interaction generates data, improving the model, which in turn enhances the user experience and attracts more engagement. Companies that successfully embed AI into workflows to create these closed-loop systems can build lasting value that isn't easily erased by the next model upgrade. Third, facing a potential bottleneck in high-quality human-generated data, investors are looking at new underlying technologies. Reinforcement learning and self-play, as demonstrated by AlphaGo Zero, offer paths for AI to generate its own experience. Scientific foundation models, which aim to build general AI capabilities for fields like life sciences and materials discovery, represent a non-consensus direction that could unlock new frontiers of knowledge and data. Finally, in deep-tech areas like quantum computing, commercial aerospace, and space-based infrastructure, patient capital is essential. These fields have long, uncertain development and validation cycles involving complex engineering, supply chains, and regulations. Investment here requires a long-term view, focusing on foundational team capabilities and the eventual emergence of market demand, even if commercial returns are distant. Collectively, these trends illustrate how young investors are adapting to a new era. They are learning to make earlier, technically-informed judgments, balance hype with real-world viability, and provide the patient capital needed to build the deep-tech foundations of the future.

marsbitHace 9 min(s)

As Consensus Accelerates, What Are Young Investors Betting On?

marsbitHace 9 min(s)

Can Japan Buy Growth with AI? Will the Bond Market Believe It?

Japan's cabinet has introduced the 2026 Basic Policy on Economic and Fiscal Management and Reform, shifting its primary fiscal target. The new framework moves away from the traditional annual primary balance goal and instead prioritizes a stable reduction of the debt-to-GDP ratio. This change is tied to a strategy of increased "responsible proactive fiscal" spending, aiming to boost long-term growth through investments in strategic sectors like AI, semiconductors, energy, and robotics. The government estimates total public and private investment in 62 key technologies could exceed 370 trillion yen by 2040. The market reaction has been mixed and cautious. While equity markets may respond to policy signals, bond markets are focused on fiscal credibility. Concerns center on whether the weakening of the clear primary balance anchor could lead to looser fiscal discipline. If investors doubt that these strategic investments will generate sufficient productivity gains, tax revenue, and nominal growth to outpace rising interest costs, they may demand higher yields on Japanese Government Bonds (JGBs). Recent volatility in the yen and JGB yields, with the 10-year yield briefly reaching 2.9%, reflects this skepticism. The success of this new framework hinges on two factors: whether Japan can achieve a nominal growth rate consistently higher than its long-term interest rates, and whether future budgets demonstrate disciplined control over bond issuance. The government's narrative is that strategic investment is essential to break Japan's cycle of low growth, aging, and labor shortages. However, the bond market will continuously assess the credibility of this plan, pricing the risk that it may represent fiscal expansion rather than a viable growth strategy.

marsbitHace 46 min(s)

Can Japan Buy Growth with AI? Will the Bond Market Believe It?

marsbitHace 46 min(s)

Misjudged A-Shares: Resilience, Expectations, and Confidence

China's A-share market recently faced selling pressure, especially in tech sectors, initially triggered by a global tech sell-off that began in South Korea. However, the article argues this is a case of "mistaken injury" and highlights the market's underlying resilience. This resilience stems from three main pillars: **1) Tech Sector Fundamentals:** Unlike Korea's market dominated by a few memory chip stocks, China's tech sector is diversified across computing, communications, electronics, and semiconductors, supported by dual narratives of global AI supply chains and domestic substitution. Core areas like optical modules and fiber optics continue to show strong earnings growth. **2) "National Team" Support:** State-backed institutions and large corporations have made significant market purchases and announced buybacks, providing liquidity and signaling confidence. This is seen as a stabilizing policy signal, often associated with market bottoms. **3) Broader Market Pillars:** Other major sectors are showing endogenous recovery momentum. Consumer stocks benefit from stabilizing CPI and signs of sector recovery (e.g., liquor price hikes). Cyclical sectors like aluminum have high earnings, potential price increases due to tight supply, and low valuations. The financial sector offers stable dividends and low valuations. The conclusion is that the sell-off was driven by external contagion, not a collapse in fundamentals. With strong policy support and recovering momentum across key sectors, the A-share market possesses the toughness to regain stability.

marsbitHace 1 hora(s)

Misjudged A-Shares: Resilience, Expectations, and Confidence

marsbitHace 1 hora(s)

Trading

Spot

Artículos destacados

Cómo comprar O

¡Bienvenido a HTX.com! Hemos hecho que comprar O1 exchange (O) sea simple y conveniente. Sigue nuestra guía paso a paso para iniciar tu viaje de criptos.Paso 1: crea tu cuenta HTXUtiliza tu correo electrónico o número de teléfono para registrarte y obtener una cuenta gratuita en HTX. Experimenta un proceso de registro sin complicaciones y desbloquea todas las funciones.Obtener mi cuentaPaso 2: ve a Comprar cripto y elige tu método de pagoTarjeta de crédito/débito: usa tu Visa o Mastercard para comprar O1 exchange (O) al instante.Saldo: utiliza fondos del saldo de tu cuenta HTX para tradear sin problemas.Terceros: hemos agregado métodos de pago populares como Google Pay y Apple Pay para mejorar la comodidad.P2P: tradear directamente con otros usuarios en HTX.Over-the-Counter (OTC): ofrecemos servicios personalizados y tipos de cambio competitivos para los traders.Paso 3: guarda tu O1 exchange (O)Después de comprar tu O1 exchange (O), guárdalo en tu cuenta HTX. Alternativamente, puedes enviarlo a otro lugar mediante transferencia blockchain o utilizarlo para tradear otras criptomonedas.Paso 4: tradear O1 exchange (O)Tradear fácilmente con O1 exchange (O) en HTX's mercado spot. Simplemente accede a tu cuenta, selecciona tu par de trading, ejecuta tus trades y monitorea en tiempo real. Ofrecemos una experiencia fácil de usar tanto para principiantes como para traders experimentados.

128 Vistas totalesPublicado en 2026.06.19Actualizado en 2026.06.29

Cómo comprar O

Cómo comprar PROS

¡Bienvenido a HTX.com! Hemos hecho que comprar Pharos (PROS) sea simple y conveniente. Sigue nuestra guía paso a paso para iniciar tu viaje de criptos.Paso 1: crea tu cuenta HTXUtiliza tu correo electrónico o número de teléfono para registrarte y obtener una cuenta gratuita en HTX. Experimenta un proceso de registro sin complicaciones y desbloquea todas las funciones.Obtener mi cuentaPaso 2: ve a Comprar cripto y elige tu método de pagoTarjeta de crédito/débito: usa tu Visa o Mastercard para comprar Pharos (PROS) al instante.Saldo: utiliza fondos del saldo de tu cuenta HTX para tradear sin problemas.Terceros: hemos agregado métodos de pago populares como Google Pay y Apple Pay para mejorar la comodidad.P2P: tradear directamente con otros usuarios en HTX.Over-the-Counter (OTC): ofrecemos servicios personalizados y tipos de cambio competitivos para los traders.Paso 3: guarda tu Pharos (PROS)Después de comprar tu Pharos (PROS), guárdalo en tu cuenta HTX. Alternativamente, puedes enviarlo a otro lugar mediante transferencia blockchain o utilizarlo para tradear otras criptomonedas.Paso 4: tradear Pharos (PROS)Tradear fácilmente con Pharos (PROS) en HTX's mercado spot. Simplemente accede a tu cuenta, selecciona tu par de trading, ejecuta tus trades y monitorea en tiempo real. Ofrecemos una experiencia fácil de usar tanto para principiantes como para traders experimentados.

146 Vistas totalesPublicado en 2026.06.22Actualizado en 2026.06.29

Cómo comprar PROS

Qué es VERONA

I. Introducción al Proyecto VERONA es una blockchain construida para todos, en todas partes a través de la abstracción de cadenas. Utilizando su capa de Abstracción Generalizada, VERONA se distingue por integrar funcionalidades complejas de blockchain, como cuentas, firmas e interoperabilidad, directamente a nivel de protocolo. Este enfoque permite interactuar con aplicaciones de blockchain sin necesidad de entender las tecnologías subyacentes.1) Información Básica Nombre: VERONA (VERONA)III. Enlaces Relacionados Enlace al sitio web oficial: https://xion.burnt.com/ Libro Blanco: https://xion.burnt.com/whitepaper.pdf Exploradores: https://explorer.burnt.com/ Redes Sociales: https://x.com/burnt_xion Nota: La introducción del proyecto proviene de los materiales publicados o proporcionados por el equipo oficial del proyecto, que es solo para referencia y no constituye asesoramiento de inversión. HTX no se hace responsable de ninguna pérdida directa o indirecta resultante.

171 Vistas totalesPublicado en 2026.06.22Actualizado en 2026.06.22

Qué es VERONA

Discusiones

Bienvenido a la comunidad de HTX. Aquí puedes mantenerte informado sobre los últimos desarrollos de la plataforma y acceder a análisis profesionales del mercado. A continuación se presentan las opiniones de los usuarios sobre el precio de A (A).

活动图片













