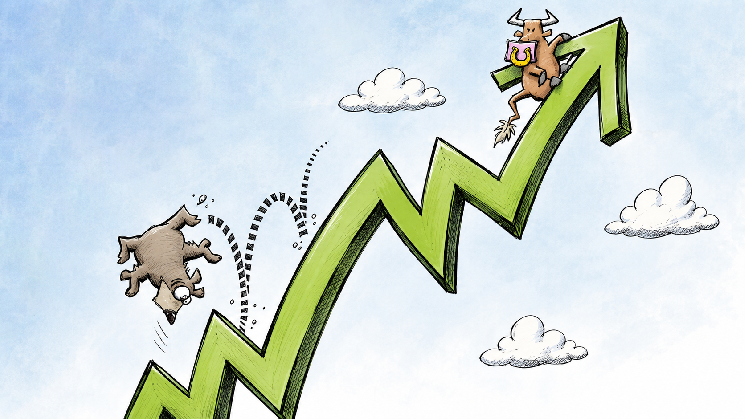
Bitcoin (BTC) Price Under Pressure: Is a Bearish Flag Flashing a Warning of a Slide to $70K?

TheNewsCryptoPublicado a 2025-12-09Actualizado a 2025-12-09

Within the bear hold, the largest asset in the crypto market, Bitcoin (BTC), is stuck in the downside waves, lighting up the red candlesticks. Multiple rejections have been faced back-to-back, and are currently trading below the $95K. As of today, with the fear sentiment, BTC has posted a modest loss of over 1.12%.

The price movement in the early hours caused the asset to hit a high of $92,220.86. Later, the bearish fluctuations triggered BTC to fall to its bottom range of $89,586.98. As per the CMC data, at the time of writing, Bitcoin traded at around the $90,511.42 zone.

Besides, the market cap of the asset is resting at $1.8 trillion, and its daily trading volume has dropped and reached the $55.88 billion. As reported by the Coinglass data, the market has witnessed a liquidation of $54.95 million worth of Bitcoin in the last 24 hours.

The Ali chart has exhibited that the current structure on Bitcoin’s chart is forming a bearish flag. The price consolidates upward within a tight channel after a sharp drop, but fails to break higher. If BTC breaks below the lower trendline, the pattern projects a downside target. In this case, around $70K, based on the height of the preceding drop.

Is Bitcoin Preparing for an Extended Bear Grip?

Both the Moving Average Convergence Divergence (MACD) line and the signal line are positioned below the zero line, which indicates Bitcoin’s broader bearish phase. The downside pressure will continue to dominate unless the lines rise back above the zero line.

In addition, the Chaikin Money Flow (CMF) indicator value found at 0.15 suggests moderate buying pressure in the BTC market. The money is flowing into the asset, not strongly, but it hints at a positive shift in demand and may support further upside.

The 4-hour trading session of Bitcoin shows bearish sentiment, with the price might slip to the key support at $90,472. Further correction on the downside could easily push for the death cross emergence, and the bears would send the price below the $90.3K mark.

Conversely, if the bulls appeared, the price could move up toward the $90,612 resistance range. A golden cross might take place with the strengthened upside pressure. Gradually, the bulls likely drive the BTC price to its recent high, above the $90.7K zone.

Bitcoin’s daily Relative Strength Index (RSI) is at 50.54, in the neutral zone — neither overbought nor oversold. With the balanced momentum, the price could swing in either direction. Moreover, BTC’s Bull Bear Power (BBP) of -31.33 signals that bears currently have control. The selling pressure is strong, pushing the price below, and the trend will lean more bearish unless momentum shifts.

Top Updated Crypto News

Zcash (ZEC) Rockets Up 14%: Is Crucial Resistance Lurking Ahead?

TagsBitcoinBTCBTC priceCryptocurrency

Criptos en tendencia

Lecturas Relacionadas

RWA Tokenization Enters the Next Phase: What is the Truly Time-Consuming Advantage to Build?

The article argues that as tokenization frameworks for Real-World Assets (RWA) mature, the ability to issue assets is becoming less of a competitive advantage. The focus is shifting to what happens *after* issuance: which RWA operations can build enduring trust, maintain stable operations, and remain integrated into the financial ecosystem over the long term. The piece introduces the concept of a **Reserve Layer**—infrastructure that connects tokenized assets to the necessary verification, liquidity, and operational systems for on-chain finance. For an asset to serve as a reliable reserve (e.g., short-term U.S. Treasuries, gold), it needs predictable value, standardized features, deep markets, and observable pricing. However, the true, hard-to-replicate advantage lies not just in the underlying asset but in the **operational track record** built over time. This includes consistent reserve management, independent audits, successful redemptions, maintained liquidity, and protocol integrations. Each successful operation adds evidence, creating a reinforcing cycle: more evidence builds stronger institutional confidence, leading to wider distribution, deeper liquidity, and more use cases as collateral. The article presents a framework combining two dimensions: an asset's suitability as a reserve and the issuer's operational capability. The most sustainable model combines **high-quality reserve assets with strong, long-term operational discipline**. A critical blind spot is an asset with high reserve suitability (like gold) issued by an entity with a limited operational track record; the quality of the infrastructure is separate from the quality of the asset itself. In conclusion, the next phase of RWA will be defined by participants who can pair appropriate reserve assets with the operational rigor to support them through market cycles, thereby transforming tokenized RWAs into durable financial infrastructure.

marsbitHace 34 min(s)

RWA Tokenization Enters the Next Phase: What is the Truly Time-Consuming Advantage to Build?

marsbitHace 34 min(s)

Trading

Spot

Artículos destacados

Qué es KR200

KOSPI 200 es el índice de referencia de acciones de primera clase de Corea del Sur, que rastrea las 200 principales acciones de gran capitalización y alta liquidez que cotizan en la Bolsa de Corea (KRX). Cubre a líderes del sector como Samsung y SK Hynix, y sirve como el principal subyacente para los derivados de acciones coreanas y la evaluación institucional global.

46 Vistas totalesPublicado en 2026.08.19Actualizado en 2026.08.19

Qué es KR200

Cómo comprar KR200

¡Bienvenido a HTX.com! Hemos hecho que comprar KOSPI 200 (KR200) sea simple y conveniente. Sigue nuestra guía paso a paso para iniciar tu viaje de criptos.Paso 1: crea tu cuenta HTXUtiliza tu correo electrónico o número de teléfono para registrarte y obtener una cuenta gratuita en HTX. Experimenta un proceso de registro sin complicaciones y desbloquea todas las funciones.Obtener mi cuentaPaso 2: ve a Comprar cripto y elige tu método de pagoTarjeta de crédito/débito: usa tu Visa o Mastercard para comprar KOSPI 200 (KR200) al instante.Saldo: utiliza fondos del saldo de tu cuenta HTX para tradear sin problemas.Terceros: hemos agregado métodos de pago populares como Google Pay y Apple Pay para mejorar la comodidad.P2P: tradear directamente con otros usuarios en HTX.Over-the-Counter (OTC): ofrecemos servicios personalizados y tipos de cambio competitivos para los traders.Paso 3: guarda tu KOSPI 200 (KR200)Después de comprar tu KOSPI 200 (KR200), guárdalo en tu cuenta HTX. Alternativamente, puedes enviarlo a otro lugar mediante transferencia blockchain o utilizarlo para tradear otras criptomonedas.Paso 4: tradear KOSPI 200 (KR200)Tradear fácilmente con KOSPI 200 (KR200) en HTX's mercado spot. Simplemente accede a tu cuenta, selecciona tu par de trading, ejecuta tus trades y monitorea en tiempo real. Ofrecemos una experiencia fácil de usar tanto para principiantes como para traders experimentados.

36 Vistas totalesPublicado en 2026.08.19Actualizado en 2026.08.19

Cómo comprar KR200

Qué es SKDD

Diseñado para proporcionar rendimientos apalancados inversos de -2x de los movimientos diarios del precio de las acciones de SK Hynix, este es un ETF apalancado corto de un solo día bajo GraniteShares. Es adecuado para inversores con una perspectiva bajista a corto plazo sobre SK Hynix para asignación táctica.

89 Vistas totalesPublicado en 2026.08.19Actualizado en 2026.08.19

Qué es SKDD

Discusiones

Bienvenido a la comunidad de HTX. Aquí puedes mantenerte informado sobre los últimos desarrollos de la plataforma y acceder a análisis profesionales del mercado. A continuación se presentan las opiniones de los usuarios sobre el precio de A (A).

活动图片