The crypto market experienced another thrilling week. Catalyzed by macro tailwinds, Bitcoin surged a staggering 26.72% weekly, hitting a high of $79,515 and forcefully approaching the psychological $80,000 level. Meanwhile, HYPE made an even more remarkable move, soaring to a new all-time high of $83.38, driven by significant positive news. Market sentiment has undergone a dramatic reversal—the previously pervasive pessimism quickly dissipated, with a growing number of investors shifting from watchful waiting to active bullish positioning.
Recalling our analysis last week, we explicitly stated the core view that 'the daily chart continuation of the rising Wave C has a high probability.' The market's movement has now aligned perfectly with this forecast, with Bitcoin executing the anticipated strong rally as expected. Regarding HYPE, we similarly identified the signal for a 'potential daily-level rebound from the August 2nd low' in the lower price region in advance and have been tracking it since. The live performance once again validates the effectiveness of our analytical logic. In fact, tracing back to our initial coverage of HYPE on February 23rd, we have maintained weekly updates for 27 consecutive issues. During this period, the maximum gain reached 225.7%. This is not a mere coincidence of judgment but powerful proof of the long-term effectiveness of our systematic analytical framework.
At the current juncture, while market sentiment has clearly warmed up, powerful rallies are often followed by increased volatility and struggles at key resistance levels. This week, we will continue to systematically outline the potential evolution paths for BTC and HYPE based on multi-cycle wave structures, quantitative model signals, and key support/resistance levels. We will provide specific short-to-medium-term trading plans to help you navigate the fluctuating market and capture trading opportunities with higher certainty.
Summary of This Week's Core Trading Views:
• BTC Multi-Cycle Trend Structure Analysis (Detailed in Part 1)
• BTC Weekly Market Outlook and Medium/Short-Term Trading Strategies (Detailed in Part 2)
• HYPE Daily Chart Trend Structure Analysis (Detailed in Part 3)
• HYPE Weekly Market Outlook and Short-Term Trading Strategy (Detailed in Part 4)
Market Verification of Last Week's Trading Strategies and Core Views:
• BTC Market Analysis Verification – Last week's article emphasized: The probability of the daily chart continuing the rising Wave C is high. Current market action is in line with our forecast.
• HYPE Market Analysis Verification – Last week's article review: The probability of a daily-level rebound forming from the August 2nd low was significant. The current live price action is highly consistent with our analytical view.
Part 1: Bitcoin Multi-Cycle Trend Structure Analysis
Bitcoin experienced a significant surge last week on high volume, catalyzed by macro tailwinds. The weekly maximum gain reached 26.72%, with a peak at $79,515, bringing it close to the psychological $80,000 milestone. As the price rallied strongly, market sentiment shifted notably, with many investors' medium-term outlook changing from excessive pessimism to active bullishness. The following analysis will systematically review the current situation from two dimensions—weekly chart structure and daily wave decomposition—combined with key resistance levels, to clarify the market's current stage and its potential evolution path, providing reference for investment decisions.
1. Bitcoin Weekly Chart Trend Structure Analysis: (Based on price action since October 6, 2025)
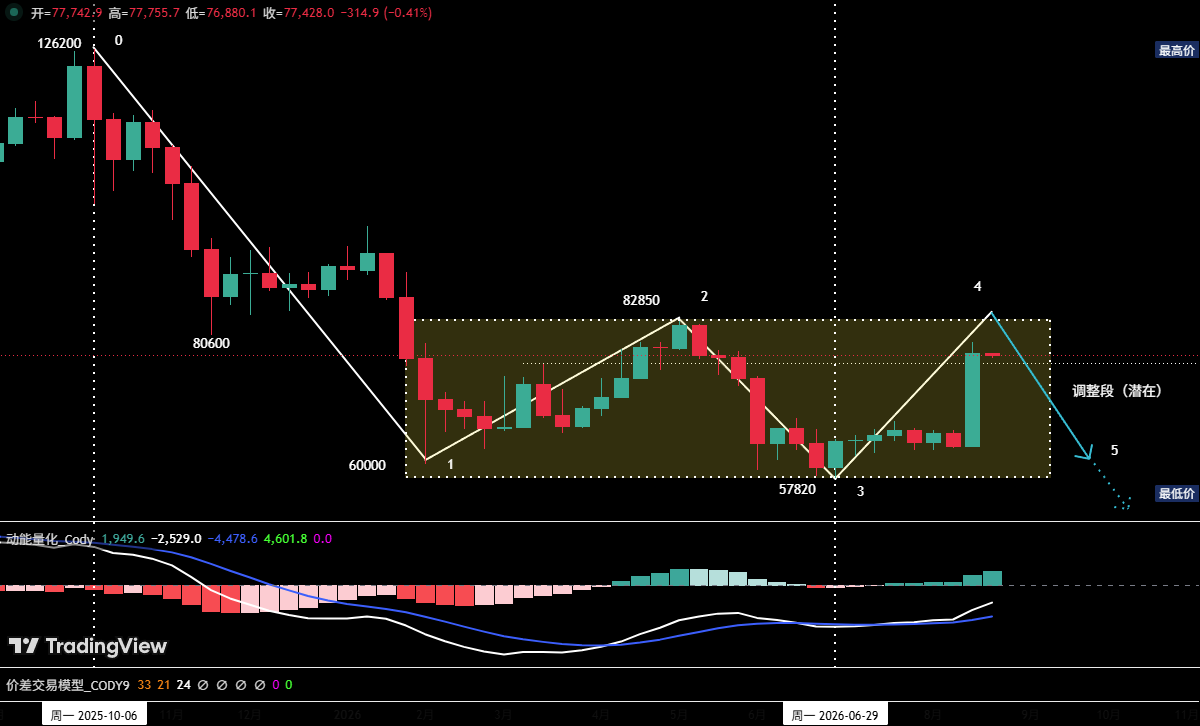
Chart 1: Bitcoin Weekly Candlestick Chart
1. The weekly structure shows that the medium-term correction initiated from the October 6, 2025 high of $126,200 has, up to the present, presented a four-segment adjustment structure comprising (0-1), (1-2), (2-3), and (3-4). Currently, the (3-4) rebound segment is underway.
2. Since breaking below $82,850 on January 31, the price has broadly been trapped in a wide-range consolidation box between $57,820 and $82,850. The weekly chart indicates the current rebound is once again approaching the box's upper boundary around $82,850, which constitutes the short-term dividing line between bullish and bearish forces.
3. Whether this (3-4) rebound segment can effectively break above the box's upper rail will be the core variable determining the medium-term trend. Based on technical pattern projections, subsequent price action could follow one of three potential paths:
Path One: Break Above the Upper Rail, Opening Upside Space
The rebound segment (3-4) continues upward, with the price effectively stabilizing above the strong resistance zone of $80,600–$82,850, breaking above the box's upper rail and initiating a new round of upward movement, targeting the $90,000 integer level.
Path Two: Rejected at Upper Rail, Maintaining Box Consolidation
The rebound shows signs of stalling near the box's upper rail, with technical indicators signaling a top. The rebound segment (3-4) terminates near the upper rail. The price retraces to seek support near the box's midpoint or lower boundary, i.e., potentially initiating a downward adjustment segment (4-5). After segment (4-5) concludes within or near the lower boundary of the box, the price will once again attempt to challenge the upper rail.
Path Three: Resistance at Upper Rail, Break Below Box Continues Downtrend
The rebound segment (3-4) terminates near the box's upper rail, followed by consecutive declines that effectively break below the $57,820 support at the lower boundary. This would initiate a potential downward adjustment segment (4-5), which, upon piercing the box's lower support, continues downward to seek lower support levels, thereby continuing the overall downtrend.
4. Based on our proprietary quantitative model analysis, following the recent strong short-term rally, overbought conditions are significant. Coupled with the suppression from the $80,600–$82,850 strong resistance zone, the probability of the current (3-4) rebound segment terminating near the box's upper rail is extremely high. Considering the three evolution paths above, the likelihood of subsequent price action following Path Two is currently the highest.
2. Bitcoin Daily Chart Trend Structure Analysis:
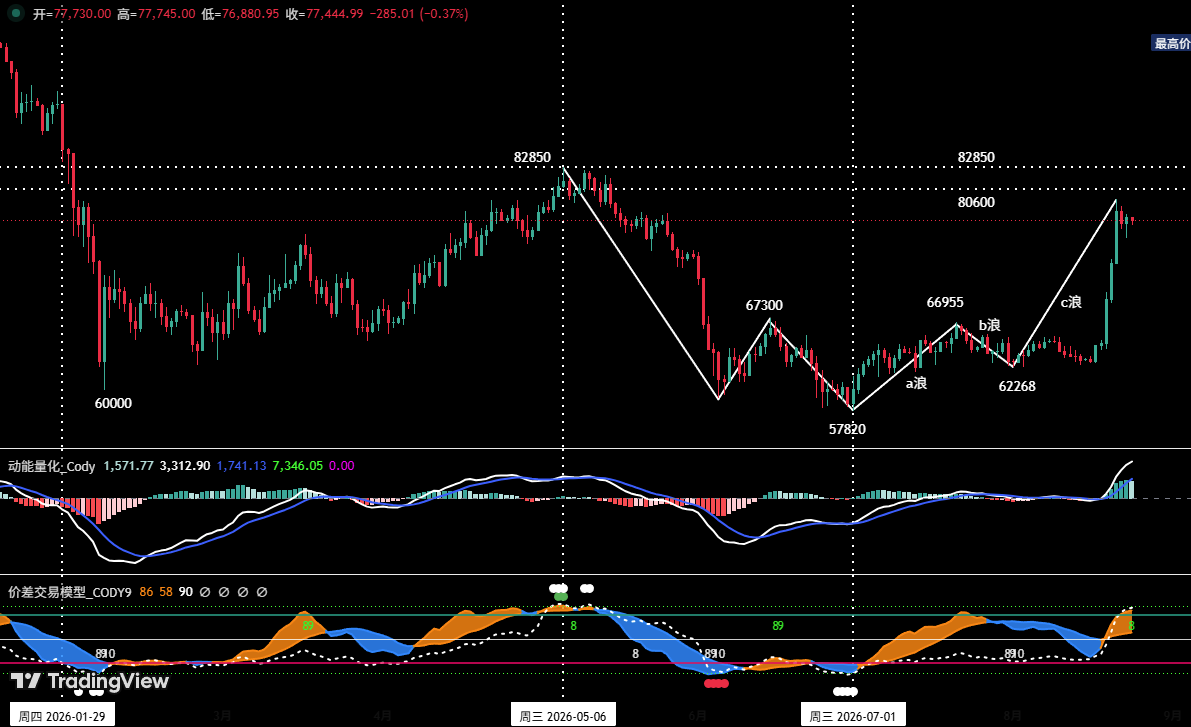
Chart 2: Bitcoin Daily Candlestick Chart
Daily Wave Structure Analysis: The rebound initiated from the July 1 low of $57,820 corresponds to the weekly-level (3-4) rebound segment. Below, we will conduct a detailed decomposition of this segment within the daily chart framework. By delineating the wave structure, we aim to clarify the current stage of the rebound, providing technical support for short-term trend analysis.
1. Wave a (Rebound Wave): July 1 to July 21
▪ Start: $57,820, End: $66,955
▪ Duration: 21 trading days
▪ Maximum intra-range gain: 15.8%.
2. Wave b (Correction Wave): July 21 to August 1
▪ Correction range: $66,955 → $62,268
▪ Correction period: 11 trading days
▪ Technical feature: The retracement precisely tested the 50% Fibonacci level of Wave a's advance.
3. Wave c (Rebound Wave): August 1 to present
▪ Starting point: $62,268
▪ Currently running for 22 trading days (ongoing).
▪ Current intra-range maximum gain: 27.8%, approaching 1.9 times the advance of Wave a.
4. Weekly (3-4) Rebound Segment Corresponds to a High Probability Daily 5-Wave Rebound
From a technical pattern and volume perspective: As of now, Wave c's rebound high has reached approximately $79,571 (achieving the 1.9x extension target relative to Wave a), with consecutive days of amplified trading volume. This significant change increases the probability of Wave c transforming into a primary impulse wave. If Wave c concludes, after a subsequent Wave d correction, the likelihood of a Wave e advance breaking above Wave c's high is substantial.
Part 2: Bitcoin Weekly Market Outlook and Trading Strategy
1. BTC Weekly Market Movement Forecast:
This week's core view: Closely monitor the potential termination point of the daily Wave e rebound and effective support levels for a potential Wave d correction.
2. Key Resistance Levels:
• First Resistance Zone: $80,600–$82,850 area (Previous significant level)
• Second Resistance Zone: Around $84,500 (Previous significant resistance area)
• Third Resistance Zone: $90,000 area (Key integer psychological level)
3. Key Support Levels:
• First Support Level: $73,500–$75,000 area (Previous significant support)
• Second Support Level: $67,300–$69,100 area (Previous significant support)
4. This Week's Trading Strategy (Excluding Impact of Sudden News)
1. Medium-Term Strategy:
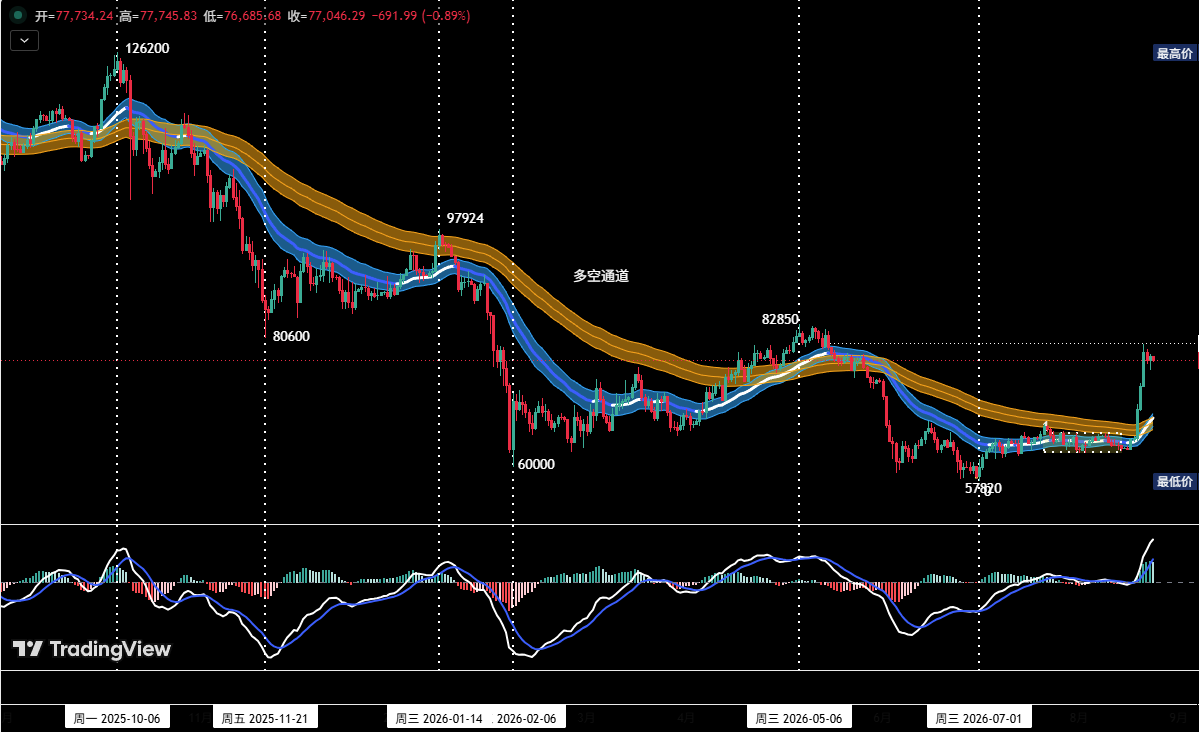
Chart 3: Bitcoin Daily Candlestick Chart (Position Monitoring Model)
Position Monitoring Model: As shown in (Chart 3), the price has effectively broken above the 'Bull-Bear Channel,' indicating a short-term change in market structure. The current medium-term position has been reduced to zero, and we are temporarily maintaining a neutral, watchful stance.
2. Short-Term Strategy: Utilize a 30% position allocation, set stop-loss points, and look for 'spread' trading opportunities based on support and resistance levels. (Use 30-minute/60-minute charts as the operation cycle).
3. For short-term operations, to dynamically adapt to the market's complex evolution, we have prepared the following operational contingency plans in advance.
• Plan A: Light Long Position Test in Strong Support Zone.
• Entry: If the Wave c rebound concludes and a correction begins. When the price retraces to the aforementioned first or second key support levels, showing a clear stabilization pattern and the quantitative model simultaneously issues a bottoming signal, a long position of approximately 30% can be established.
• Risk Control: Set an initial stop-loss.
• Exit: When the price rebounds near important resistance levels combined with model signals, consider gradually liquidating the position to take profits.
Part 3: HYPE Daily Chart Trend Structure Analysis:
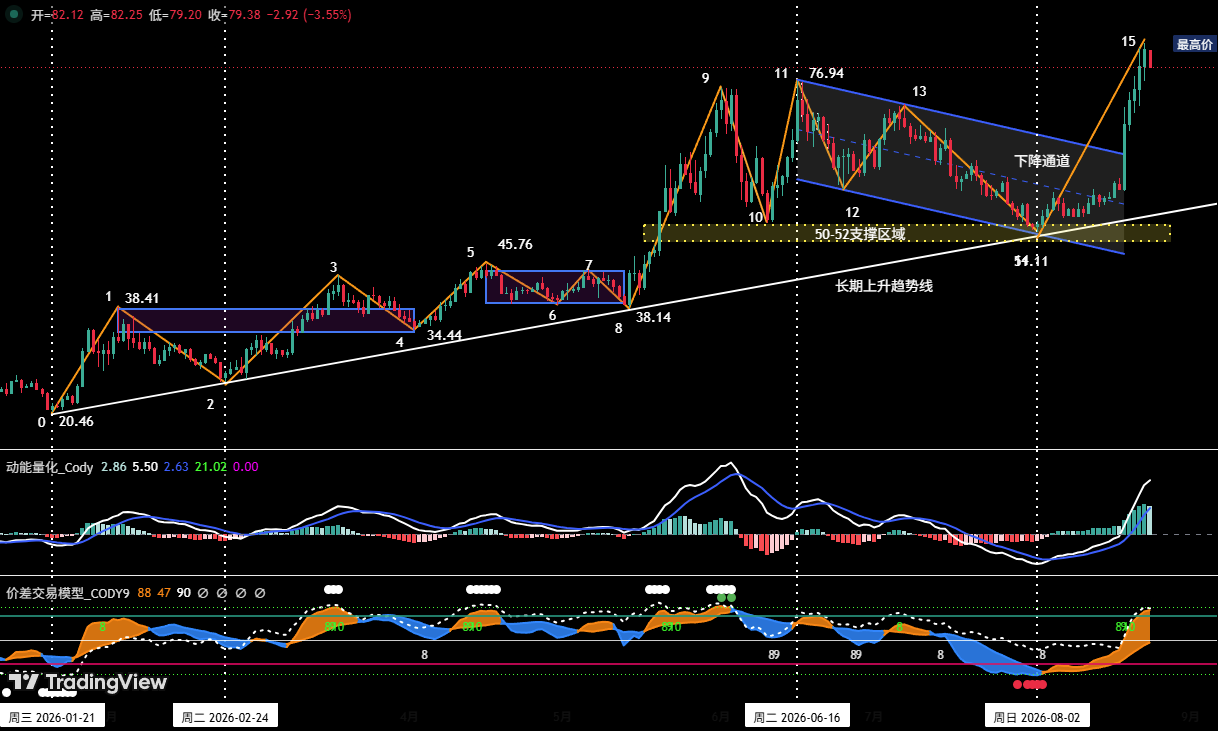
Chart 4: HYPE Daily Candlestick Chart
1. HYPE Recommendation Analysis History
1. Initial Coverage and Core Upside Logic (February 23)
In the weekly review published on February 23, we first proposed the investment value and long opportunities for HYPE. At that time, the virtual currency market was in an environment of extreme pessimism. Based on trend theory analysis, we arrived at the following core judgments:
First: Trend Theory Reversal Confirmation
Since completing its bottom at $20.46 on January 21, 2026, HYPE initiated an independent, oscillating uptrend. At that time, the price had confirmed a breakout above the long-term descending trendline connecting the September 2025 high (approx. $59.48) and the October 2025 high (approx. $50.17), marking a formal reversal of the previous bearish structure.
Second: Elliott Wave Theory Projection
Applying Elliott Wave theory to dissect HYPE's price structure, we indicated:
▪ Medium-Term Wave I (Impulse Wave): January 21 ($20.46) to February 3 ($38.41)
▪ Medium-Term Wave II (Correction Wave): February 3 to February 23, noting the corrective structure was nearing completion.
▪ Medium-Term Wave III (Potential Primary Impulse Wave): Ready to launch at any time.
(For detailed content, please refer to the February 23 weekly review article.)
Looking back, the daily chart shows that Medium-Term Wave III (the primary impulse wave) officially launched from the February 24 low of $25.60. We precisely captured this key initiation point.
2. Continuous Tracking and Performance Verification
Since February 23, we have published 26 consecutive thematic analyses; this week marks the 27th (maintaining a weekly update frequency). Each issue systematically deconstructs the evolution of the price structure from multiple timeframes and provides clear investment decision advice and trading plans for the following week.
▪ Price Milestone: Last week, driven by major positive news, the price reached a new all-time high since its listing, peaking at $83.38.
▪ Performance: Since the initial recommendation, the maximum gain has reached 225.7%, validating the effectiveness of the initial investment thesis.
2. Daily Trend Structure Analysis:
The current upward move initiated from the August 2 low of $51.11 has been underway for 21 trading days. Last week, catalyzed by significant positive news, the price achieved a new all-time high. Currently, from the daily chart perspective, the correction trend from June 16 to August 2 has concluded. Last week's market action featured both rising prices and volume, indicating strong upward momentum: the breach to new highs suggests further upside potential has been unlocked, with the next target pointing towards the $90 integer level.
Part 4: HYPE Weekly Market Outlook and Short-Term Trading Strategy
1. HYPE Weekly Market Movement Forecast:
1. Key Resistance Levels:
• First Resistance Level: Around $90
2. Key Support Levels:
• First Support Level: Around $77
• Second Support Level: Around $73
This Week's Core View:
Focus on observing whether the price successfully retests and confirms the validity of last week's breakout above the previous high resistance at $77.
2. HYPE Short-Term Trading Strategy This Week:
Short-Term Operations This Week:
1. For Holders of Long Positions: Investors who established long positions in the $50–$52 region according to previous trading plans are advised to raise their initial stop-loss levels to protect existing profits. Adhere strictly to stop-loss discipline and hold for further potential gains.
2. For Those Currently Not Positioned: If the price retraces to test the previous high resistance at $77 and confirms the breakout's validity, consider establishing a light long position. It is crucial to set and strictly execute a stop-loss.
Part 5: Special Notes:
1. Upon Entry: Immediately set an initial stop-loss.
2. When Profit Reaches 1%: Move the stop-loss to the entry cost (breakeven point) to ensure capital preservation.
3. When Profit Reaches 2%: Move the stop-loss to the 1% profit level.
4. Continuous Tracking: Thereafter, for every additional 1% profit, move the stop-loss up by 1% accordingly, dynamically protecting and locking in gains.
Financial markets are ever-changing; all market analysis and trading strategies require dynamic adjustment. All views, analytical models, and operational strategies mentioned in this article are derived from personal technical analysis, intended solely for use as a personal trading log. They do not constitute any form of investment advice or basis for action. The market carries risks; invest with caution. Do not make decisions based solely on this content.