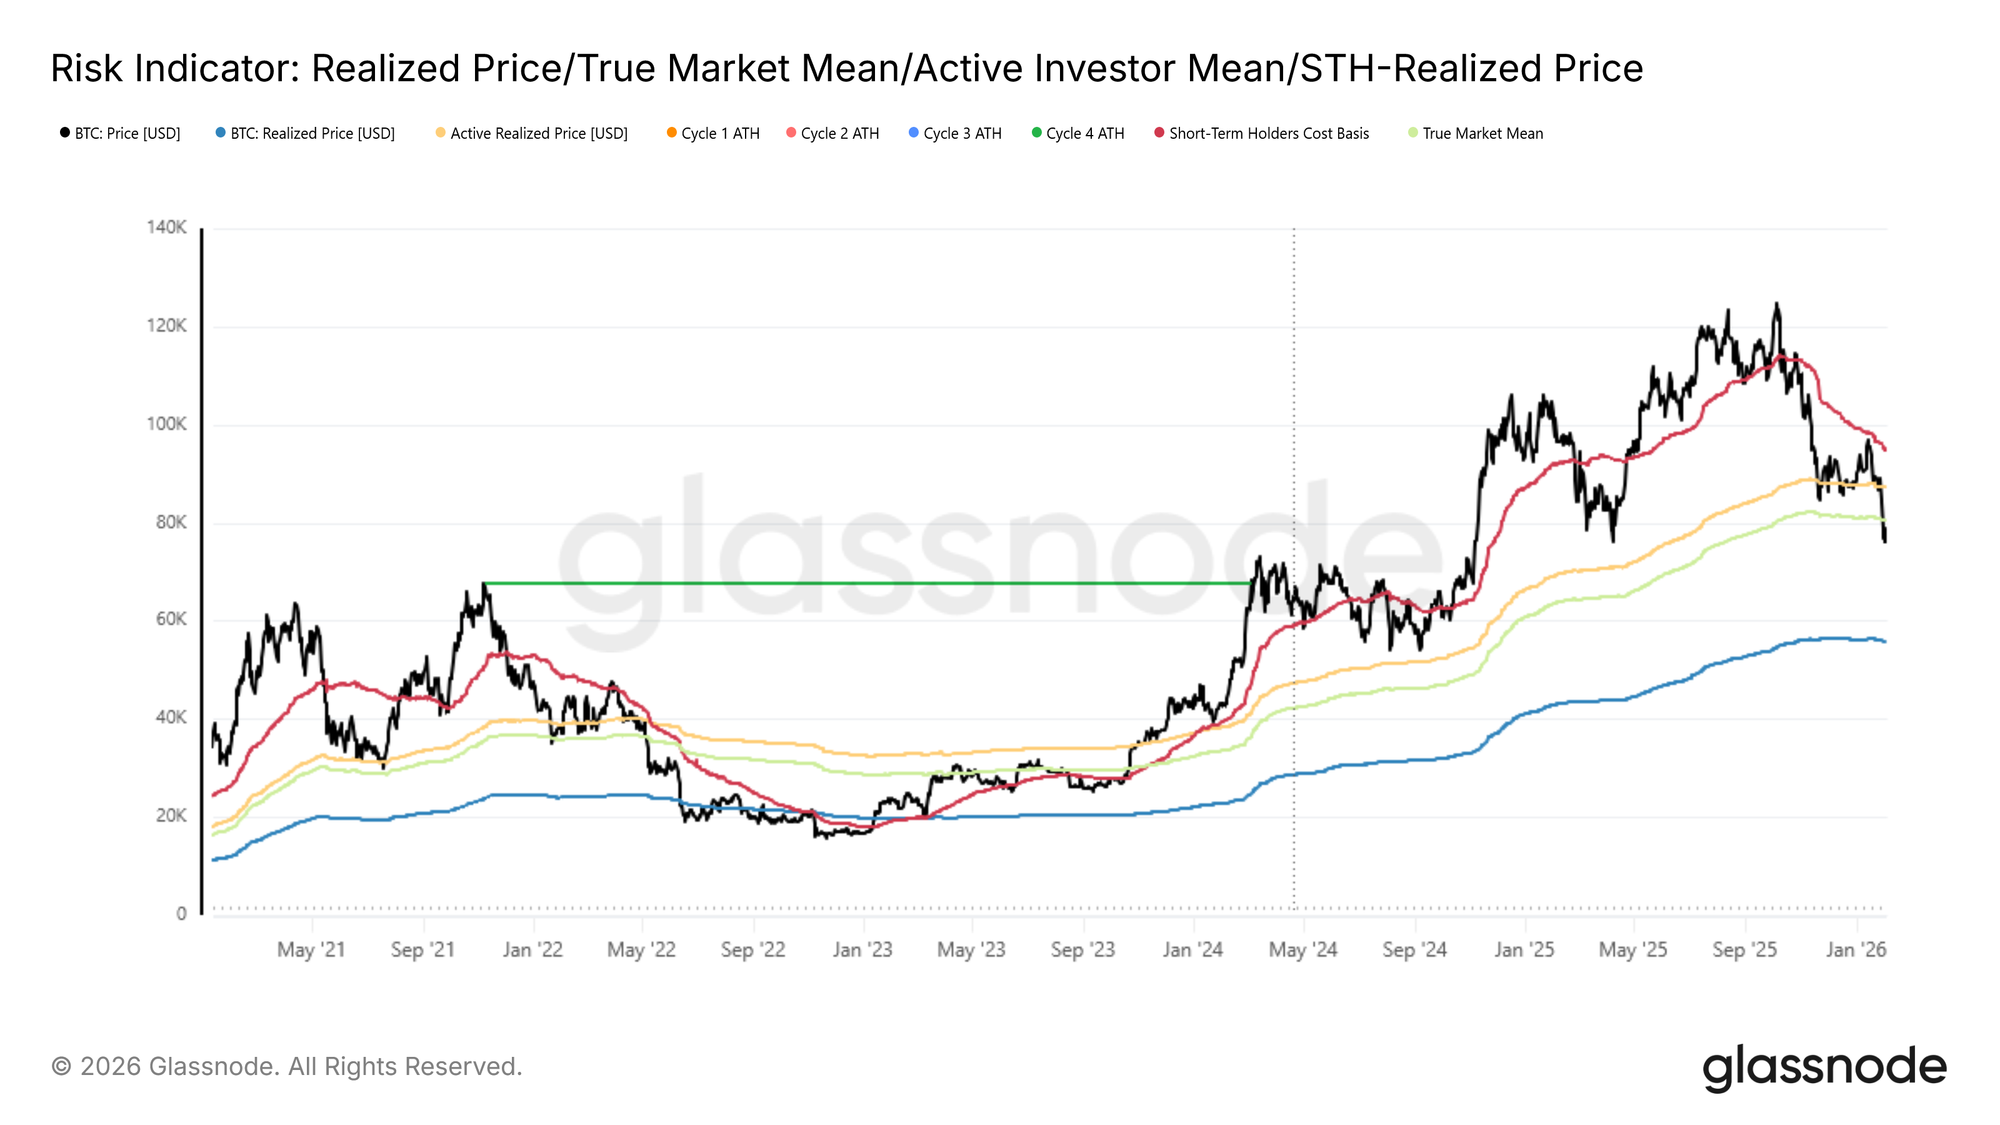
Following last week’s assessment, where we highlighted mounting downside risk after price failed to reclaim the short-term holder cost basis around $94.5k, the market has now decisively broken below the True Market Mean.
Below the Structural Mean
True Market Mean, which represents the aggregate cost basis of the actively circulating supply, excluding long-inactive coins such as lost supply, early miner holdings, and Satoshi-era coins, has repeatedly served as the final line of support throughout the current shallow bear phase.
The loss of this structural anchor confirms a deterioration that has been building since late November, with the broader market configuration increasingly resembling the early-2022 transition from range compression into a deeper bear market regime. Weak demand follow-through, combined with persistent sell-side pressure, suggests that the market is now in a more fragile equilibrium.
From a mid-term perspective, price is increasingly constrained within a broader valuation corridor. On the downside, the True Market Mean near $80.2k now acts as overhead resistance, while the Realized Price, currently around $55.8k, defines the lower bound where long-term capital is historically re-engaged.
Mapping the First Demand Zones
With the structural backdrop now reset, attention naturally turns to downside stabilization. As the market transitions deeper into this phase of the cycle, the key question shifts toward identifying zones where a durable bottom may begin to form. While no single metric can define this with certainty, several on-chain tools provide insight into where near-term demand may emerge.
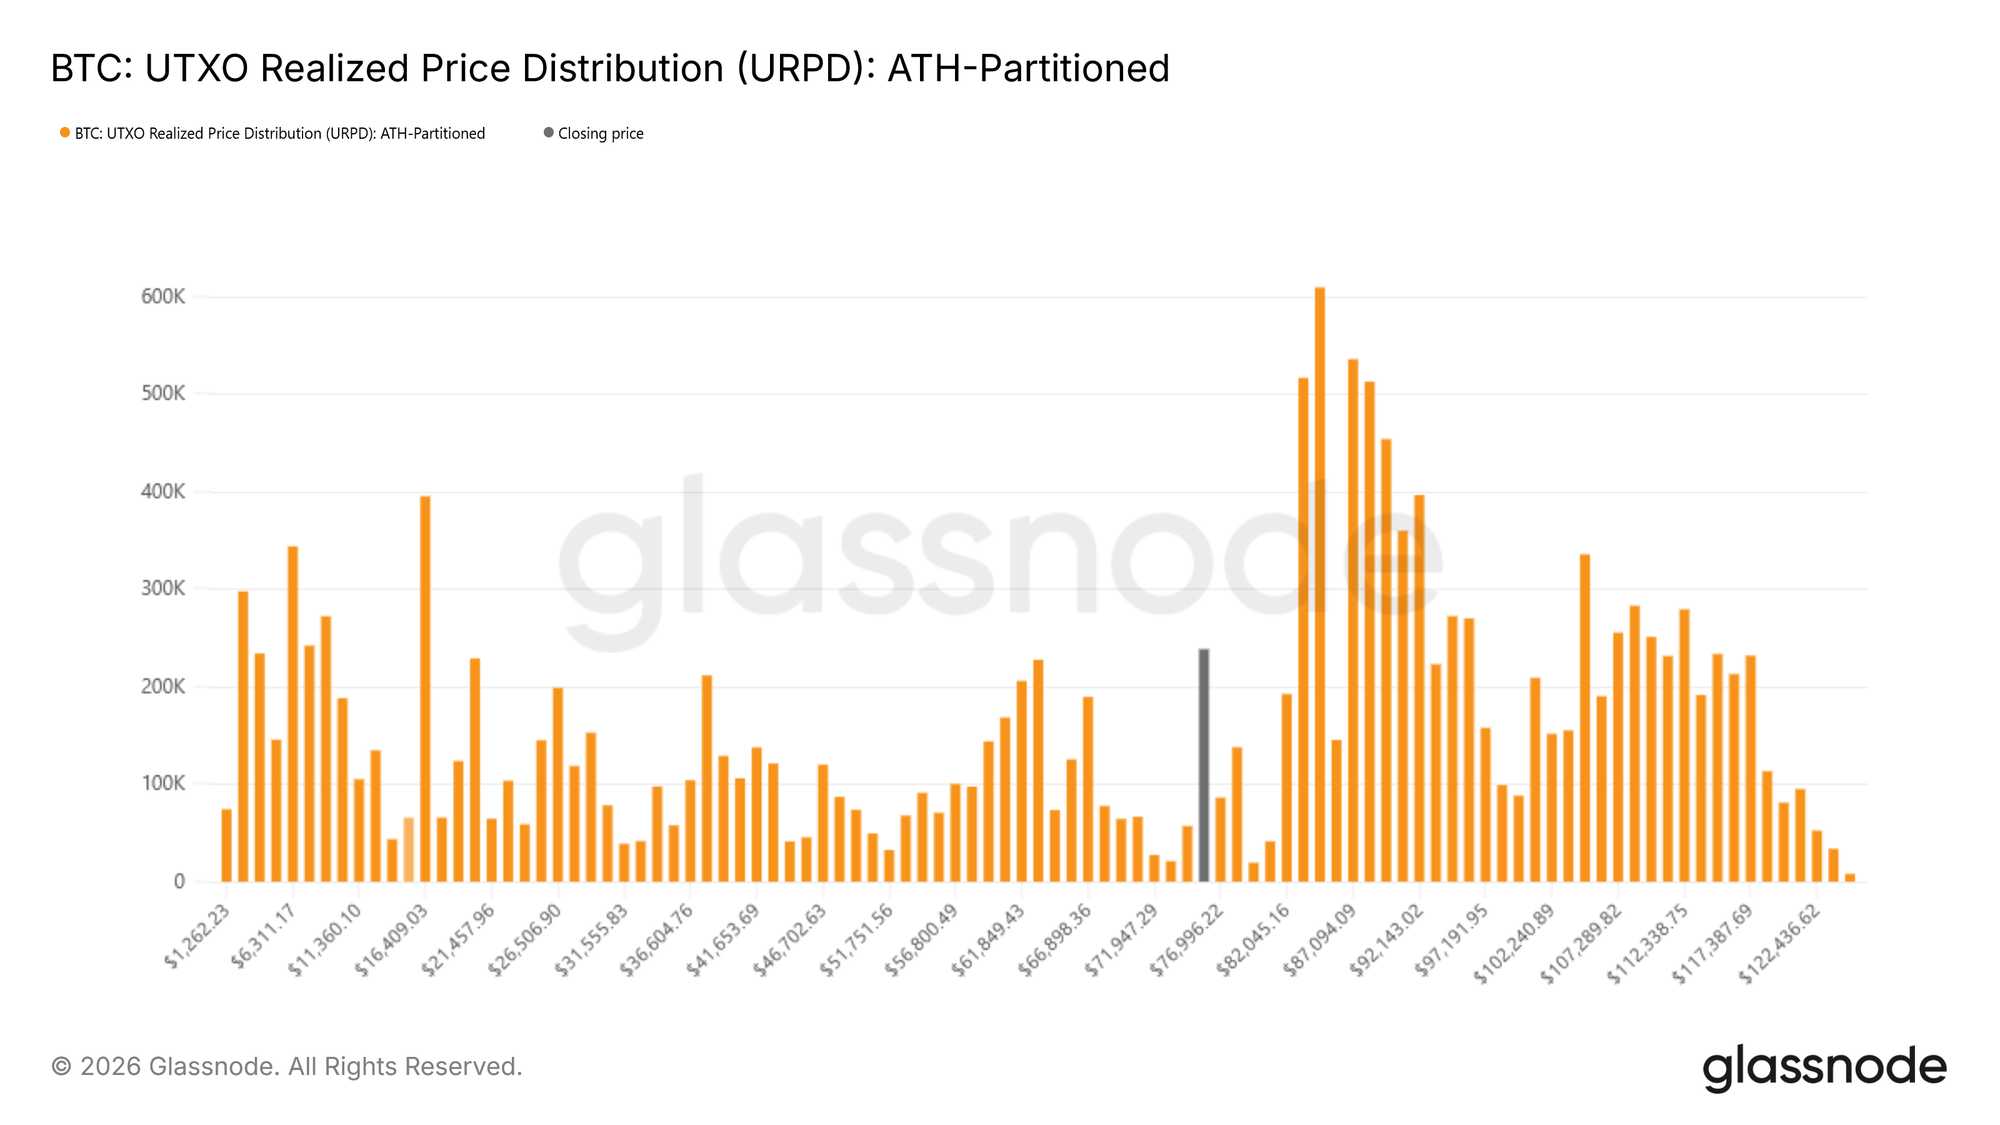
One such lens is the UTXO Realized Price Distribution (URPD), which maps the supply held at different cost bases. Current distributions show notable accumulation by newer participants within the $70k–$80k range, suggesting early positioning by buyers willing to absorb weakness at these levels. Beneath this zone, a dense supply cluster between $66.9k and $70.6k stands out as a particularly high-conviction region. Historically, areas with concentrated cost basis often act as short-term shock absorbers, where sell-side pressure is more readily met by responsive demand.
Stress Beneath the Surface
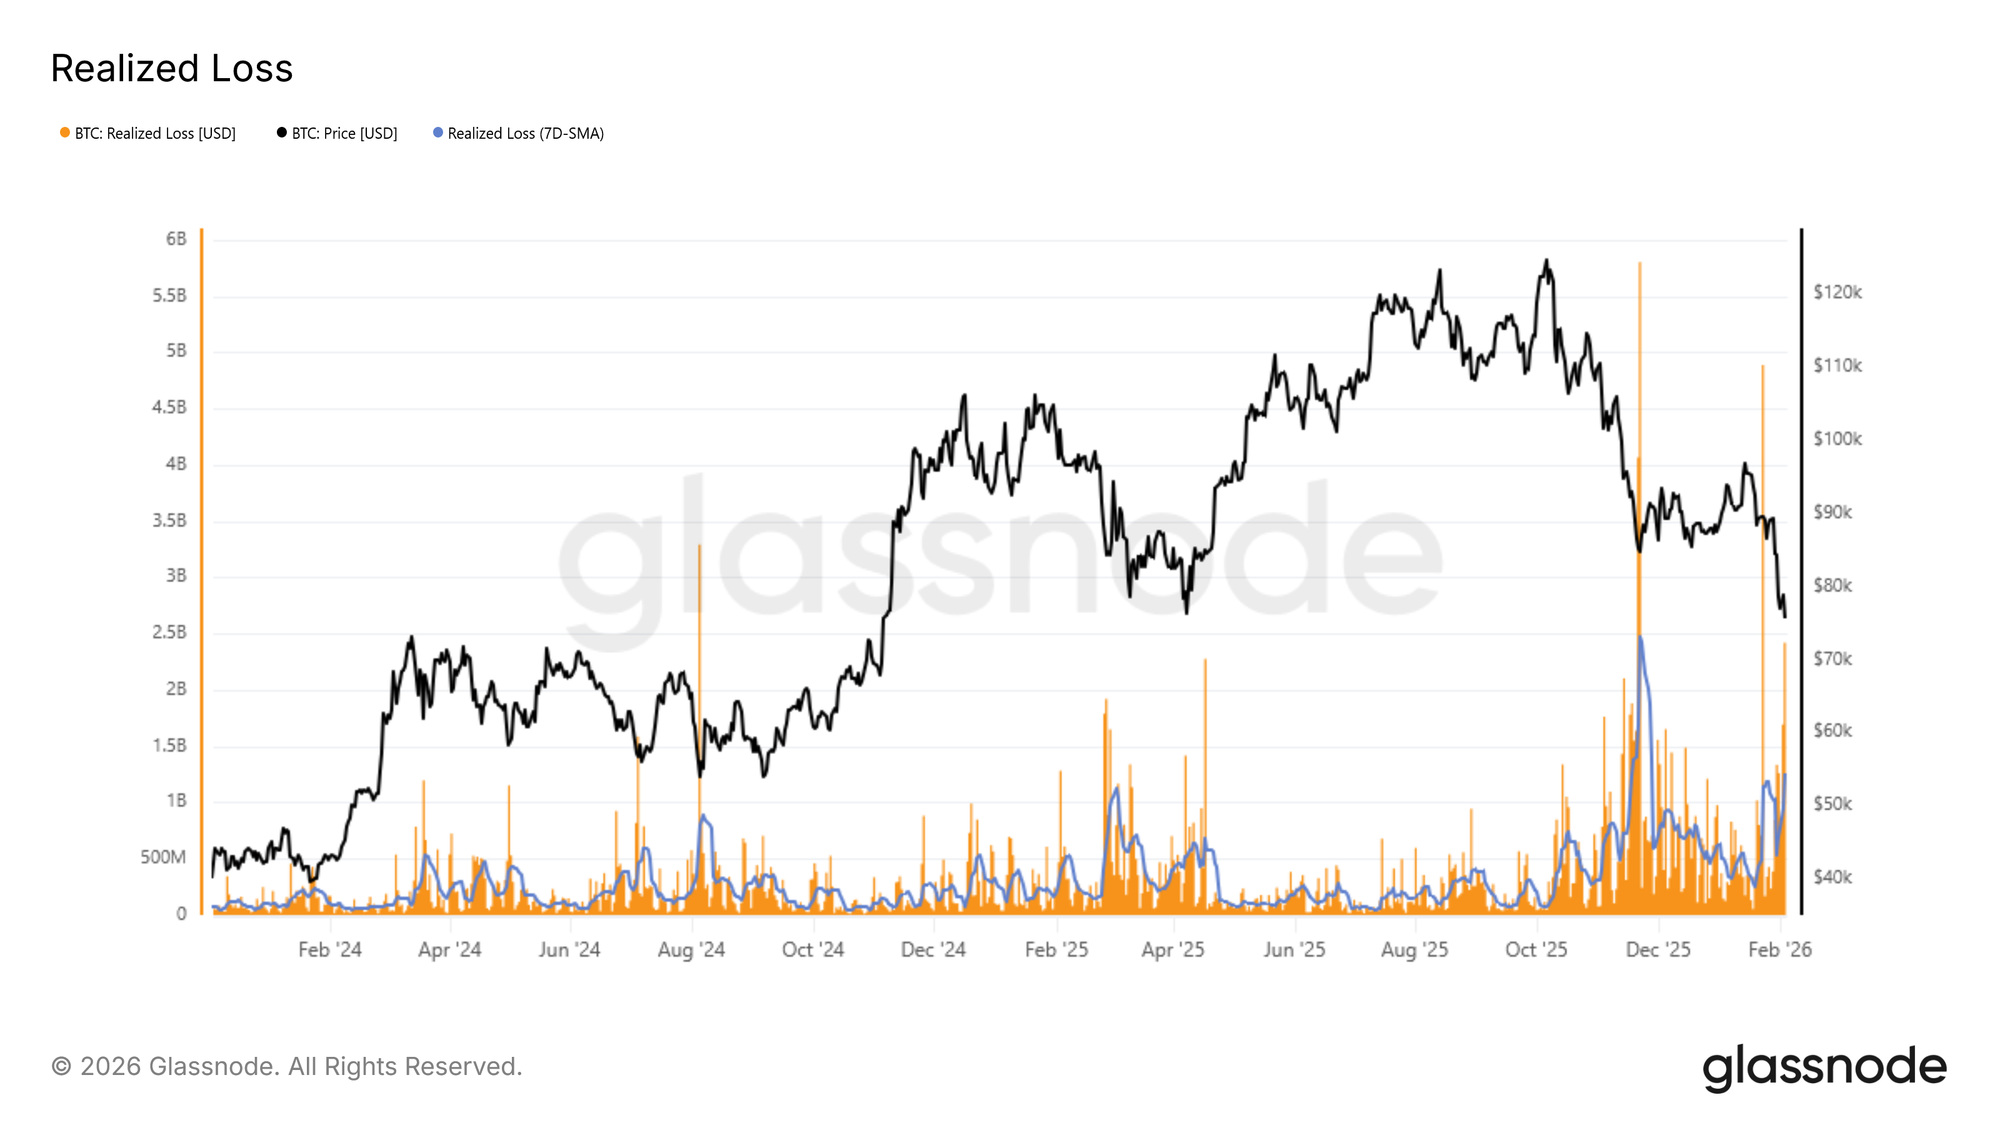
Capitulation dynamics offer another lens into near-term downside risk. Realized Loss provides a direct measure of investor stress by quantifying the volume of coins spent at a loss over a given time window, making it a useful tool for identifying periods of panic-driven selling.
During the current contraction, the 7-day simple moving average of realized losses has risen above $1.26B per day, reflecting a marked increase in fear and frustration following the loss of the True Market Mean. Historically, spikes in realized losses often coincide with moments of acute seller exhaustion, where marginal sell pressure begins to fade.
A recent example can be seen during the rebound from the $72k region, where daily realized losses briefly surged beyond $2.4B, nearly twice the prevailing 7-day average. Such extremes have frequently marked short-term inflection points, where forced selling gives way to temporary price stabilization.
Stress Versus Historical Extremes
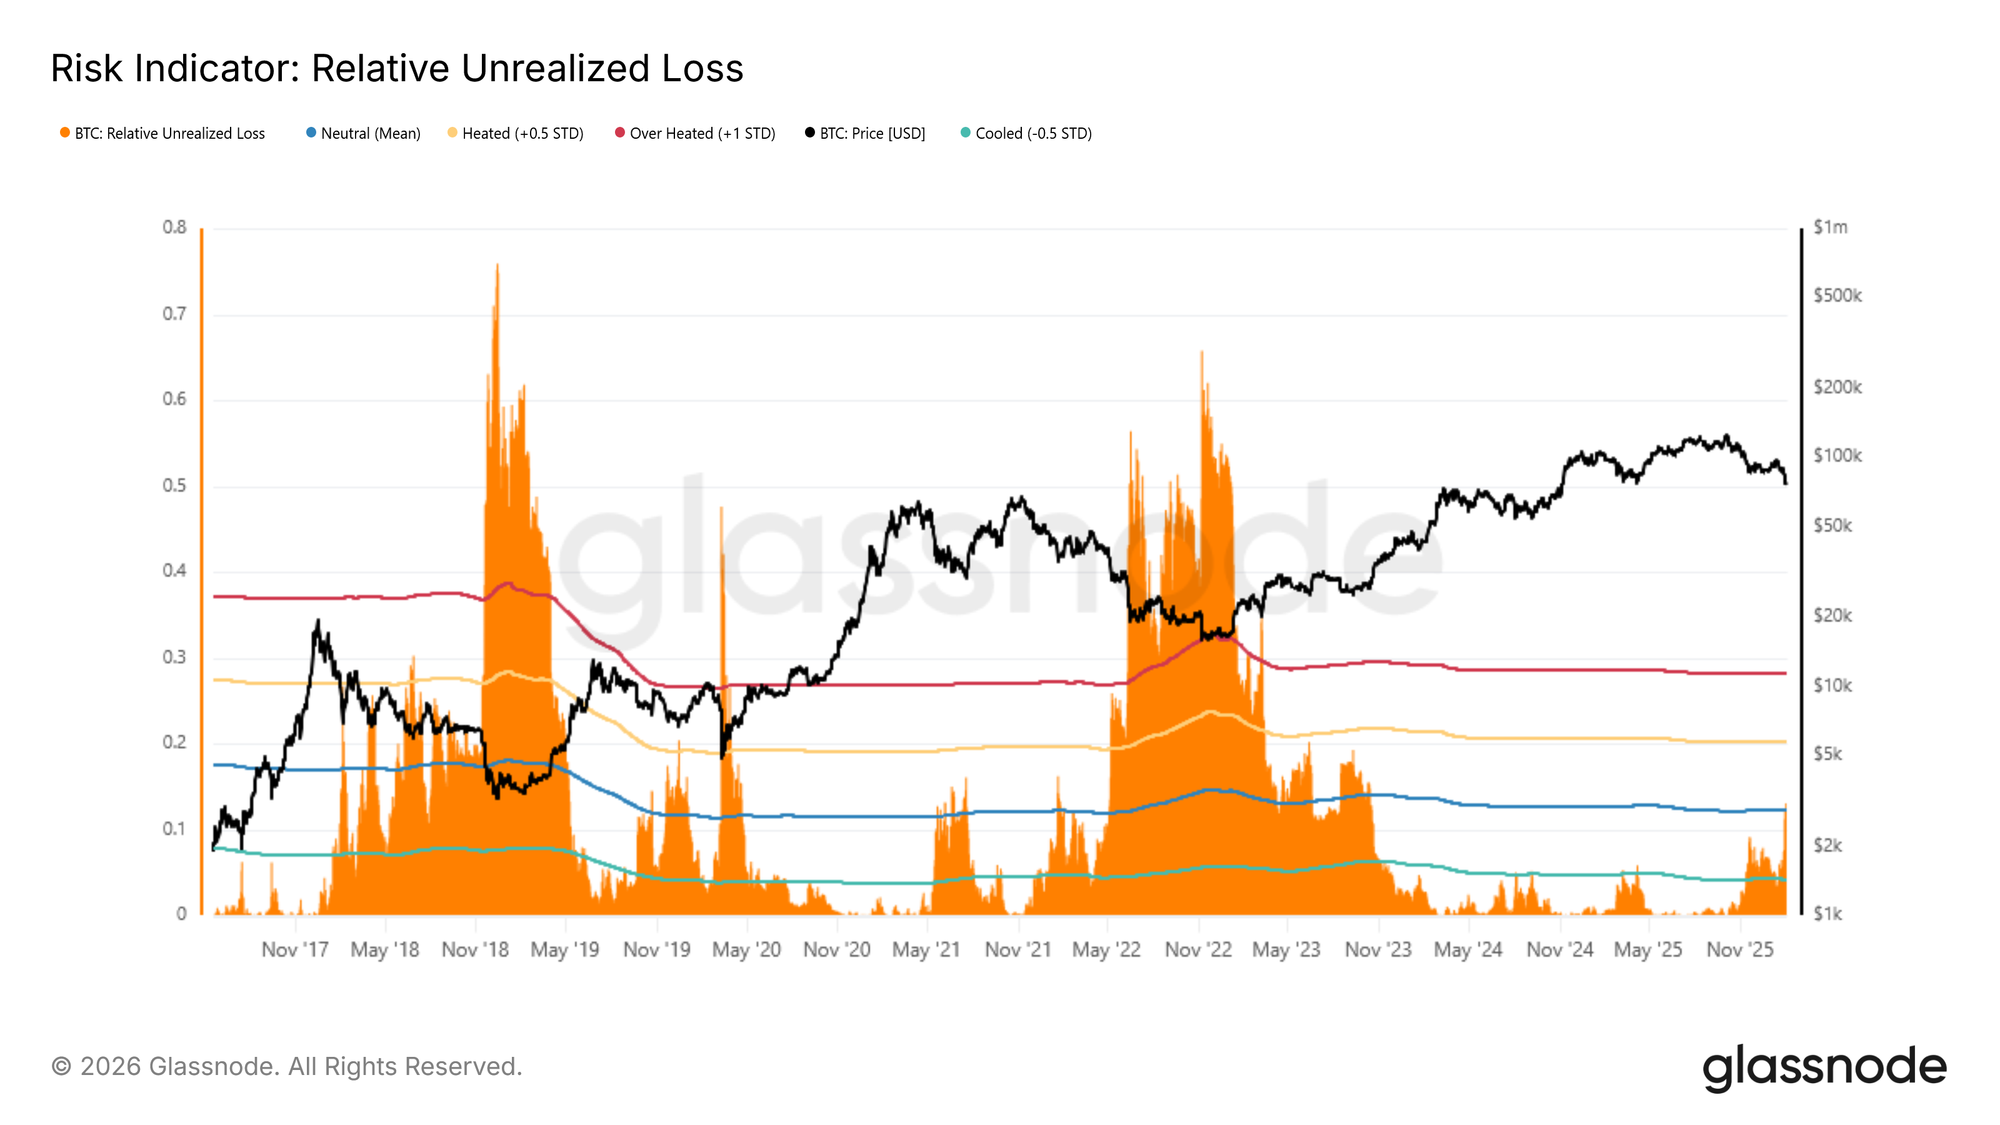
Taking a broader historical view adds important context to current conditions. To better frame the market’s position, Relative Unrealized Loss can be compared against prior bear-market extremes. This metric expresses the USD value of unrealized losses as a share of total market capitalization, allowing stress levels across cycles to be assessed on a normalized basis. Historically, cyclical peaks have exceeded ~30% (around +1 standard deviation), with far more severe readings in the 65%–75% range observed near the 2018 and 2022 cycle lows.
At present, Relative Unrealized Loss has risen above its long-term cyclical mean near 12%, confirming mounting pressure on investors holding coins with cost bases above the current spot price. While stress is clearly elevated, historical precedent suggests that moves toward the upper extremes typically coincide with exceptional dislocation events, such as the LUNA or FTX collapses, where price rapidly converged toward the Realized Price.
Off-Chain Insights
Weakness persists as Spot and Futures volumes are still subdued and the options market remains focused on downside protection.
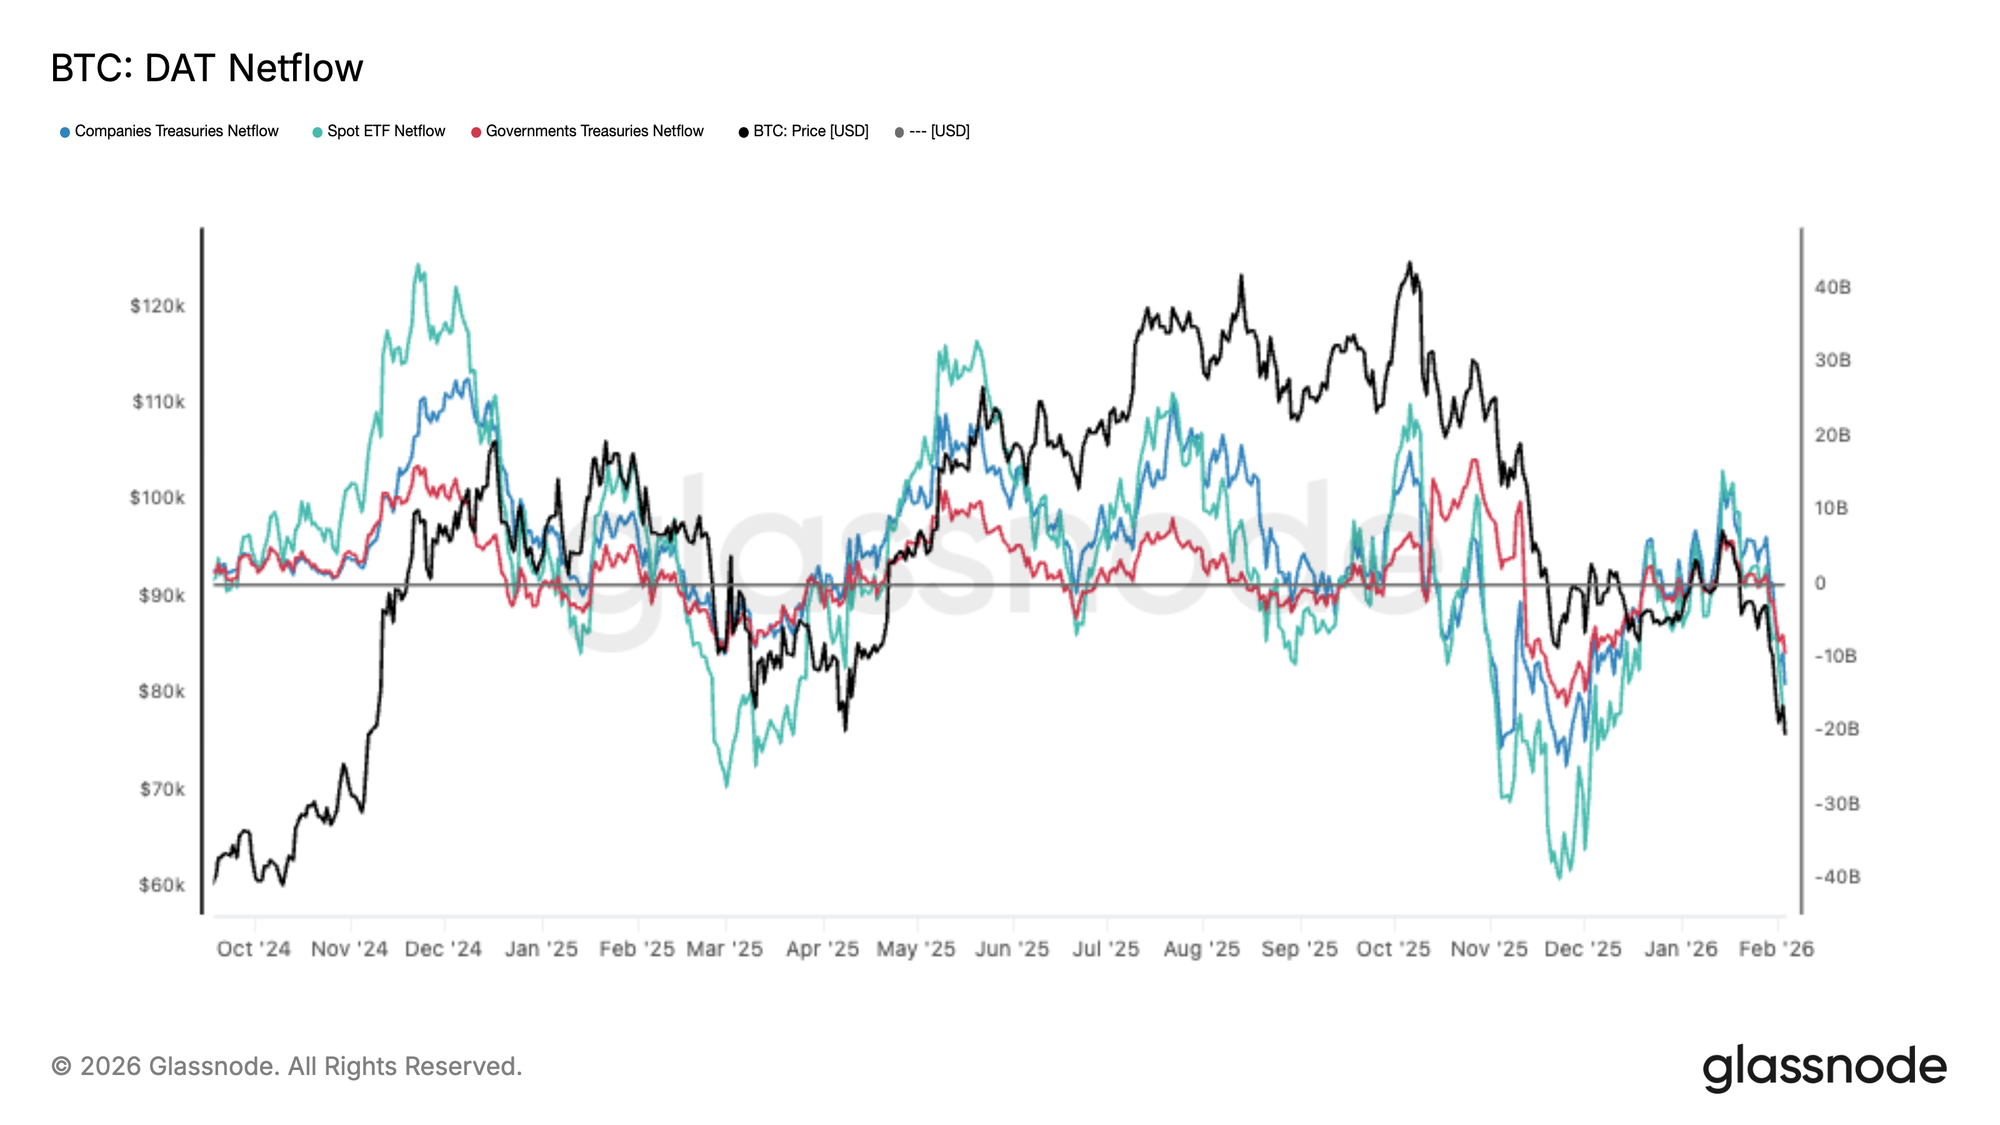
Institutional Flow Swings to Net Outflow
Demand across major allocators has deteriorated materially, with the DAT Netflow basket flipping back into net outflows as BTC breaks down. Spot ETF flows have softened sharply, while both corporate and government treasuries are also fading, signalling a broad-based retrenchment in marginal demand.
This is a key shift from the prior expansion phase, where persistent inflows helped absorb supply and support higher price discovery. Instead, flows are now consistently rotating negative, reinforcing the view that the market is struggling to attract fresh capital at current levels.
With institutional and treasury demand no longer providing a reliable bid, downside risk remains elevated, and any relief rallies are likely to face resistance unless netflows stabilise and re-accelerate back into sustained inflow.
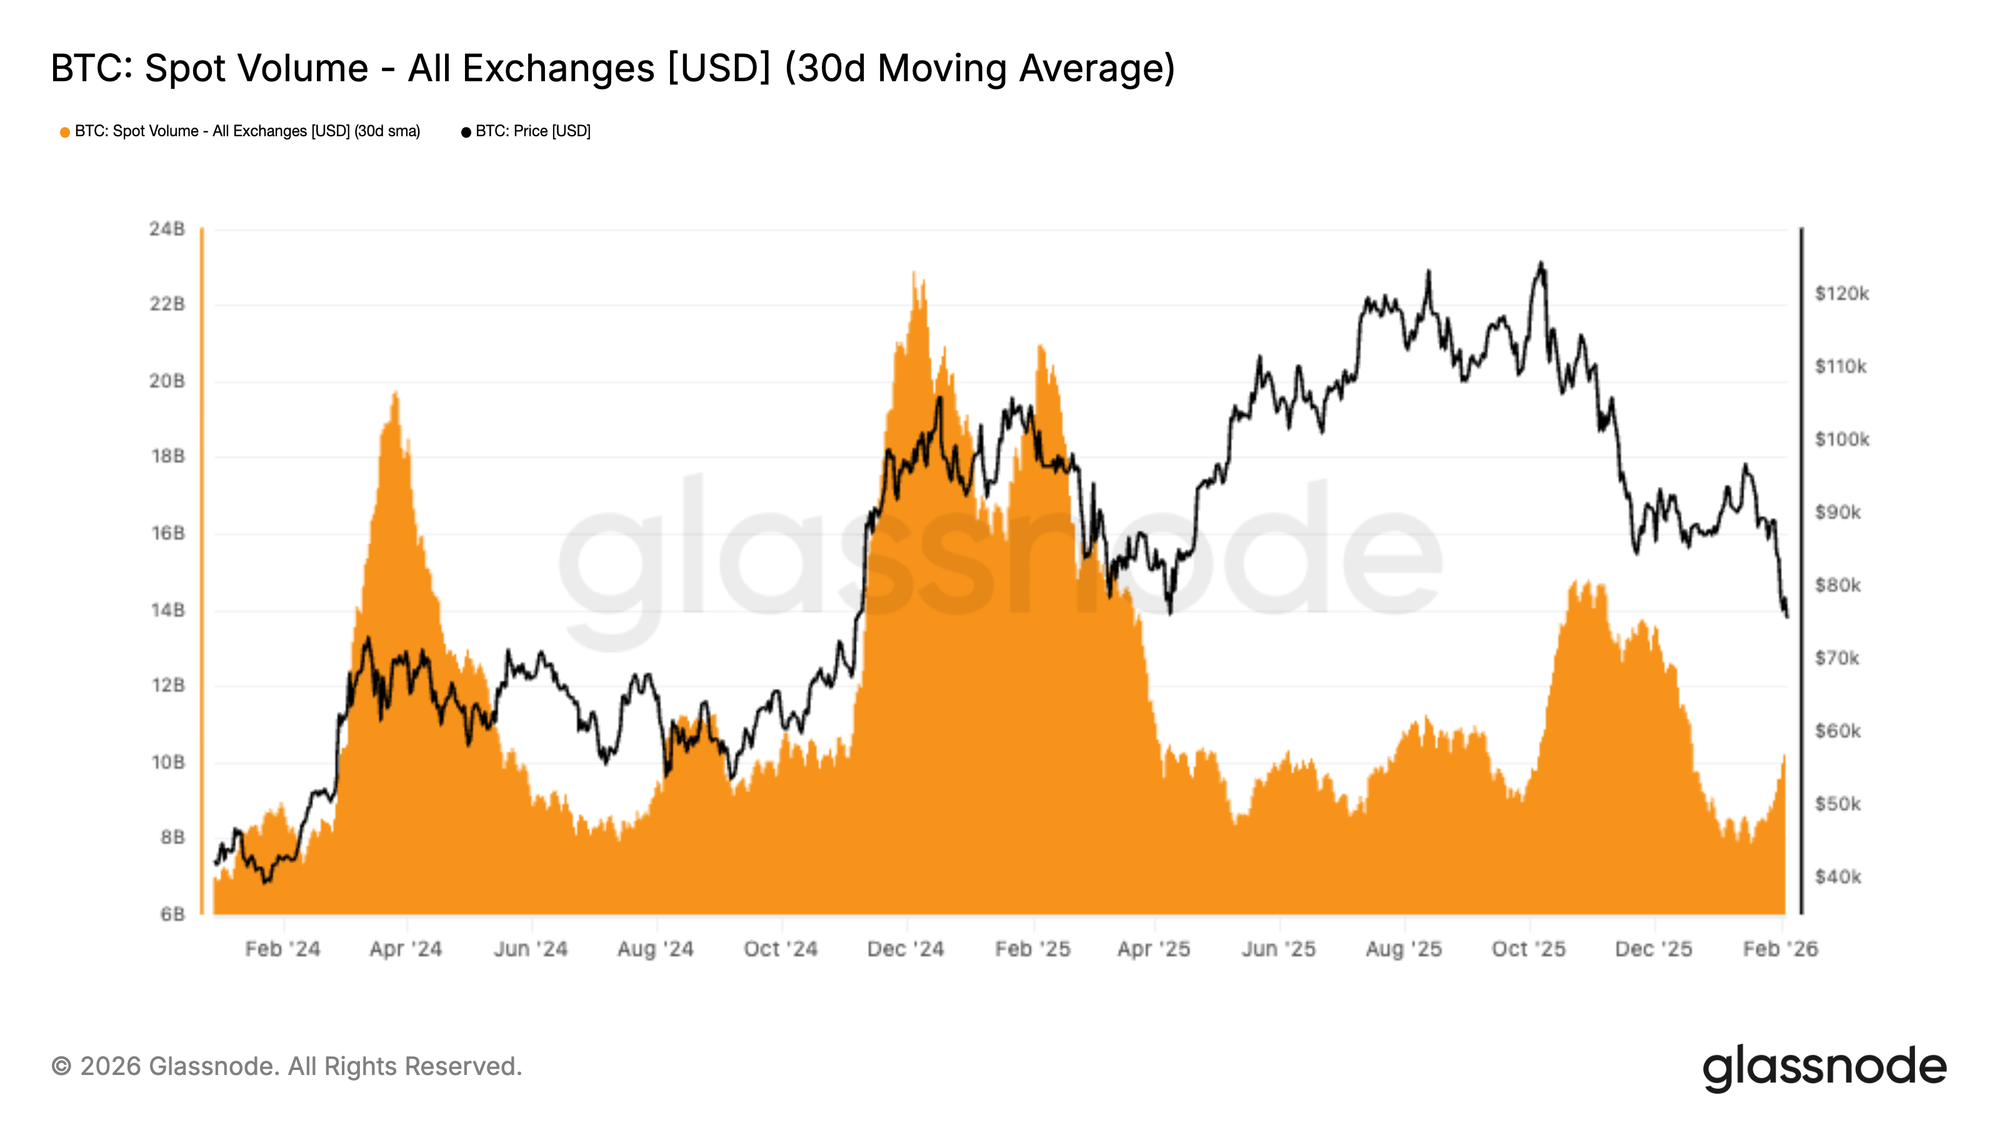
Spot Volume Still Low
Spot volumes remain structurally weak, with the 30D average still depressed despite BTC rolling over from $98 to the $72k. This is emblematic of a demand vacuum, where sell-side pressure is not being met with meaningful, sustained absorption.
Historically, durable trend reversals have coincided with spot volume expanding aggressively as new demand steps in to take the other side. In this case, volume has only lifted modestly into the decline, suggesting activity is largely reactive and dominated by distribution and de-risking rather than conviction-driven accumulation.
With liquidity still thin, price remains vulnerable to downside continuation, as even moderate sell programs can exert outsized impact in a market lacking consistent spot bid support.
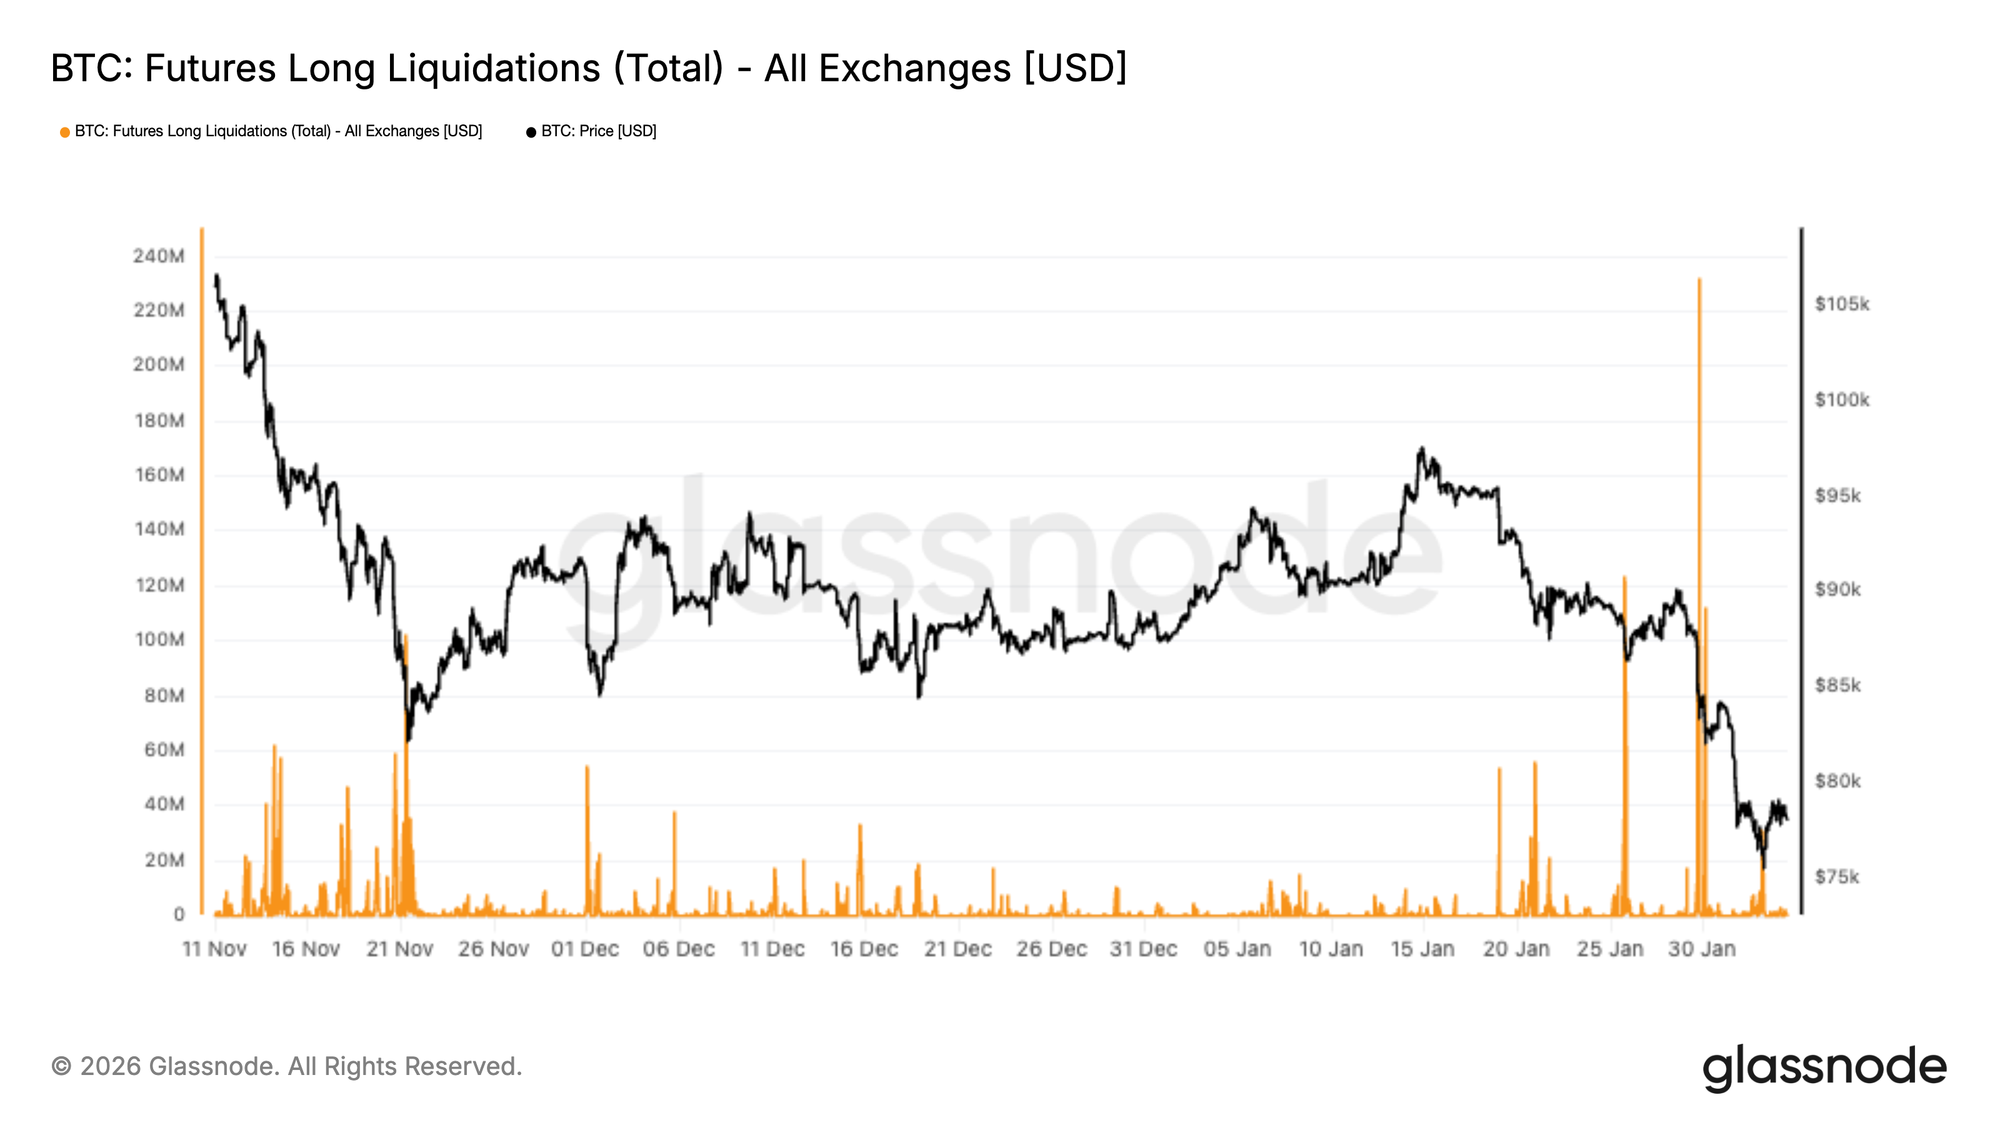
Futures Liquidations
A sharp liquidation cascade has hit BTC derivatives markets, with total long liquidations across exchanges spiking to the largest print of this entire drawdown. This reflects an aggressive flush-out of leveraged long positioning as price broke lower, accelerating downside momentum into the mid-$70Ks.
Notably, liquidation activity had remained relatively muted through most of November and December, suggesting that leverage was progressively rebuilt into a weak spot backdrop. The recent surge marks a decisive regime shift, where forced selling has begun to dominate flows, amplifying volatility and widening intraday ranges.
From here, the ability for price to stabilise will depend on whether this leverage reset is sufficient to clear excess risk, or if further deleveraging is required.
A sustained recovery typically requires spot demand to step in, rather than relying on liquidation-driven positioning clean-outs alone.
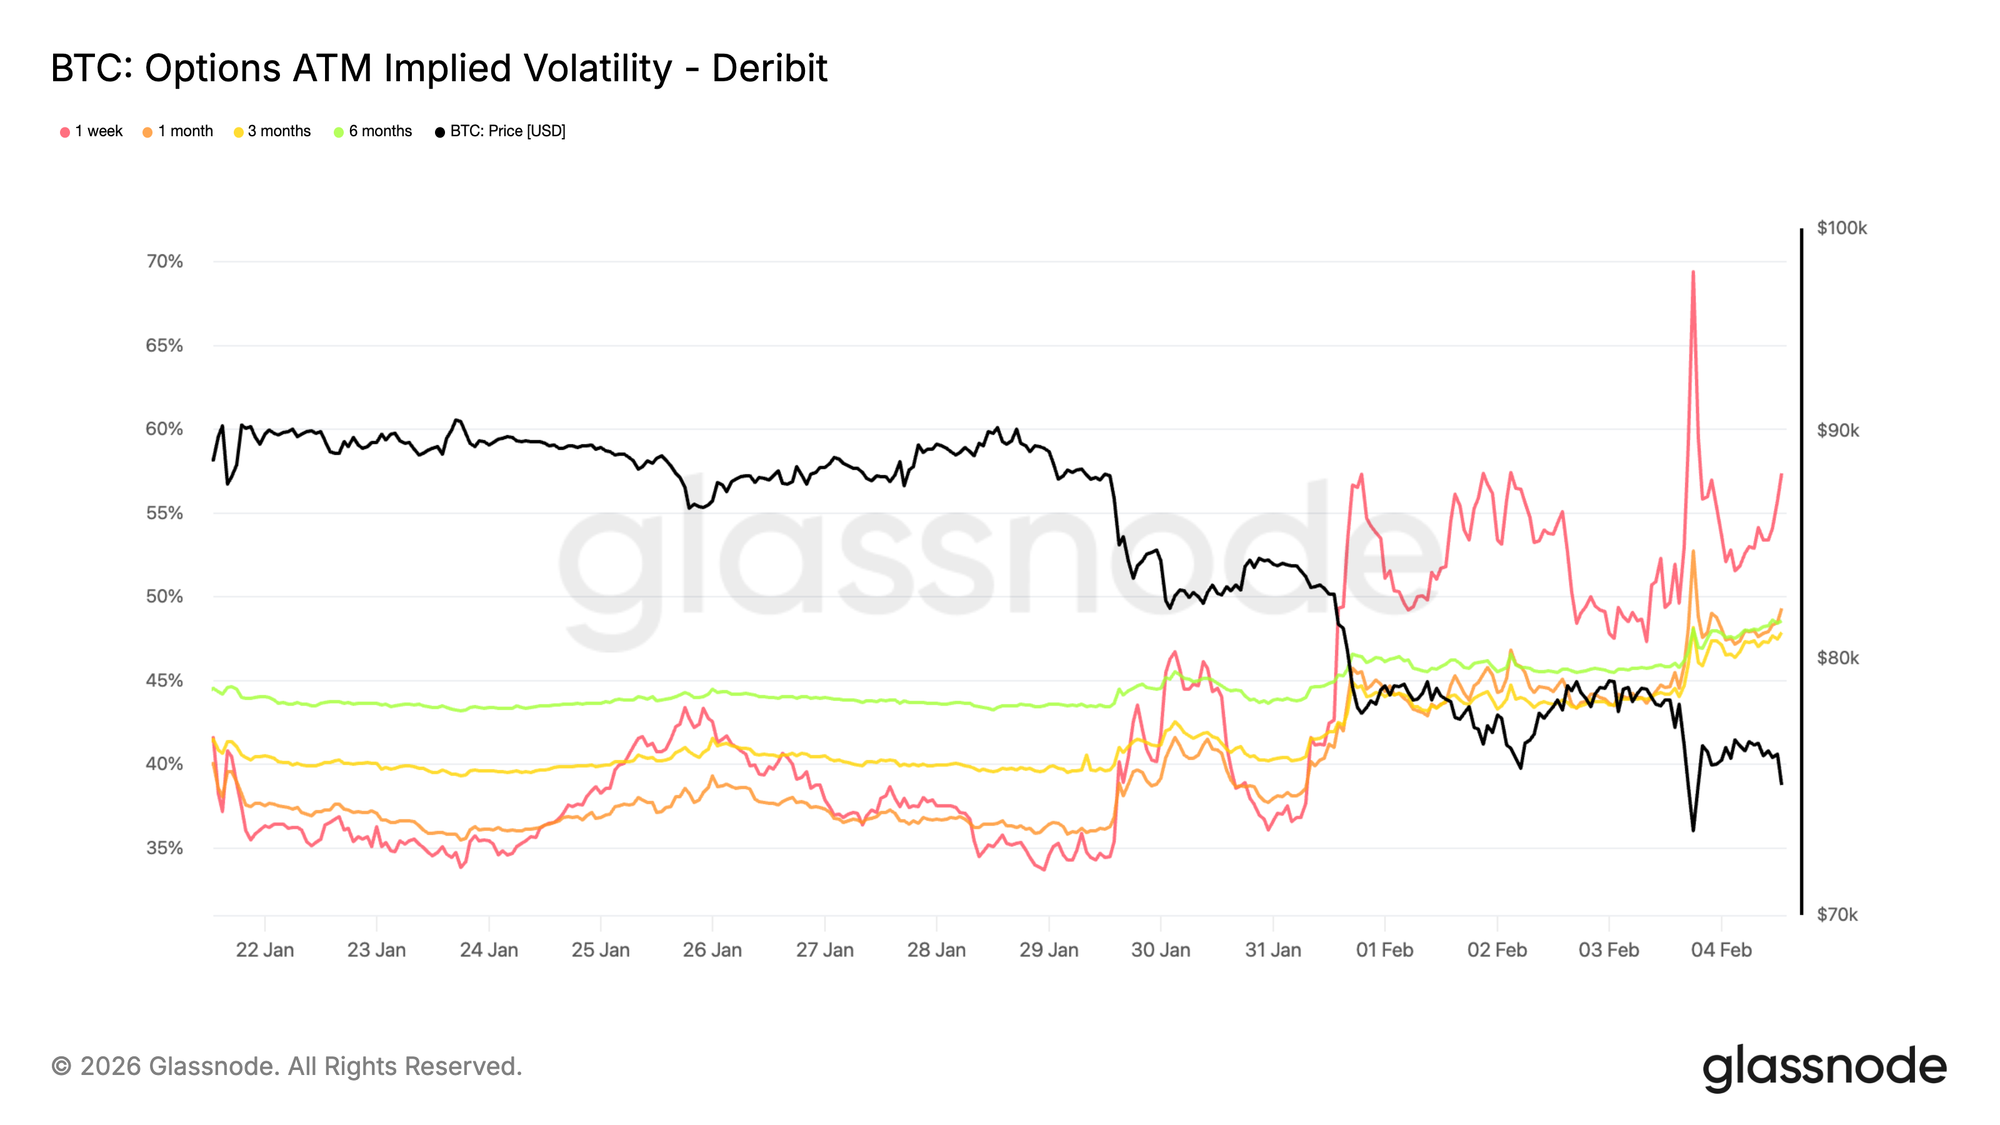
Front-End Implied Volatility Stays Bid
Short-dated implied volatility surged toward 70 percent as price retested the 73k level, a former cycle high now acting as support. Since the weekend, the volatility regime has shifted higher. One-week implied volatility is up roughly 20 vol points compared with two weeks ago, while the rest of the curve has also repriced materially, gaining high single-digit vol points.
When short-dated implied volatility remains elevated relative to recent realized moves, it shows the market continues to pay for near-term risk rather than monetizing volatility decay. The repricing is not isolated to one maturity but is led by the front end, highlighting where risk is being concentrated.
This behavior reflects strong demand for protection against sudden gap moves rather than clear directional conviction. Traders remain reluctant to sell short-dated risk aggressively, keeping downside premium supported and confidence fragile.
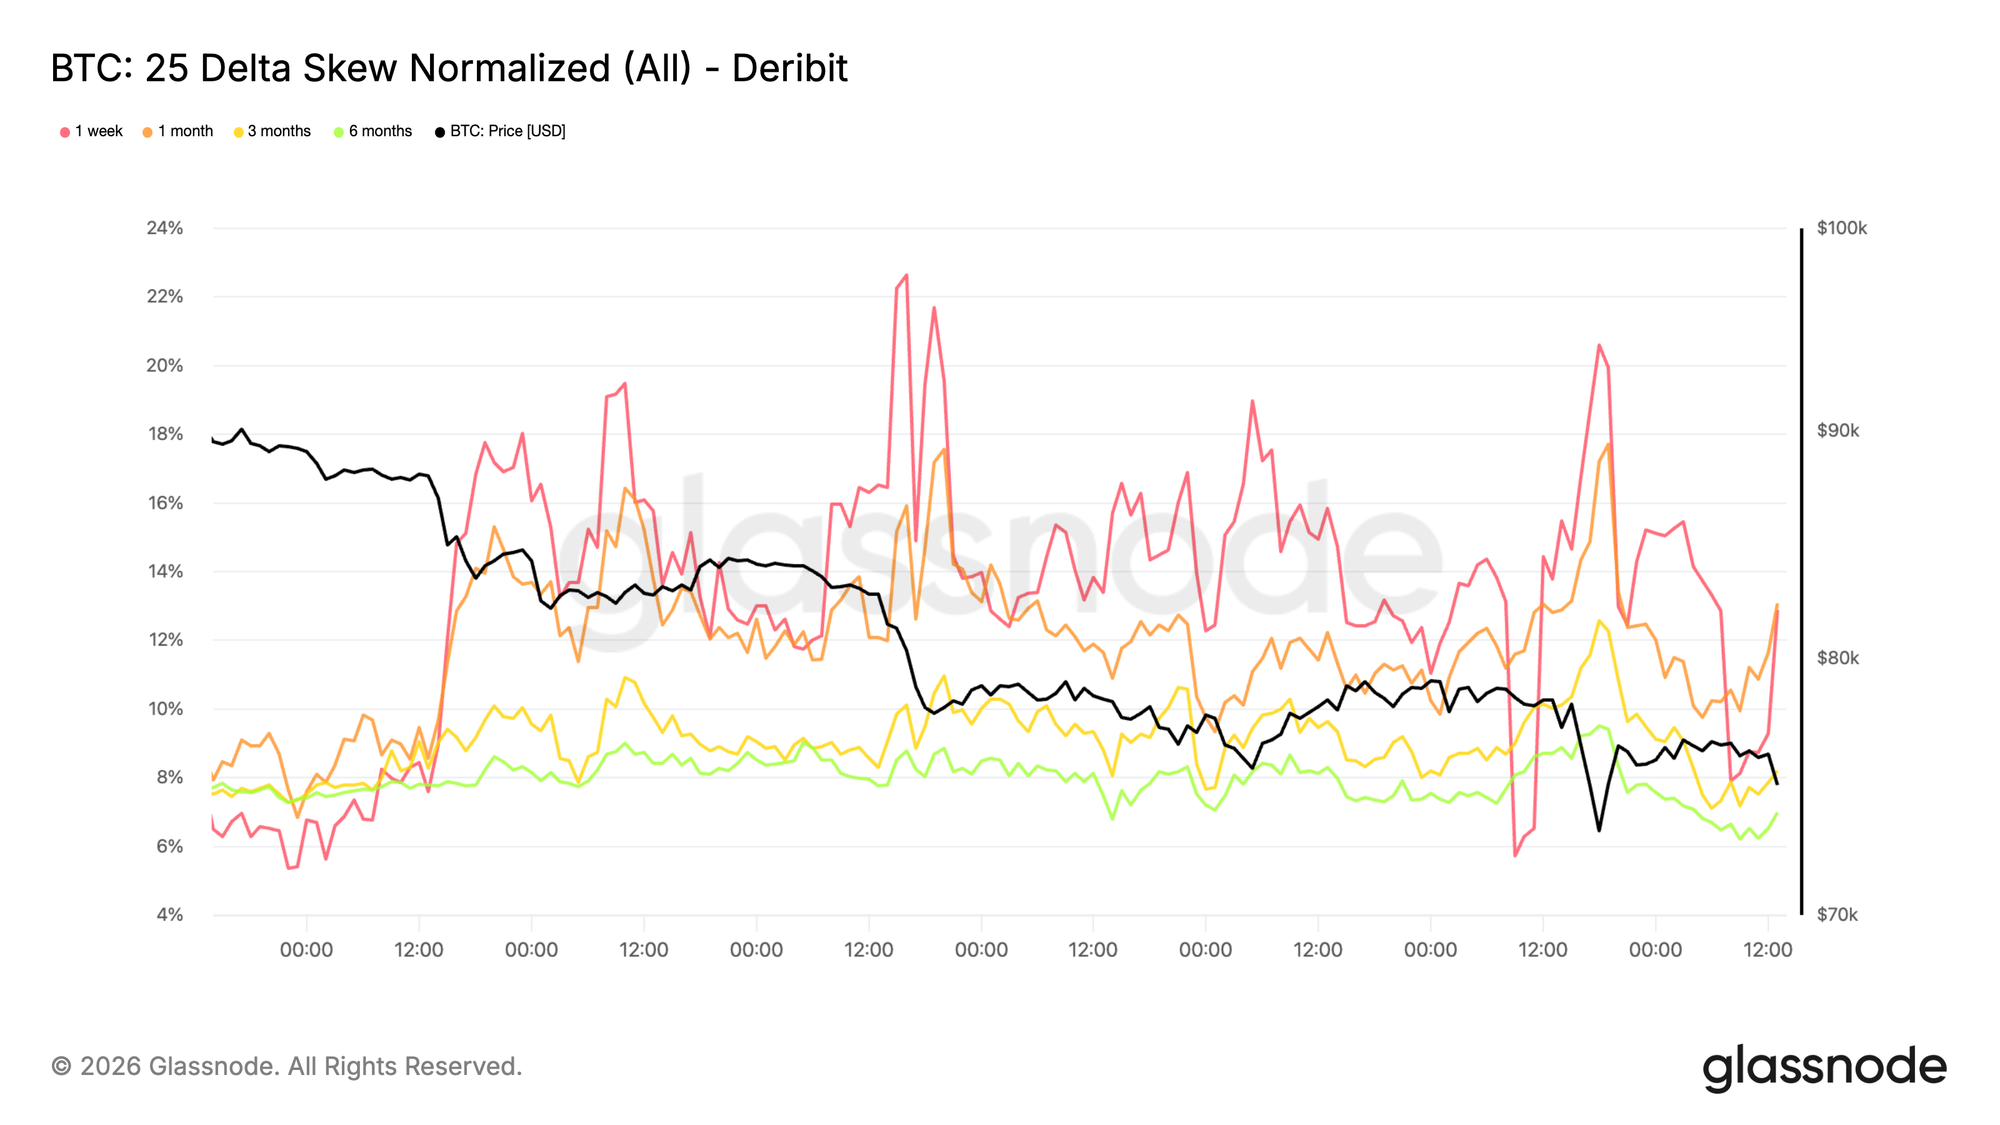
Downside Skew Continues to Steepen
The repricing in volatility is clearly directional. Downside skew has steepened again, showing stronger demand for puts relative to calls. This indicates the market is more focused on downside gap risk than on positioning for a relief rally, even as price continues to hold above the 73k level.
Rather than rotating into call demand, options flows remain concentrated in protection. This keeps the implied distribution tilted toward negative outcomes and reinforces the defensive tone already visible in front-end volatility.
Steep downside skew reflects a market willing to pay for insurance rather than express upside conviction. Positioning remains one-sided, with risk still concentrated around downside scenarios rather than recovery.
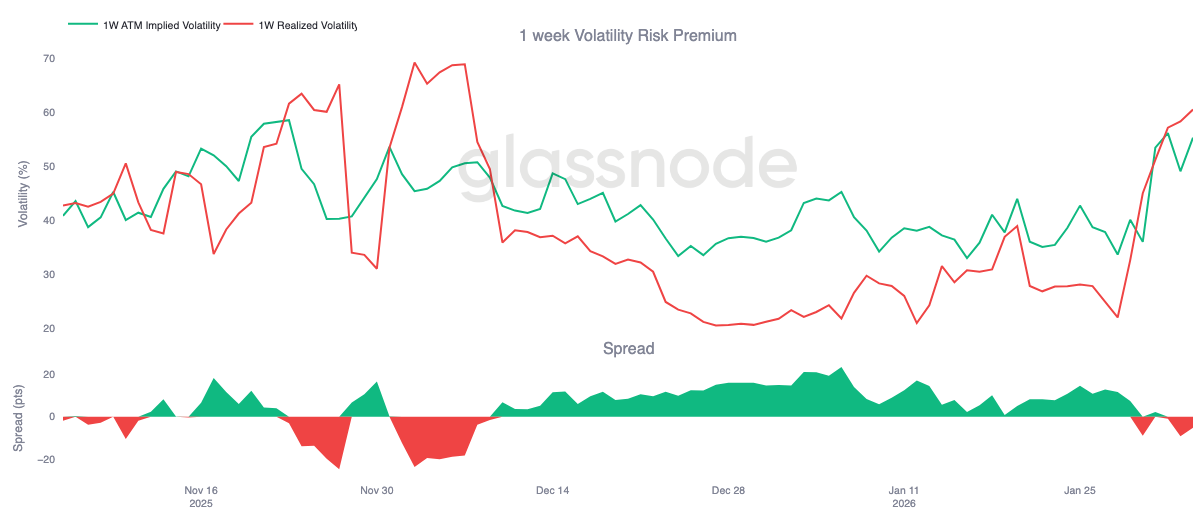
1-Week Volatility Risk Premium Turns Negative
The tension visible in front-end implied volatility and downside skew is now spilling into carry. The 1-week volatility risk premium has turned negative for the first time since early December, dropping to around -5. This is a sharp reversal from roughly +23 one month ago.
A negative volatility risk premium means implied volatility is now trading below realized volatility. For gamma sellers, carry has flipped from supportive to punitive. Positions that previously benefited from time decay are now bleeding, forcing desks to hedge more actively or roll exposure forward. This mechanical response adds to short-term pressure rather than absorbing it.
With carry in the red, volatility is no longer being warehoused. Instead, it is being realized. In this context, options flows stop dampening moves and begin to reinforce them, contributing to the current bearish pressure already visible in skew and front-end pricing.
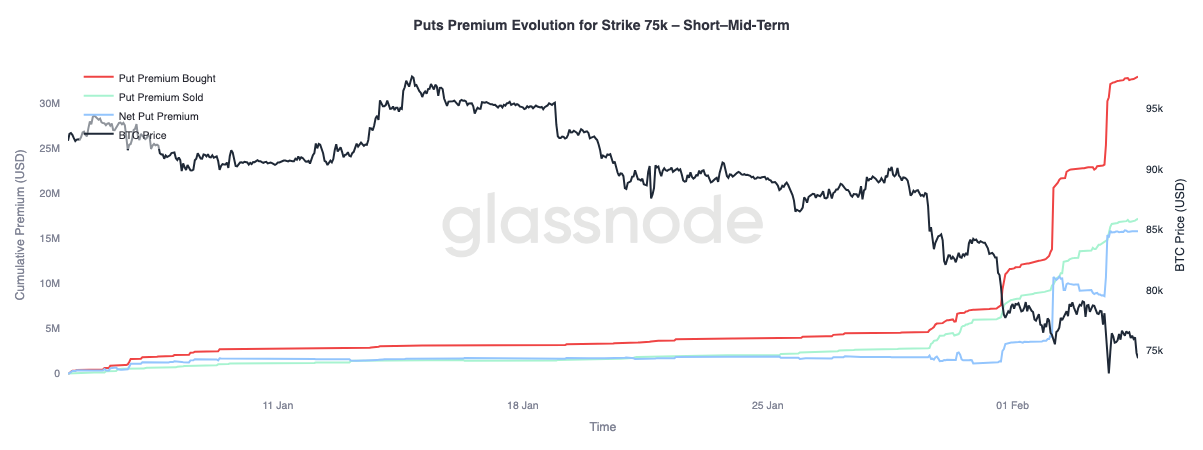
75k Put Premium Evolution (Short and Mid Term)
Let’s analyze the behavior of the 75k put premium, a level that is currently being actively contested, sustained, and repeatedly tested. This strike has become a clear focal point for short-term risk positioning.
Put premium bought has increased significantly relative to premium sold, widening the net premium gap. This repricing unfolded in three distinct phases, each coinciding with downside moves where the market failed to show meaningful relief. Each leg lower inflicted pressure on existing positions, forcing traders to hedge and reinforcing demand for protection.
Further out the curve, beyond three months and not shown on this chart, the dynamic is different. Premium sold has recently overtaken premium bought, indicating that traders are willing to monetize elevated volatility at longer maturities while continuing to pay up for short-term downside protection.
Conclusion
Bitcoin has shifted deeper into a defensive regime, with both on-chain and off-chain indicators aligning around a bearish bias. The ongoing compression in profitability metrics highlights that unrealised gains have been heavily eroded, while realised losses continue to mount as investors derisk into weakness. This is compounded by thin spot liquidity, where participation remains muted and rallies struggle to attract sustained demand.
Across derivatives markets, the selling impulse has become increasingly disorderly, with large long liquidation events confirming that leverage is being forcibly reset. While this deleveraging can remove excess speculative froth, it does not by itself establish a durable floor. Options markets reflect this uncertainty, with downside skew steepening and implied volatility remaining elevated, signalling that traders continue to position for further turbulence.
From here, the key variable remains spot demand. Without a clear expansion in spot participation and consistent inflows returning, the market remains vulnerable to downside continuation and sharp, unstable rebounds. Until conditions improve, the balance of risk remains skewed lower, and any recovery is likely to require time, absorption, and a meaningful return of conviction from buyers.