As the US and Japan Hike Interest Rates, Which Asset Class is Most at Risk?

marsbitPublicado a 2026-06-16Actualizado a 2026-06-16

Resumen

This week, global markets face two major events: the Bank of Japan's likely interest rate hike and the US Federal Reserve's FOMC meeting. For risk assets, it is a pivotal and volatile week. In the US, expectations for rate cuts have faded dramatically. May's higher-than-expected CPI and resilient jobs data have shifted the Fed's focus from potential cuts to the possibility of future hikes. New Fed Chair Wash is unlikely to raise rates at this meeting, but any hawkish shift in communication, the dot plot, or the policy statement could lead markets to price in tighter policy, pushing up short-term Treasury yields and strengthening the dollar. High-valuation growth stocks, AI-related assets, and small-cap stocks reliant on cheap funding are most vulnerable to rising rates. In Japan, a 25 basis point hike is almost fully priced in (98.3% probability), which would bring the policy rate to 1%, its highest since 1995. The concern is not the hike itself, but its potential to unwind the massive "carry trade," where investors borrowed low-yielding yen to invest globally. Historically, Japan's rate hikes have coincided with global market stress (2000, 2007, 2024). While this well-telegraphed hike may be digested smoothly, two key factors increase uncertainty: 1) Governor Ueda's absence due to illness, putting communication in the hands of less-familiar deputies, and 2) the Fed meeting occurring just days later, creating potential for a compounded market reaction if both central banks ...

This week in global markets, the main themes are Japan's interest rate hike and the Federal Reserve meeting. For risk assets, this week is destined to be anything but mild.

Three months ago, Wall Street was still discussing when rate cuts would come. Markets were willing to give the new Chairman some leeway, inflation was coming down, employment was loosening up, and rate cuts seemed only a matter of time. But the financial world is fickle; the script everyone imagined did not come to pass.

May CPI rose 4.2% year-on-year, 0.5% month-on-month. Energy prices rose 3.9% month-on-month, while core CPI remained around 2.9% year-on-year. Employment also gave the Fed no reason to turn dovish immediately. Non-farm payrolls added 172,000 in May, with the unemployment rate holding at 4.3%. This means the Fed now faces an awkward combination: inflation is reaccelerating, employment shows no significant weakness, and AI-related investment continues to support economic resilience. The case for rate cuts has weakened, while the conditions for rate hikes are gradually building.

Meanwhile, the Bank of Japan's policy meeting on June 15-16 is widely expected to deliver a 25 basis point hike as the base case. Polymarket's 'Bank of Japan Decision in June' contract shows a ~98.3% probability of a 25bp hike, ~1.45% for no change, and ~0.55% for a 50bp or more hike.

Many likely remember that Japan's previous interest rate hikes had significant impacts on the broader financial markets. This time, the market faces Japan's hike on Tuesday and the Fed's FOMC meeting on Thursday. Will the market fall?

Warsh's 'Debut': Fed Rate Hike Probability Rises

First, let's look at the Fed side.

The possibility of rate cuts seems to have been almost shut off. Polymarket shows 'No rate cut in 2026' at ~70.35%, 'Rate cut before July' at ~2.35%, and 'Rate cut before December' at only ~23%. Seven out of ten people are betting on not a single cut this year. For the year-end rate range, maintaining a 3.75% upper bound is ~37%, 4.00% ~32.5%, 4.25% ~11.25%, and 4.50% and above ~3.35%. Above 4.00% combined is ~47%.

The market's judgment of Warsh is largely a consensus that in his debut, this week's FOMC meeting, he is highly unlikely to act on a hike. Hike risks are mainly concentrated after the third quarter. Several Polymarket contracts illustrate this consensus:

'Fed rate hike in 2026?' shows a ~34.5% probability of a hike at any time in 2026; 'Fed rate hike by...?' shows ~0.65% probability by June, ~6.15% by July, ~24.5% by September, ~32% by October; 'Fed Decision in July' shows ~3.15% for a 25bp hike in July, ~0.3% for 50bp or more, ~93.5% for no change; 'What will the Fed rate be at the end of 2026?' shows ~37% probability of the year-end upper bound at 3.75%, ~32.5% at 4.00%, ~11.25% at 4.25%, and ~3.35% at 4.50% or above.

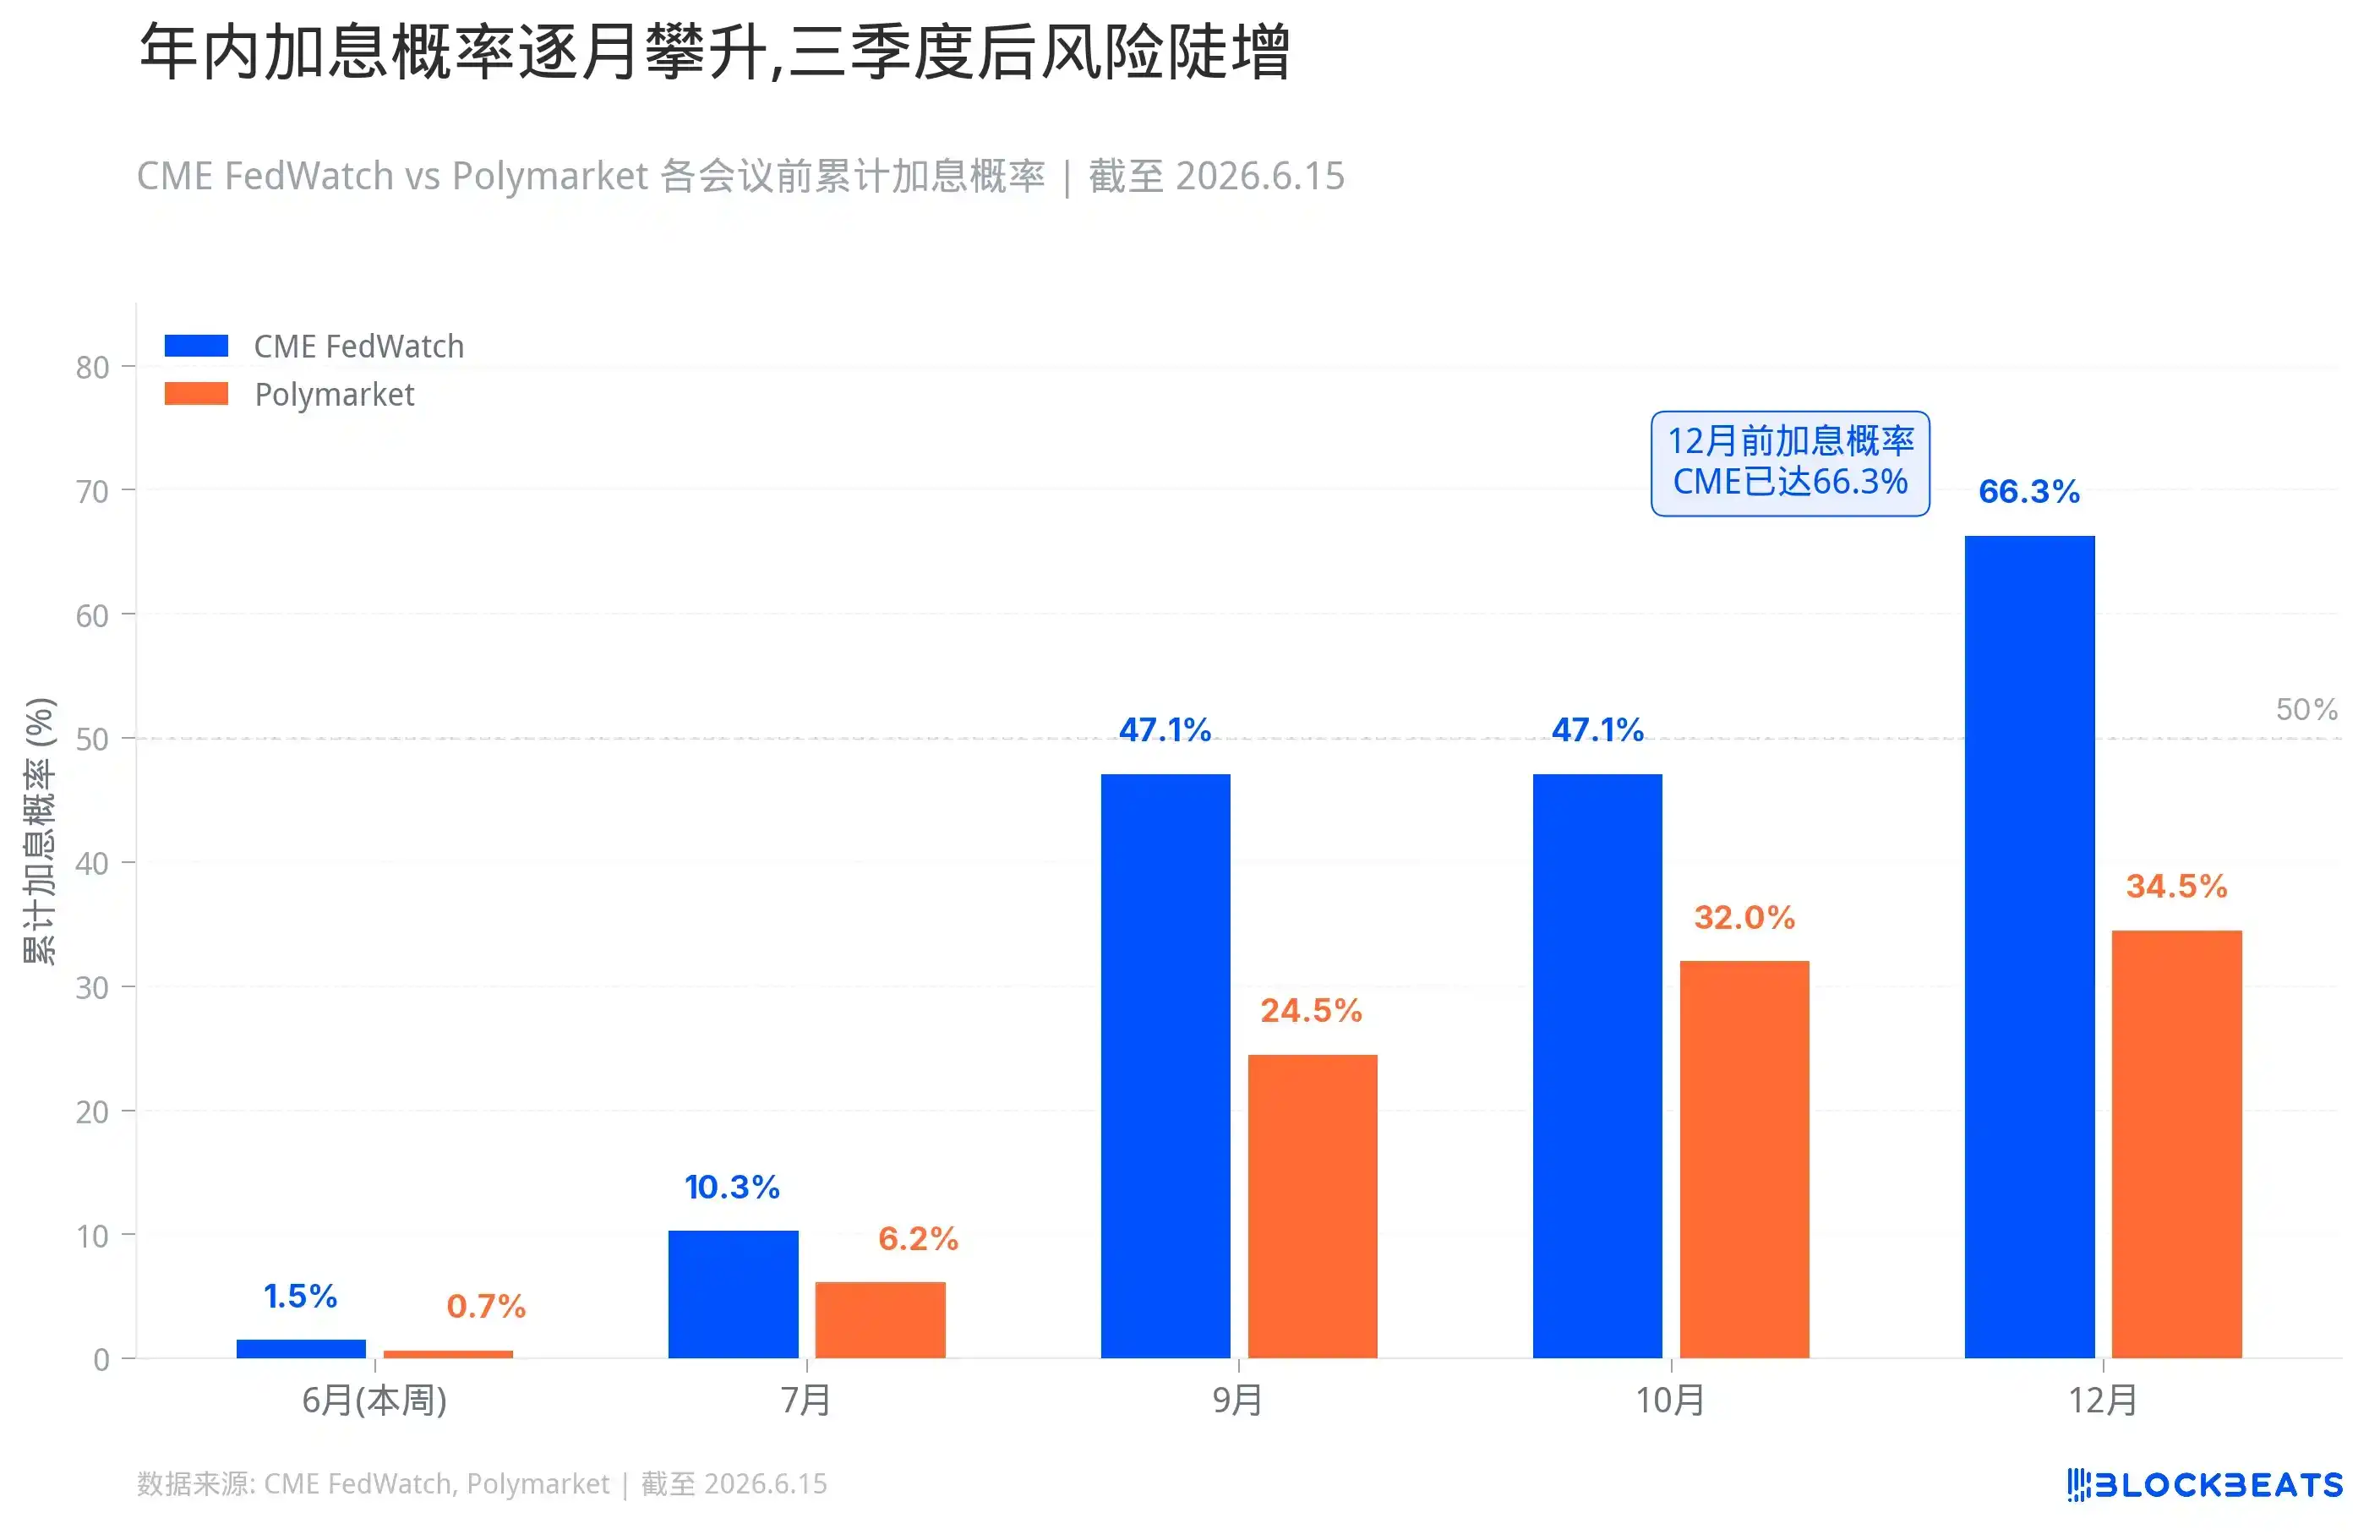
Looking at more specific probabilities and data. Probability of a hike before July 29 is ~10.3%, before October 28 ~47.1%, before December 9 ~66.3%. Polymarket is more conservative, with 'Fed rate hike in 2026?' at 34.5%, before September ~24.5%, before October ~32%. This month's probability: CME FedWatch shows 98.5% for no change, Polymarket shows 99.55%.

The US is highly likely to stand pat this week, but 'not acting' is different from 'not tightening'.

If Warsh acknowledges in the press conference that inflation risks are reasserting themselves over growth concerns, if the dot plot shifts the 2026 rate median from a cutting bias to flat or even upward revisions, if the statement removes dovish 'rate cut inclination' phrasing, then the market will do the tightening for the Fed.

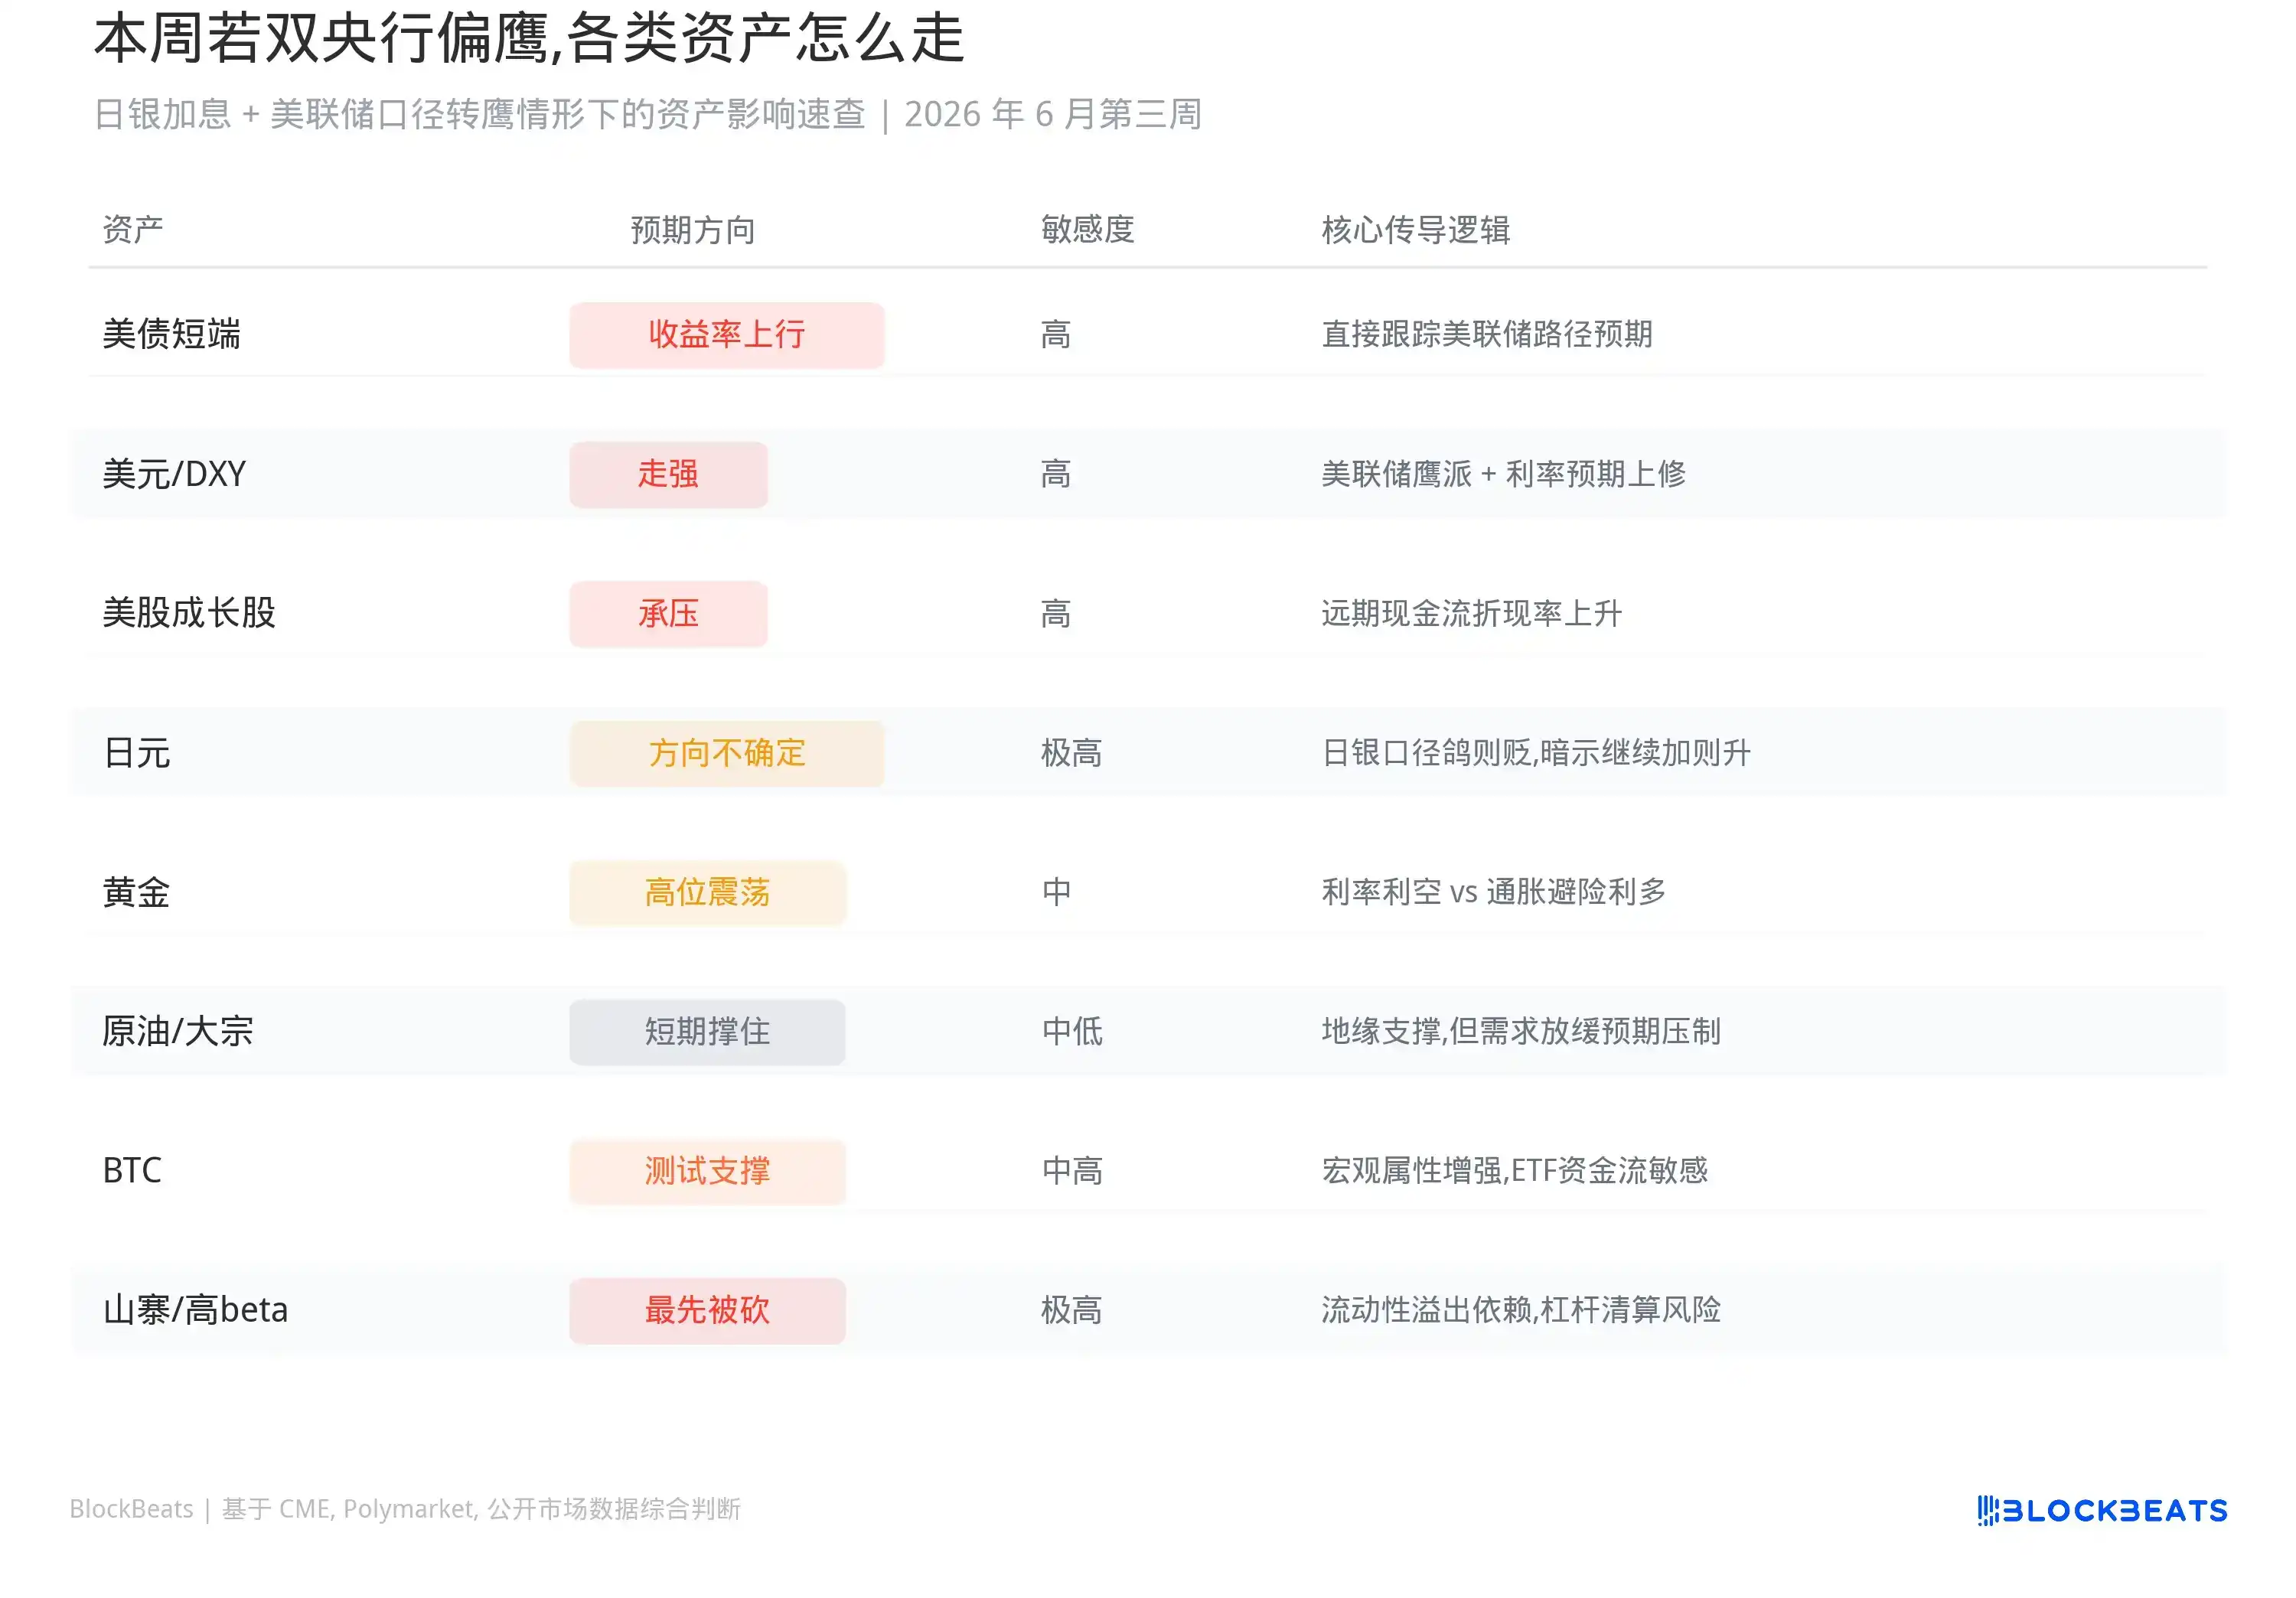
The first to react will be the front end of the US Treasury curve. The 2-year and 1-year yields move directly with the Fed's path. Once the market shifts from 'rate cuts later' to 'possible rate hikes later', short-end yields will rise. The US dollar will also be supported; a strong dollar itself is a form of global tightening.

Within US stocks, high-multiple growth stocks and AI/long-duration assets are most sensitive. Higher rates make future cash flows less valuable in discounted terms, financing more expensive, and the market less willing to pay premiums for unproven stories. The logic for small-caps, micro-caps, and unprofitable tech stocks is even more fragile; these companies thrive on cheap money. Once money isn't cheap, valuations are the first to collapse.

If a true tail risk event occurs—a direct Fed hike amid 98.5% 'no change' pricing—the shock would be severe. Front-end rates would jump, the dollar would surge, leveraged positions would be forced to derisk. It's not saying it will definitely happen, but the meaning of such a low probability is that if it does happen, no one would have time to react.

After all, the market has magnified the importance of Warsh's 'debut' partly because he may change the Fed's communication style. Long-time Fed watchers like Timiraos have clearly articulated the issue: for Warsh, symbolic adjustments like the dot plot, statement wording, and press conference tempo can be made quickly, but truly changing the Fed's communication framework requires long-term persuasion and internal coordination. This week's meeting could be the first step.

Across the Pacific: The 'Curse' of Japan's Rate Hikes

Now, looking at Japan. The BOJ meets June 15-16, with Polymarket pricing a 25bp hike at 98.3%. If implemented, the policy rate would rise from 0.75% to 1%, the highest since 1995.

The logic pushing Japan to this point is straightforward. Middle East conflicts push up oil prices; Japan is a typical energy importer, and a weak yen amplifies import costs. Wages are rising, service prices are rising, inflation expectations are shifting. Maintaining low rates would raise doubts about whether the BOJ still cares about controlling inflation.

The hike itself is no surprise, but a crucial concern is: over the past few years, massive global funds borrowed cheap yen, converted to US dollars or other high-yielding assets, buying US Treasuries, stocks, credit—some indirectly flowing into high-volatility risk assets. This structure is built on one premise: Japanese interest rates are low enough, yen funding is cheap enough, and the central bank is slow enough. In other words, if the market believes Japan's interest rate normalization is continuous, the carry trade becomes fragile, yen shorts get squeezed, and global leveraged funds begin to contract.

The market's fear of a BOJ hike is not unfounded. Over the past two decades, almost every time the BOJ tried to lift rates from near zero, global markets ran into trouble.

The first was August 2000. The BOJ raised rates from zero to 0.25%, coinciding perfectly with the peak of the US dot-com bubble. Within three months of the hike, the Nasdaq fell 35%. Japan's own economy couldn't withstand it, quickly sliding back into recession, forcing the BOJ to cut rates back to zero in 2001.

The second was 2006 to 2007. The BOJ raised rates to 0.5% in two steps: first in July 2006, then in February 2007. The timeline almost perfectly matches the incubation period of the US subprime crisis. In the summer of 2007, US subprime mortgages began to implode; in 2008, Lehman Brothers collapsed, triggering the global financial crisis. The BOJ was forced to cut rates back to zero once again.

The third was July 31, 2024. The BOJ raised rates from 0% to 0.25%, a small move, but the market reaction was extreme. On August 5, the Nikkei 225 plunged 12.4% in a single day, its biggest drop since Black Monday in 1987. South Korea's KOSPI triggered circuit breakers; the Nasdaq and S&P 500 fell 3.4% and 3% respectively. The VIX fear index surged above 65. The transmission mechanism of that crash was clear: the BOJ hike triggered a sharp yen rally, forcing unwinding of carry trades that borrowed yen to buy foreign assets—selling stocks to repay yen, leading to collective selling and a stampede. To meet margin calls, fund managers even sold 'safe-haven assets' like gold and BTC. In the liquidity crisis, correlations among all assets approached 1. I still vividly remember the market carnage that day.

Therefore, what's more important is what signals the Japanese government will provide at tomorrow's press conference: how high will rates ultimately go?

US Stocks, US Treasuries, Bitcoin: Which is Most at Risk This Week?

As mentioned earlier, global markets mostly declined during the BOJ's past three hiking cycles.

But the BOJ hike itself doesn't necessarily crash the market; crashes usually occur when other fragile leverage exists. For instance, 2000 and 2007 coincided with larger bubbles elsewhere. August 2024 was due to a surprise move and overly heavy market positioning leaving no time to react. Subsequent hikes, with preparation, passed without incident.

This time, a 25bp move is priced at 98.3%, leaving almost no room for surprise. Based on the experience of December 2024 and January 2025, the hike itself will likely be digested smoothly. But this time, there are two additional variables.

First, Governor Ueda was hospitalized with an infectious liver cyst and is expected to miss this meeting and the post-meeting press conference. According to public reports, Deputy Governor Himino Ryo will serve as acting chair for the meeting, and Deputy Governor Uchida Shinichi will host the post-meeting press conference. This arrangement is unlikely to change the hiking direction. However, the market is less familiar with Uchida's communication style than Ueda's, potentially amplifying volatility in interpreting his wording. Phrases like 'will judge future moves based on data' versus 'there is still room for normalization' may seem similar but send completely different signals to traders.

Second, the US meets in the same week. The BOJ meeting and the FOMC are only one day apart. If the market reacts mildly to the BOJ hike but Warsh turns hawkish in his press conference the next day, the two layers of pressure could compound. Conversely, if the market is already tense after the BOJ move and Warsh adds fuel to the fire, short-term sentiment could overreact. Having two central banks deliver results back-to-back, this scheduling itself amplifies volatility.

Let's analyze asset by asset:

US Treasuries will likely react first this week. Front-end yields move directly with the Fed's path, with the 2-year and 1-year being most sensitive. If Warsh's press conference is hawkish or the dot plot is revised upward, front-end yields will rise, reflecting the market's repricing of 'later cuts' or even 'a hike this year'. The long end is more complex; the 10-year yield may not rise in sync. If the market begins to worry high rates will hurt the economy, the yield curve could flatten further or deepen its inversion. On the Japan side, if Uchida hints at further hikes, Japanese government bond yields will also be pushed up. Marginal adjustments to Japan's $1.13 trillion US Treasury holdings could, in turn, impact supply and demand in the US Treasury market.

The US dollar will likely find support. A hawkish Fed tilt boosts expectations for US dollar asset yields, strengthening the DXY. A BOJ hike is theoretically positive for the yen and negative for the dollar, but the actual direction depends on the tone: if the BOJ follows the hike with dovish signals, the yen may not rise but could fall, making the dollar index even stronger. With two central banks meeting in the same week, the relative movement of the USD/JPY will be highly sensitive, and forex market volatility will likely increase. Asian and emerging market currencies will face pressure; a strong dollar itself is a form of global tightening, sucking dollar liquidity from abroad.

US stocks will show clear divergence. High-multiple growth stocks, AI/long-duration assets, small-caps, micro-caps, and unprofitable tech stocks are most vulnerable. Higher rates make distant cash flows less valuable, financing more expensive, reducing willingness to pay premiums for unproven stories. The Russell 2000 and companies reliant on cheap money will be the first hit. Bank stocks will have a complex reaction; short-term net interest margins may benefit, but if the curve inverts further and credit risks rise, it may not be positive. Defensive stocks may hold up relatively better, but 'bond-like assets' like utilities and REITs will also see valuation pressure from higher rates. The S&P 500 closed near 7382 last Friday, and the Nikkei 225 was around 66078. If both central banks lean hawkish this week, both US and Japanese stocks will face pressure, especially indices heavy with tech.

Japanese stocks are in a special position. A BOJ hike itself is negative for Japanese exporters, as a stronger yen erodes overseas profits. But if the hike magnitude and pace are within expectations, Japanese stocks may not fall sharply, as shown by the experiences of December 2024 and January 2025. The real risk lies in the post-meeting communication; if Uchida hints at further normalization, the Nikkei may fall first and then reassess.

Gold will be pulled by two forces. Rising real rates and a stronger dollar are typically negative for gold. But if the hikes are driven by energy shocks, geopolitical risks, and runaway inflation, safe-haven demand will support prices. Gold will likely trade in a high range this week, with direction depending on what the market fears more: higher rates or uncontrolled inflation. Crude oil depends more on supply/demand and geopolitics; Iran tensions persist. If hikes are due to oil-driven inflation, oil may not fall immediately. But if the market starts pricing in demand slowdown expectations, industrial metals and oil will face pressure later.

Credit and real estate are slower-moving but the direction is clear. High-yield bond spreads will widen, financing costs will rise, and commercial real estate, REITs, and mortgage-sensitive assets will face pressure. Emerging markets with high US dollar debt will also suffer more, with increased capital outflow pressure.

Crypto markets also face pressure in this macro backdrop. BTC is currently around $65,000. In early June, it was at $72,000, then fell to around $61,500 after the CPI report, rebounding only in recent days. This level is inherently unstable. When it broke below $62,000 on June 5, over $1.5 billion in long positions were liquidated on-chain, and Bitcoin spot ETFs saw $2.7 billion in net outflows over a single week. Although the price has recovered somewhat, the positioning structure is not healthy. BTC has some macro asset attributes; it may not necessarily crash with rising rates, but it's also unlikely to rally independently. ETH, SOL, altcoins, memecoins, and small-cap coins are more vulnerable. These assets feed on liquidity spillovers and risk appetite. Once the market starts comparing the appeal of cash, short-term bonds, and money market fund yields again, high-beta assets are the first to be cut. Contract funding rates have declined, and on-chain risk appetite has cooled, as seen in early June.

Preguntas relacionadas

QBased on the article, why has the market's expectation shifted from anticipating Federal Reserve rate cuts to discussing potential hikes?

AThe shift is due to recent economic data showing renewed inflationary pressure and resilient employment. Specifically, May CPI rose to 4.2% year-over-year with a 0.5% monthly increase, driven partly by a 3.9% rise in energy prices. Core CPI remains around 2.9%. Meanwhile, May non-farm payrolls added 172,000 jobs, and the unemployment rate held at 4.3%. This combination of rising inflation without a significant slowdown in the job market, alongside continued economic resilience from AI-related investments, has weakened the case for rate cuts and made the conditions for potential hikes more plausible.

QWhat is the market consensus regarding the Bank of Japan's upcoming policy decision on June 15-16, and what is a key historical concern about BOJ rate hikes?

AThe market consensus, as indicated by Polymarket prediction markets, is an approximately 98.3% probability of a 25 basis point rate hike by the Bank of Japan (BOJ) in June. A key historical concern is that past BOJ attempts to raise interest rates from near-zero levels have often coincided with or precipitated significant stress in global financial markets, such as the dot-com bubble burst in 2000, the lead-up to the 2008 Global Financial Crisis in 2006-2007, and a major market sell-off in August 2024 triggered by unwinding of yen carry trades.

QAccording to the article, which asset classes within the US stock market are most vulnerable if the Federal Reserve adopts a more hawkish tone?

AWithin the US stock market, the most vulnerable assets to a more hawkish Fed are high-valuation growth stocks, AI-related long-duration assets, small-cap and micro-cap stocks, and unprofitable tech companies. These assets are sensitive to higher interest rates because their valuations depend heavily on discounting future cash flows, which become less valuable when rates rise. They also rely on cheap financing, which becomes more expensive in a tightening environment.

QHow does the article describe the potential impact of simultaneous policy meetings by the BOJ and the Fed in the same week?

AThe article states that having the BOJ and Fed policy meetings back-to-back in the same week amplifies market volatility. The outcomes and communication tones from the two central banks can create叠加压力 (superimposed pressure) or lead to an overreaction in short-term market sentiment. For instance, a mild reaction to a BOJ hike could be followed by heightened紧张 (tension) if Fed Chair Walsh strikes a hawkish tone the next day, or vice-versa. This scheduling本身 (itself) increases波动性 (volatility), particularly in currency markets (USD/JPY) and short-term interest rates.

QWhat are the two conflicting forces that will influence the price of gold this week, as explained in the article?

AGold will be pulled by two conflicting forces: 1) Upward pressure on real interest rates and a stronger US dollar, which are typically negative for gold prices. 2) Safe-haven demand, which could support gold if the reason for potential rate hikes is perceived to be energy shocks, geopolitical risks, and失控的通胀 (runaway inflation). The direction of gold will depend on which fear dominates the market: fear of rising rates or fear that inflation cannot be controlled.

Lecturas Relacionadas

The Foundation of SpaceX's Trillion-Dollar Valuation: Who is Dividing Up Musk's Annual Tens of Billions in Capital Expenditure?

SpaceX's trillion-dollar valuation is built on its three core businesses: Starlink (profitable, 60% of revenue), rockets (driving down launch costs), and AI (a major investment area). This creates a financial cycle: Starlink funds rocket development, which enables low-cost launches for AI hardware, generating future revenue. This cycle fuels annual capital expenditures of tens of billions, flowing to a vast supply chain. Suppliers are categorized by their replaceability. The first group includes irreplaceable players like NVIDIA (GPU/CUDA ecosystem), Eutelsat (critical radio spectrum), Filtronic (specialized amplifiers), Materion (strategic beryllium), and STMicroelectronics (antenna chips). The second group consists of hard-to-replace suppliers due to high switching costs, such as Honeywell (flight control), Carpenter Technology (specialty alloys), Hexcel (carbon fiber), Broadcom (data exchange), and Linde (industrial gases). The third group comprises high-volume, cost-critical suppliers for mass-produced items like Starlink terminals. Key names include Wistron NeWeb (primary manufacturer) and several A-share companies like Shenzhen Sunway (connectors), Pies New Materials (forgings), Western Superconducting (alloys), and Yingliu (castings). Other niche players include Trimble (timing), Astronics (power distribution), and CTS (thermal management). The article argues that investing in these suppliers, rather than SpaceX stock directly, offers an alternative opportunity. The rationale is threefold: procurement is just beginning to scale, SpaceX's IPO brings new transparency to its supply chain, and the situation mirrors early stages of past "super terminal" ecosystems like Apple or Tesla. While risks exist (commodity cycles, geopolitical factors, technology shifts), the core thesis is that SpaceX's massive, ongoing procurement will translate into reliable revenue for its key suppliers, regardless of its own stock price volatility.

marsbitHace 9 min(s)

The Foundation of SpaceX's Trillion-Dollar Valuation: Who is Dividing Up Musk's Annual Tens of Billions in Capital Expenditure?

marsbitHace 9 min(s)

SpaceX's Trillion-Dollar Valuation Base: Who's Sharing in Musk's Annual Tens of Billions in Capital Expenditure?

**Title: The Foundation of SpaceX's Trillion-Dollar Valuation: Who Benefits from Musk's Annual $100 Billion Capital Expenditure?** This article argues that investors seeking to benefit from SpaceX's growth might find greater opportunities in its supply chain rather than directly investing in the company itself, drawing parallels to historical successes with Apple, Tesla, and NVIDIA suppliers. **SpaceX's Business Model & Cash Flow:** SpaceX generates revenue from three main areas: 1. **Starlink:** Its profitable core, earning $11.3B in 2023 (60% of revenue), funding other ventures. 2. **Rockets (Falcon/Starship):** Requires $3B+ in annual R&D but achieves the world's lowest launch costs. 3. **AI:** Currently unprofitable (-$6B+ in 2023), investing heavily in ground-based supercomputers (220,000 GPUs) and future orbital data centers. The cycle is: Starlink profits → fund cheaper rockets → low-cost launches deploy AI hardware → AI compute rentals generate future revenue. This cycle drives annual procurement spending of tens of billions of dollars. **The Supply Chain Beneficiaries:** Suppliers are categorized by their replaceability: **1. Nearly Irreplaceable (High Barriers to Entry):** * **NVIDIA:** Powers the Colossus supercomputer; its CUDA ecosystem creates immense switching costs. * **Eutelsat (SATS):** Controls critical radio spectrum for satellite communications; holds a ~3% stake in SpaceX. * **Filtronic (FTC):** Supplies millimeter-wave signal amplifiers for Starlink satellites; SpaceX constitutes 83% of its revenue. * **Materion (MTRN):** Global leader in beryllium production, a strategic material used in Starship structures. * **STMicroelectronics (STM):** Supplies phased-array antenna chips for Starlink satellites. **2. Replaceable, but Switching Cost is Prohibitively High:** * **Honeywell (HON):** Provides flight control and inertial navigation systems with decades of certification. * **Carpenter Technology (CRS):** Manufactures ultra-pure specialty steel alloys for Raptor engines. * **Hexcel (HXL):** Supplies custom carbon fiber composites developed over a decade with SpaceX. * **Broadcom (AVGO):** Manages high-speed data switching. * **Linde Group:** Supplies industrial gases (liquid oxygen/nitrogen) from facilities built near SpaceX launch sites. **3. High-Volume, Cost-Critical Manufacturing:** Focuses on mass-producing components like Starlink user terminals (target: 30 million units). * **Key Players:** Wistron NeWeb (6285, primary terminal manufacturer), several Chinese A-share companies (e.g., Sunway Communication, PAX New Materials, Western Metal Materials, Yingliu Co.), and smaller US firms like Trimble (TRMB, timing systems). **Why Now?** Three factors make the supply chain opportunity timely: 1. **Volume Ramp-Up:** SpaceX plans 100 launches in 2026, aims for 30 million Starlink terminals, and will deploy AI data centers, meaning procurement will accelerate. 2. **Increased Transparency:** The IPO provides public financial data, allowing investors to track supplier order growth. 3. **Historical Precedent:** The current phase is likened to Tesla's early mass-production stage (circa 2018), suggesting a long growth runway for suppliers. **Conclusion:** The article posits that while investing in SpaceX stock is betting on Elon Musk's ambitious vision at a high valuation, investing in its established suppliers is a bet on the tangible, recurring revenue from its massive procurement budget, which is largely decoupled from day-to-day stock price volatility.

链捕手Hace 13 min(s)

SpaceX's Trillion-Dollar Valuation Base: Who's Sharing in Musk's Annual Tens of Billions in Capital Expenditure?

链捕手Hace 13 min(s)

The U.S. Government Blocked the Anthropic Model. It Wasn't About 'Jailbreaking' at All.

Last Friday, the U.S. Commerce Department issued an enforcement letter that forced Anthropic to take its two most advanced AI models, Fable 5 and Mythos 5, offline. The stated reason was unspecified national security concerns, initially linked to potential "jailbreaks" of the models' safeguards. However, new details suggest the action stemmed more from a deteriorating relationship between the Trump administration and Anthropic, rather than a genuine technical threat. According to reports, the government cited a little-known export control regulation, compelling Anthropic to block access for all non-U.S. persons, including its own international employees. The company complied, shutting down the models without a court order or specific technical details from the government. Cybersecurity expert Katie Moussouris revealed she was privately shown a research paper detailing a potential safeguard bypass in Fable 5. She argued the described method was minor and did not warrant an export ban, stating that attempts to "fix" it would only weaken the model's defensive capabilities. Moussouris and other experts have since called for the order to be revoked, warning it dangerously removes advanced cybersecurity tools from U.S. defenders. Analysts like Justin Hendrix suggest the move appears retaliatory and sets a dangerous precedent, signaling that the U.S. government can unilaterally shut down a tech company's products. The incident has raised concerns about the reliability of American AI and the potential for political interference in the tech industry, serving as a warning to the broader sector.

marsbitHace 16 min(s)

The U.S. Government Blocked the Anthropic Model. It Wasn't About 'Jailbreaking' at All.

marsbitHace 16 min(s)

Ray Dalio: AI Bull Market Continues to Soar, Should Investors Go All In or Cash Out and Leave the Field?

In his latest notes, Ray Dalio addresses a critical question for investors amid the AI-driven stock market surge: how should one allocate assets during a transformative technological revolution? Dalio emphasizes that technological advancement does not automatically make related stocks attractive. Historical tech cycles—marked by excitement, crowding, volatility, and eventual shakeouts—show that even long-term winners like Microsoft and Apple experienced severe drawdowns. Today's AI sector faces similar uncertainties: overinvestment, intensifying competition, geopolitical tensions (e.g., Taiwan's chip supply), tax policy shifts, anti-AI sentiment, and potential disruption from future technologies like quantum computing. Dalio's core argument focuses on the highly concentrated market structure, where a few tech giants dominate major indices. He warns investors against unknowingly holding concentrated, correlated exposures. Instead of chasing a handful of AI leaders, he advocates for a robust, diversified portfolio of 15 or more high-quality, uncorrelated investments, risk-balanced to match an investor's volatility tolerance. Mathematically, such diversification significantly improves the risk-return ratio—for example, holding 15 uncorrelated assets can boost the ratio by over four times compared to a single concentrated bet. Dalio cautions that future equity returns appear low, with his bubble indicator suggesting real returns could be negative over the next 5-10 years. He stresses that knowing what you don't know is as important as knowing what you do. In an environment of high uncertainty and concentration, avoiding large, concentrated bets on AI stocks is prudent. The optimal strategy is disciplined diversification—the "holy grail" of investing—to navigate this technologically driven cycle with lower risk and comparable or better returns.

marsbitHace 20 min(s)

Ray Dalio: AI Bull Market Continues to Soar, Should Investors Go All In or Cash Out and Leave the Field?

marsbitHace 20 min(s)

Trading

Spot
Futuros
活动图片