An AI Version of the 'Subprime Crisis'? A Hidden Debt of $1.8 Trillion is Accumulating in the Shadows Amid the Frenzy

marsbitPublicado a 2026-06-15Actualizado a 2026-06-15

Resumen

Amidst the AI infrastructure construction boom, a massive debt expansion is forming, with the most dangerous portion remaining off-balance sheets. Morgan Stanley research reveals approximately $1.8 trillion in off-balance-sheet exposures, including nearly $1 trillion in purchase commitments and over $800 billion in non-active lease contracts. These future cash outflows are not recorded as liabilities. The leverage of hyperscale cloud companies has surged from 0.9x to 1.8x in just two quarters. Private credit firms like Apollo and Blackstone are shifting leverage into the supply chain through complex, opaque SPV (Special Purpose Vehicle) financing structures. Global AI-related bond issuance has skyrocketed, with annual volume projected to exceed $570 billion. However, capital expenditure growth is outpacing revenue and free cash flow. Major cloud providers may see free cash flow approach zero or turn negative in 2026. A significant 'depreciation cliff' looms as vast amounts of current capital spending, recorded as 'construction in progress,' have yet to begin depreciating, artificially inflating current profit margins. Future depreciation could severely pressure earnings. The core risk is identified as a series of timing mismatches, not an immediate solvency crisis. Investment is racing ahead of monetization, leverage is being obscured, and accounting classifications hinder comparability. The entire financing structure faces a fundamental stress test if AI commercialization ...

Amid the frenzy of AI infrastructure construction, an unprecedented debt expansion is quietly taking shape—with its most dangerous portion never appearing on any balance sheet.

Goldman Sachs's latest report predicts that capital expenditures for hyperscale cloud companies will reach $1.1 trillion to $1.4 trillion by 2027, far exceeding market consensus. However, according to an in-depth study by Morgan Stanley, this already staggering figure is just the tip of the iceberg.
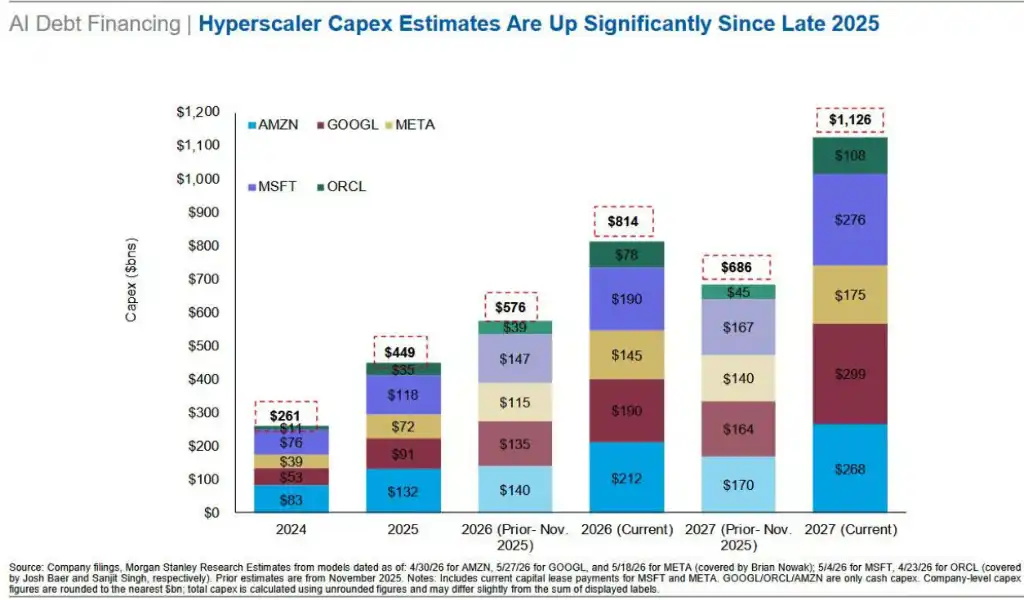
Nearly $1 trillion in purchase commitments, over $800 billion in unactivated lease contracts, and tens of billions of dollars in supplier financing arrangements collectively constitute an off-balance-sheet exposure of approximately $1.8 trillion—these liabilities exist outside the balance sheet but genuinely lock in future cash outflows.

The market has not yet fully priced in these risks.

Morgan Stanley warns that the leverage ratio of hyperscale cloud companies has surged from 0.9x to 1.8x in just two quarters, with capital expenditure growth continuing to outpace revenue and free cash flow growth, while the real impact of depreciation pressure has yet to arrive.

Meanwhile, private credit firms represented by Apollo and Blackstone are transferring leverage to the supply chain level through SPVs (Special Purpose Vehicles), creating a highly circular and difficult-to-penetrate financing structure. If AI commercialization falls short of expectations or enterprise customers shift en masse to cheaper alternatives, the fragility of the entire financing chain will be exposed.

Debt Issuance Frenzy: AI Has Become the Biggest Variable in Public Markets

According to Morgan Stanley's latest "AI Debt Financing Tracker Report," as of the end of May 2026, the scale of global AI-related bond issuance has reached $236 billion, a surge of 357% compared to the same period in 2025.

Morgan Stanley expects the total issuance of AI debt to exceed $570 billion for the full year, with the pace accelerating further in the second half of the year as capital expenditure financing needs are concentrated.
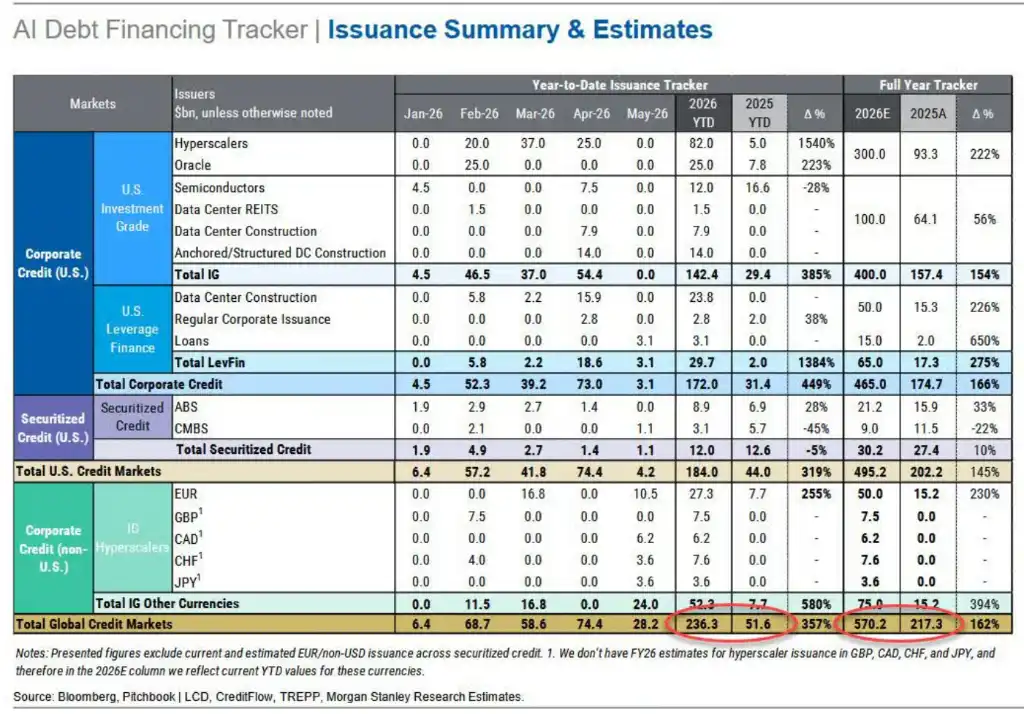
In April alone, AI-related bond issuance exceeded $74 billion, hitting a new high for the year, with project financing structures (for data center construction) accounting for 85% of high-yield bond supply and 40% of investment-grade bond supply. Meanwhile, the five hyperscale cloud companies—Amazon, Meta, Google, Microsoft, and Oracle—now account for 4% of the entire investment-grade bond index.

In terms of leverage, the gross leverage ratio for hyperscale cloud companies has risen from 0.9x in the third quarter of 2025 to the current 1.8x, increasing by approximately 0.3x per quarter, already surpassing the leverage level of the entire energy industry.
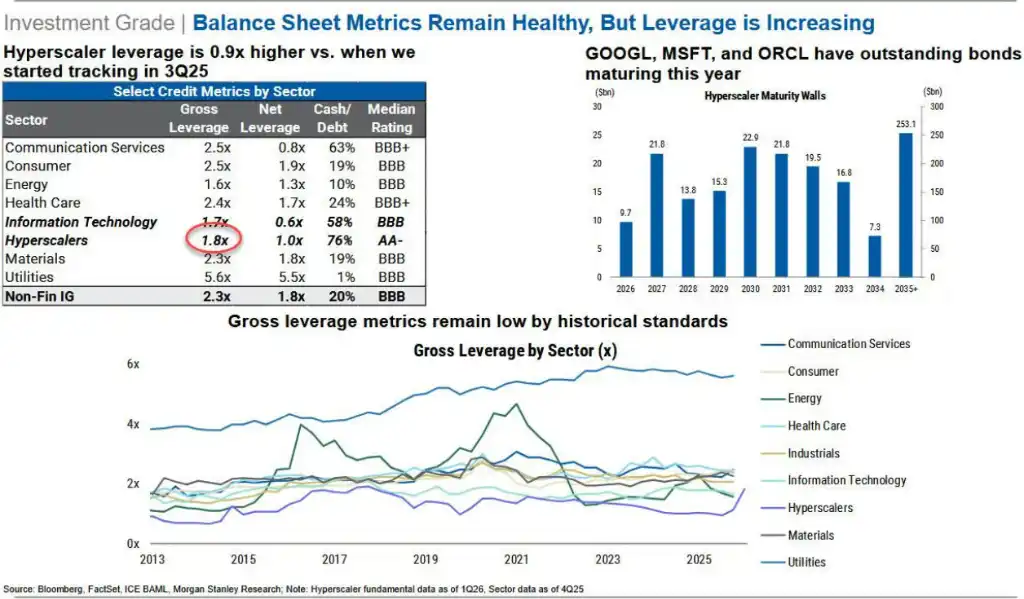
Morgan Stanley points out that, affected by supply pressure, related credit spreads have drifted from the AA range to the A range and may widen further. Meta's credit spread is currently wider than the CDX IG benchmark.

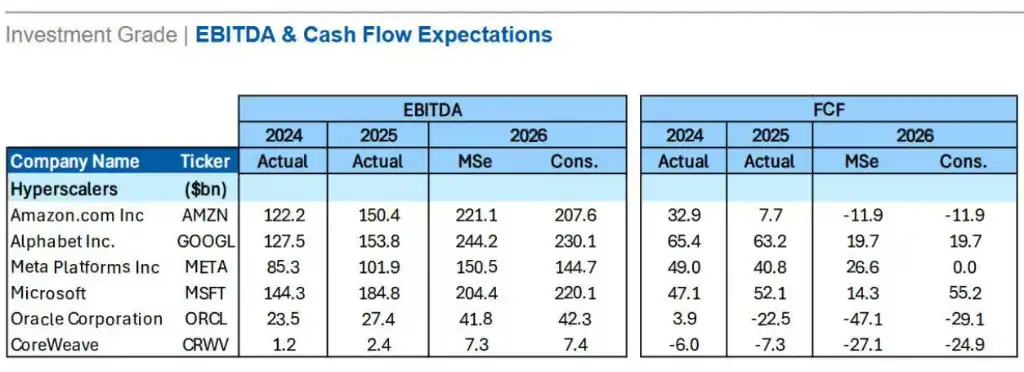
Regarding free cash flow, Morgan Stanley predicts that Amazon and Meta's free cash flow in 2026 will approach zero or even turn negative, at which point incremental financing will almost entirely rely on new debt.
$1.8 Trillion Off-Balance-Sheet Exposure: Invisible Liabilities, Locked-in Cash Outflows

Todd Castagno from Morgan Stanley's Global Valuation, Accounting & Tax team notes in the report that focusing solely on capital expenditure numbers would severely underestimate the true financial commitments of the AI construction cycle. Beyond the disclosed capital expenditures, there are three key types of off-balance-sheet exposure:

Purchase commitments of approximately $982 billion. The total value of long-term purchase contracts by hyperscale cloud companies and Nvidia is close to $1 trillion. Under accounting standards, these obligations are not recorded as liabilities until goods are delivered, unless the company expects a contract loss. Therefore, nearly $1 trillion in future cash outflows currently do not appear as liabilities on any balance sheet.

Notably, Nvidia's own inventory and purchase obligations have risen to about 32% of consensus revenue forecasts for fiscal year 2027, far above the historical range of 15% to 20%, indicating that supply chain commitment risks are extending to chip suppliers.

Unactivated lease commitments of approximately $822 billion. Over $800 billion in lease contracts have been signed but not yet activated and are not included in current lease liabilities. Additionally, arrangements such as variable lease payments, renewal options, and residual value guarantees also exist outside the balance sheet.
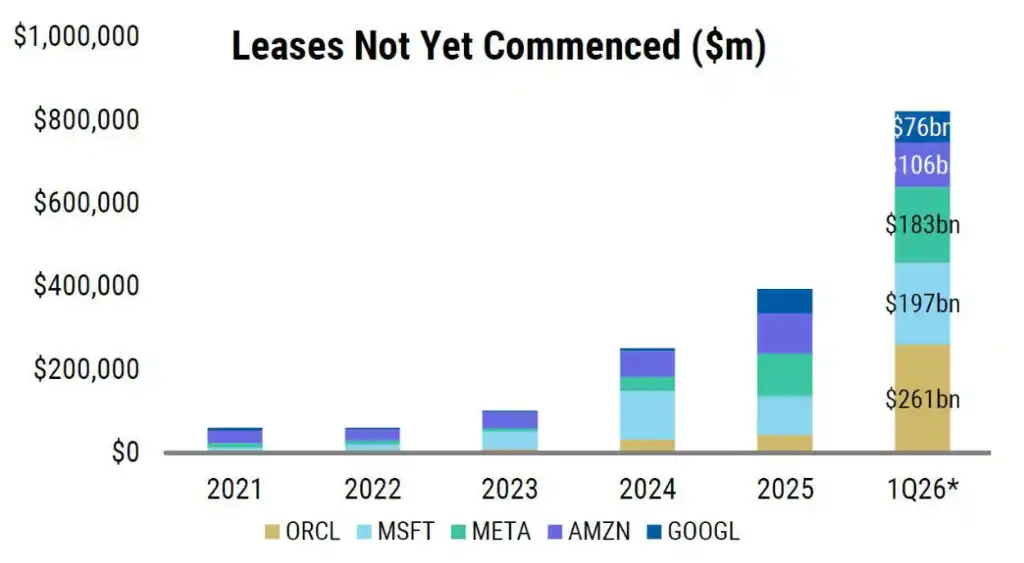
Morgan Stanley estimates that if finance leases were included in the calculation, Microsoft's capital expenditure-to-sales ratio would jump from 33%/50% (fiscal 2026/2027) to 44%/64%, while Oracle's could rise from 76%/115% to 101%/189%.

Unpaid capital expenditures in accounts payable of approximately $110 billion. The days payable outstanding (DPO) of hyperscale cloud companies have significantly lengthened—Oracle's increased by 370% year-on-year, Meta's by 73%, Microsoft's by 69%—meaning the entire supply chain is effectively financing AI construction, with suppliers bearing the liquidity pressure that should be carried by the buyers.

SPVs and Circular Financing: Leverage Moves to the Shadows

Another core dimension of off-balance-sheet risk is the circular financing structure built through SPVs.

A $35 billion "chip-collateralized" private credit deal completed this week by Apollo and Blackstone for Anthropic vividly illustrates the logic of this model:

Broadcom provides backing for this SPV; Anthropic uses the raised funds to purchase Google chips manufactured by Broadcom, with Google holding a 14% stake in Anthropic; Morgan Stanley, which arranged the deal, simultaneously provides loans to the investors participating in the transaction.

Morgan Stanley's AI ecosystem financing correlation map shows multiple circular relationships—customer, investor, supplier financing, and repurchase—among OpenAI, Oracle, Nvidia, Microsoft, CoreWeave, AMD, and Amazon. The same funds circulate repeatedly among a few key entities, with SPVs being the core tool enabling this circulation.
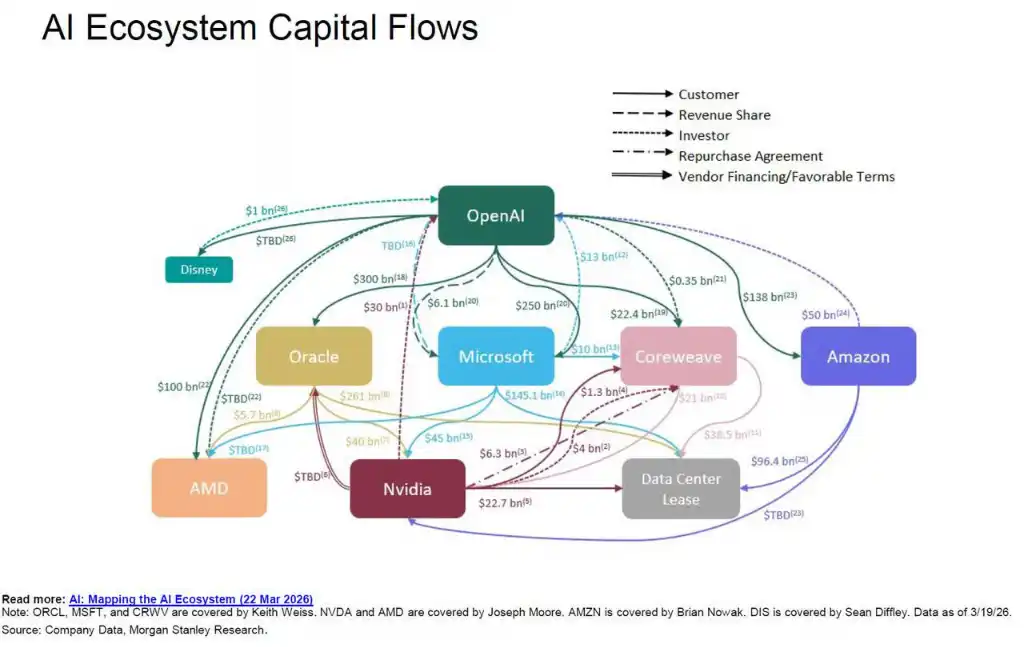
It is reported that Athene, the insurance subsidiary of Apollo, is particularly active in this structure—raising funds by selling annuities to retirees and then injecting the capital into SPVs to participate in AI infrastructure financing.

This model shifts leverage from the visible balance sheets of hyperscale cloud companies to suppliers and the private credit ecosystem, making the true systemic risk exposure difficult for external observers to identify and aggregate.

Depreciation Cliff and Monetization Gap: The Delayed Shock

Current financial data exhibits systematic optimism bias. A large amount of capital expenditure is currently booked as "construction in progress" (CIP) and has not yet begun to depreciate, artificially inflating reported profit margins and underestimating future expense pressure.

The CIP balances of Oracle, Meta, and Google have grown by approximately 200%, 90%, and 55% year-on-year, respectively.
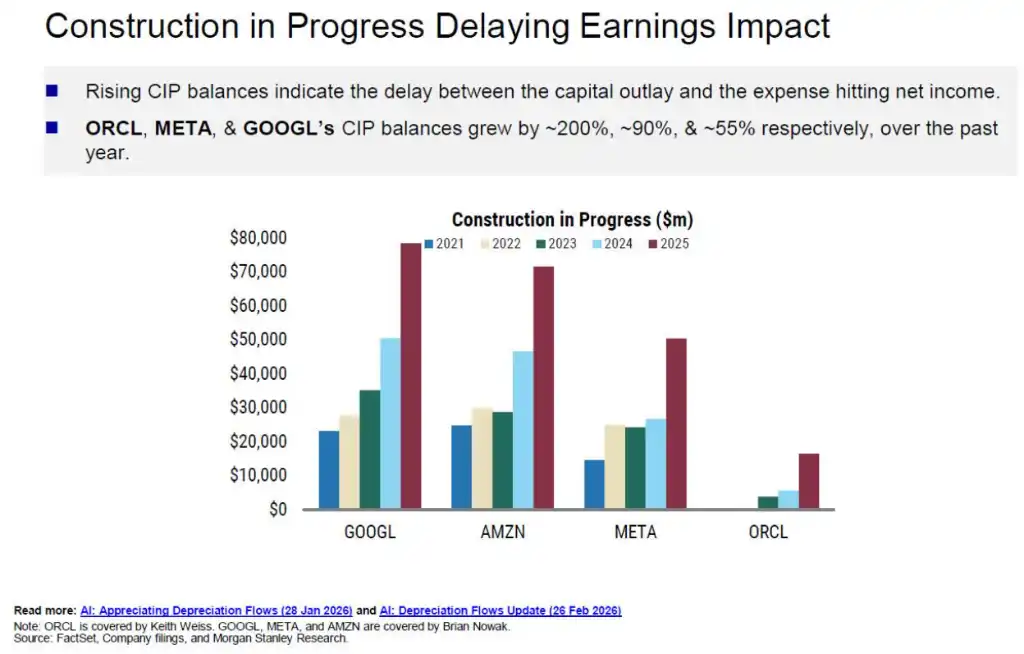
Once these assets gradually transition to depreciation, the impact will be concentrated.

Morgan Stanley predicts that the cumulative depreciation for Microsoft, Oracle, Meta, and Google over the next three years will exceed $520 billion. Taking Oracle as an example, depreciation as a percentage of revenue could rise from the current 7% to 28% in fiscal year 2028; Meta's could rise from 9% to 19%.

In this context, the only path to maintaining profit margins is for revenue to grow significantly in sync—yet the upward revisions to revenue forecasts currently lag far behind the upward revisions to capital expenditure forecasts.

Data shows that consensus capital expenditure forecasts for Google for 2026 have been raised by 139% compared to a year ago, while Meta's and Amazon's were raised by 85% and 81%, respectively. Oracle saw the largest increase, at 175%.

Meanwhile, revisions to revenue forecasts are noticeably lagging, revealing a clear structural mismatch where capital expenditure is outpacing commercialization.

Furthermore, over $2 trillion in remaining performance obligations (RPO) is highly concentrated in a few large, long-term contracts, presenting significant counterparty concentration risk—if any major participant in this circular system encounters problems, it could trigger a chain reaction.

Timing Mismatch Rather Than an Immediate Solvency Crisis

Morgan Stanley concludes that these risks do not currently constitute an imminent solvency crisis but rather a series of overlapping timing mismatches and information disclosure gaps: depreciation pressure is deferred, capital expenditure outpaces monetization, leverage shifts to suppliers and the private credit layer, and the comparability of capital intensity between different companies is significantly undermined by accounting classification differences.

Hyperscale cloud companies are clearly aware of the limited window of current market sentiment and are seizing the opportunity to maximize financing scale.

Goldman Sachs analyst Ryan Hammond points out that if AI infrastructure investment scales to 2% to 3% of GDP, analogous to historical construction cycles of railways and the automotive industry, capital expenditures could reach $1.1 trillion by 2027. In an extreme scenario, considering the cash flow of hyperscale cloud companies and the capacity of the investment-grade credit market, the upper limit might reach $1.4 trillion.

However, all of this hinges on the ability of large language models (LLMs) to continue increasing token pricing and maintain sufficient enterprise customer stickiness. A growing number of enterprises are turning their attention to AI products with comparable performance but significantly lower prices.

Should a structural shift occur on the demand side, the meticulously constructed financing system of today will face a fundamental stress test.


Preguntas relacionadas

QWhat is the estimated scale of the off-balance-sheet exposure that is building up in the AI infrastructure boom, according to the article?

AThe total off-balance-sheet exposure is approximately $1.8 trillion, comprising nearly $1 trillion in purchase commitments, over $800 billion in non-activated lease contracts, and over $100 billion in supplier financing arrangements.

QHow has the leverage ratio of hyper-scale cloud companies changed recently, and what is it compared to?

AThe gross leverage ratio of hyper-scale cloud companies has surged from 0.9x in Q3 2025 to the current 1.8x, increasing by approximately 0.3x per quarter. This level has already exceeded the leverage of the entire energy sector.

QWhat are the three main types of off-balance-sheet commitments identified in the Morgan Stanley report?

AThe three main types are: 1) Purchase commitments of approximately $982 billion, 2) Non-activated lease commitments of about $822 billion, and 3) Unpaid capital expenditures within accounts payable, estimated at $110 billion.

QWhat is the core mechanism described for shifting leverage into the shadows of the AI ecosystem?

AThe core mechanism is the use of Special Purpose Vehicles (SPVs) to build circular financing structures. This transfers leverage from the visible balance sheets of hyper-scale cloud companies to suppliers and the private credit ecosystem, making systemic risk exposure difficult to observe.

QWhat is the primary nature of the financial risk highlighted by Morgan Stanley regarding the AI investment cycle?

AThe primary risk is not an imminent solvency crisis, but a series of timing mismatches and information gaps. These include deferred depreciation pressure, capital expenditures outpacing monetization progress, leverage shifting to suppliers and private credit, and a lack of comparability in capital intensity due to accounting differences.

Lecturas Relacionadas

From Gold to Bitcoin: Fixed Supply + Institutional Frenzy, Might It Repeat the 'Explosive' Price Trend?

"From Gold to Bitcoin: Fixed Supply and Institutional Frenzy May Lead to 'Explosive' Price Rally Analysts suggest Bitcoin's price action could mirror gold's over the past two decades, following the launch of spot Bitcoin ETFs. Gold ETFs, introduced in 2004, drove gold's price surge to a current market cap near $28 trillion. Both gold and Bitcoin are non-yielding stores of value, with prices driven purely by investor sentiment rather than cash flows or credit. Gold ETFs experienced dramatic cycles: explosive growth, painful drawdowns, and slow recoveries, with each cycle reaching higher peaks. Bitcoin ETFs, approved in early 2024, saw rapid institutional adoption but are now facing similar volatility. Recent warnings highlight the risk of significant ETF outflows disrupting the current rebound. BlackRock's IBIT, a leading Bitcoin ETF, has sold nearly 100,000 BTC to meet redemptions while still holding over 733,000. The core parallel is fixed supply: when demand surges, prices explode, but demand is often volatile and wave-like, not steady. Institutional interest, through ETFs and corporate adoption, remains a key support pillar, helping to cushion sell-offs. If Bitcoin captures even a fraction of gold's role as a store of value, its upside potential is immense, though the path will be marked by high volatility. For investors, focusing on long-term trends and managing risk is crucial as this 'price explosion' narrative unfolds."

Foresight NewsHace 2 min(s)

From Gold to Bitcoin: Fixed Supply + Institutional Frenzy, Might It Repeat the 'Explosive' Price Trend?

Foresight NewsHace 2 min(s)

Why Is AI Agent Shopping Hard to Popularize?

The article argues that the popular narrative of "AI agent shopping" – equipping AI with a wallet to autonomously handle purchases – is fundamentally flawed and oversimplifies the complexity of shopping. It deconstructs shopping into two core actions: **information retrieval** (standardized, easily automated) and **value judgment** (deeply subjective and human-centric). The narrative mistakenly assumes AI can fully handle both. Value judgment itself has two layers: **evaluation** (assessing options against criteria) and **demand definition** (setting the criteria, weights, and values). The latter is inherently human and dynamic, as preferences are not fixed but constructed during the decision-making process ("constructive preferences"). The real dividing line for automation is not product standardization, but whether the **act of choosing** itself holds experiential value. For mundane purchases (e.g., printer paper), full AI delegation works. For experiential goods (e.g., wine, furniture), the joy of selection is core to consumption, so AI should act as an assistant that narrows options, leaving the final choice to humans. The "AI wallet" concept confuses three separate elements: decision-making, execution, and fund custody. Current payment industry solutions (e.g., from Stripe, Mastercard, Google, Visa) show that limited, scoped payment authorization tokens are sufficient for most consumer scenarios, not full fund custody. The true use case for autonomous AI wallets is in **B2B procurement** and **machine-to-machine (M2M) settlements** for standardized, high-frequency, low-value transactions. The real bottlenecks for AI shopping are not payment technology, but **1) the lack of trusted data sources** (e.g., fake reviews, counterfeit goods) and **2) the impossibility of automating human demand definition**. The conclusion is that the focus should be on safely automating the assessment and filtering process while reserving for humans the rights to define their criteria and enjoy the final act of choice. For experiential goods, the platform's competitive advantage shifts to providing a superior selection experience.

Foresight NewsHace 1 hora(s)

Why Is AI Agent Shopping Hard to Popularize?

Foresight NewsHace 1 hora(s)

After Nine Months of Shorting, a Full Turn to Long: Renowned Trader Opens Bitcoin Positions Around 64K, Crypto Market Long-Short Divergence Intensifies

After nine months of being short, prominent crypto trader Doctor Profit has closed all his bearish positions and started buying Bitcoin near $64,000, signaling a complete bullish reversal. He argues that structural market changes—such as impending U.S. regulation (CLARITY Act) and institutional adoption via securities tokenization—are rewriting the traditional four-year cycle script, potentially bringing the market bottom forward from the widely expected September/October timeframe. This view finds some technical support from on-chain analyst gumsays, who notes a bullish divergence on Bitcoin's weekly chart has persisted for 147 days, nearing the 161-day duration seen before the 2022 cycle low. However, cycle researcher Jake Pahor presents a counter-argument based on historical data. Analyzing patterns since 2014, he identifies three common features of past bear market bottoms: a ~12-month duration from peak to trough, a sustained period of extreme fear (with a proprietary risk score below 20), and the price falling below Bitcoin's realized price (~$53,000 currently). The current cycle, only nine months from its October 2025 peak, meets none of these conditions. The debate highlights a market torn between "front-running" a potential early bottom driven by new fundamentals and waiting for confirmation through traditional on-chain and sentiment metrics. While Doctor Profit opts for aggressive buying, Pahor maintains a disciplined, tiered accumulation strategy, continuing weekly buys at current risk levels but reserving larger orders for if more extreme fear emerges.

marsbitHace 1 hora(s)

After Nine Months of Shorting, a Full Turn to Long: Renowned Trader Opens Bitcoin Positions Around 64K, Crypto Market Long-Short Divergence Intensifies

marsbitHace 1 hora(s)

Senior Trader's Confession: How to Trade Market's False Expectations?

Veteran trader's case study: trading the market's "wrong expectations". This trade centered on a textbook "expectation error" after a weak CPI report. While the market initially priced in broad monetary easing (sending Nasdaq to 30,060), the crucial 30-year real yield hit a 20-year high. This signaled a fractured transmission mechanism: short-term rates eased, but long-term funding costs (vital for tech valuations) refused to fall. The trader executed five short positions on the Nasdaq (NQ) as it fell from 30,060 to 28,768. The core methodology: don't just trade the data, but analyze the market's implied causal chain and identify where it breaks. In this case, the chain was: Weak CPI → Policy Easing → Lower Long-Term Funding Costs → NQ Valuation Expansion. The break occurred between policy easing and long-term rates. The "veto variable" – long-term real yields – refused to confirm the bullish narrative. Trades were structured around "fast variables" (price) temporarily repairing while "slow variables" (funding conditions) remained broken. The article outlines a repeatable framework: 1) Map the market's implied causal chain. 2) Identify the veto variable. 3) Observe if it rejects the narrative. 4) Enter when price still follows the old script. 5) Choose the cleanest asset expression (e.g., short NQ, not broad S&P). 6) Define both invalidation and fulfillment exit conditions. The key insight: Alpha often comes not from an information edge, but from a "reaction function edge" – recognizing when the market is applying an outdated causal logic to new data. The critical question: What causal chain is the market's first reaction relying on, and is that chain still valid today?

marsbitHace 1 hora(s)

Senior Trader's Confession: How to Trade Market's False Expectations?

marsbitHace 1 hora(s)

Trading

Spot
活动图片