After Analyzing 231 Prediction Markets, We Uncovered the Harsh Truth About ICOs

比推Publicado a 2026-01-29Actualizado a 2026-01-29

Resumen

Analyzing 231 prediction markets on Polymarket for 29 token launches reveals that these markets are not reliable predictive tools but rather contrarian indicators of market sentiment. Despite claims of near-perfect accuracy, the true predictive accuracy one week before market close is only 66.7%, with systematic over-optimism bias. Markets consistently overestimated fundraising amounts and valuations, with FDV predictions averaging a +35% overestimation. High trading volume on Polymarket (>$50M) is a strong bearish signal, often correlating with significant post-ICO price declines. In contrast, conservative predictions and lower trading volume (<$5M) are relatively bullish signals, though most tokens still underperform. Overall, 75% of tokens fell in the first 24 hours, and the average return since ICO is -32.2%, indicating that extreme optimism in prediction markets often precedes poor performance.

Source: LEGION (@legiondotcc)

Original Title: What prediction markets reveal about ICOs

Compiled and Edited by: BitpushNews


Prediction Markets in the Token World

Polymarket's token launch prediction markets have cumulatively processed nearly $2.5 billion in trading volume, with the platform claiming an astonishing prediction accuracy rate—100% for fundraising size predictions and over 90% for valuation predictions. However, in-depth analysis reveals that these figures are severely misleading: the true market signal lies not in "what was predicted correctly" but in "how much was predicted incorrectly."

By analyzing data from 231 prediction markets across 29 token launch events and comparing it with actual token performance from CoinGecko, we found that these markets are not reliable prediction tools but rather contrarian indicators reflecting market sentiment.

Key Findings:

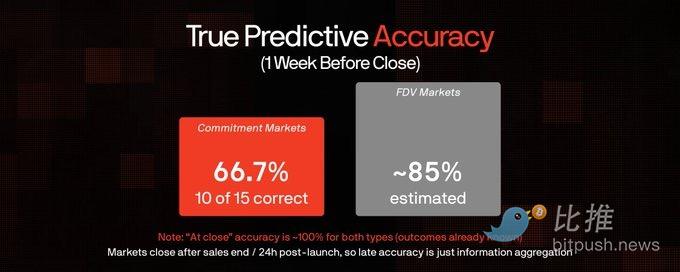
One week before the prediction markets closed, the true prediction accuracy rate was only 66.7%. At critical moments, the crowd was wrong one out of every three times, and the errors systematically showed excessive optimism.

24-Hour Volatility Issue: Using CoinGecko's hourly data, we found that PM's "FDV exceeding X 24 hours after listing" markets were betting on extreme volatility.

Average 24-hour change: ±23% | Best Case: Monad +54.8% | Worst Case: Trove -38.7%.

75% of tokens saw their prices drop within the first 24 hours of listing. PM's 24-hour FDV prediction accuracy rate: only 62.5%.

The Fallacy of Accuracy

When we track how market probabilities change over time, rather than just looking at the final outcome, a different picture emerges. The promise markets appear "100% accurate" because the final data leaks as the sale progresses. Insiders and observers update prices accordingly; this is merely price discovery after the fact.

Key Finding:

Both promise markets and FDV markets tend to approach ~100% accuracy at closing because they settle after the outcome is known. Promise markets close after the sale ends; FDV markets close after the 24-hour post-listing period ends. The only meaningful predictive metric is the accuracy rate one week before closing, when genuine uncertainty still exists. The 66.7% promise accuracy rate indicates that, at critical moments, the market was wrong one-third of the time.

Where User Judgment Went Wrong

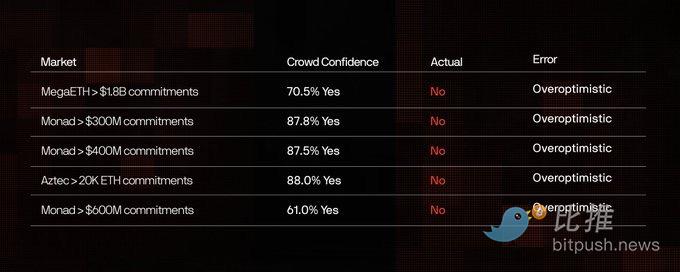
We examined every market where users had over 60% confidence in an unrealized outcome. In every case, the error was consistently in the same direction: excessive optimism. The crowd consistently believed the fundraising size would be larger and the valuation higher than they actually were.

This systematic bias suggests that the participants in these markets are optimistic speculators who are drawn there precisely because they are bullish on the token sales.

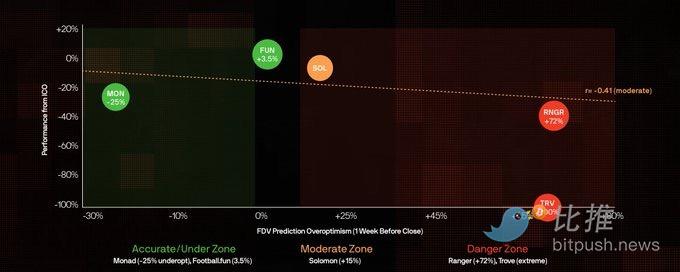
Excessive Optimism vs. Token Performance (Since ICO)

Methodology: This analysis only includes markets that had a public ICO and have issued tokens, using PM odds from one week before closing. Degree of Excessive Optimism = (PM Predicted FDV – Actual 24h FDV) / Actual 24h FDV. The Y-axis shows performance (return) since the ICO.

The data shows a moderate negative correlation (r=-0.41) between the degree of excessive optimism and ICO returns. Monad was undervalued (-25%) but has still fallen -24% since its ICO. Ranger was the most over-optimistically predicted (+72%) and has fallen -32% since its ICO. Only Football.fun remains above its ICO price (+1%).

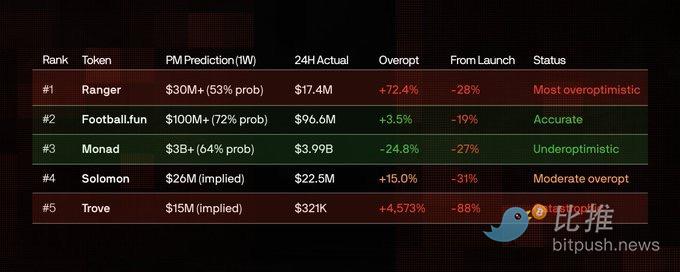
Token Performance Ranking

The table below uses historical PM odds from one week before closing, revealing the true prediction accuracy.

The pattern is clear: extreme excessive optimism foretells disaster, and high PM trading volume is a contrarian indicator even when its predictions are accurate.

ICO FDV vs. Listing Performance

Key Finding: Among tokens with ICO data, 40% listed at a price below their ICO valuation. Average return since ICO: -32.2%. Only Football.fun is trading above its ICO price.

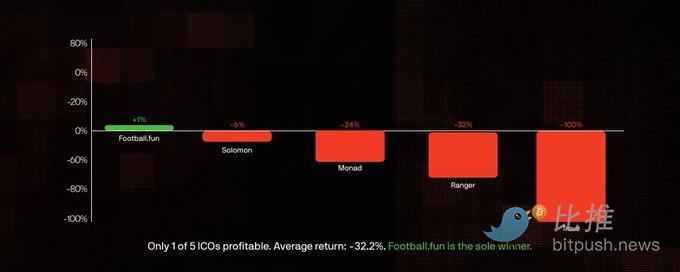
The pattern is starkly clear: Even tokens that listed above their ICO valuation (Monad, Solomon) eventually fell below the ICO price. Among the 5 ICO tokens in this dataset, only Football.fun is currently trading above its ICO price (+1%), making it the sole winner.

Key Conclusions

After analyzing 231 markets, $241.5 million in trading volume, and 8 listed tokens with verified 24-hour FDV data, several conclusions clearly emerge:

1. "100% accuracy" is meaningless. Markets close after the outcome is known (promise markets after the sale, FDV markets after 24 hours), so late-stage accuracy is trivially close to ~100%. One week before closing, the true prediction accuracy of promise markets was only 66.7%. At critical moments, the crowd was wrong one-third of the time.

2. Systematic excessive optimism. Among the top 15 markets, 5 markets showed over 60% confidence in thresholds that were not met. Average FDV overestimation: +35%.

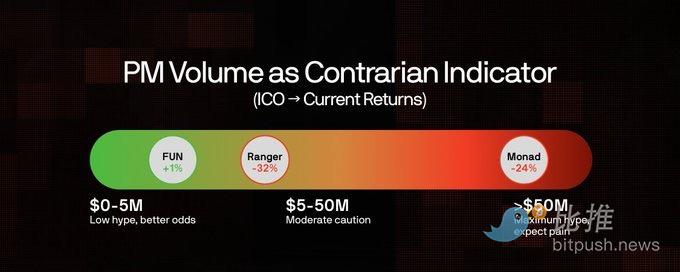
3. High PM trading volume is a contrarian indicator. Monad ($89M) and MegaETH ($67M) had the highest degrees of excessive optimism. The more money the crowd pours in, the more confident they become, and the more wrong they tend to be.

4. Conservative predictions = Better outcomes. Tokens where PM predictions were accurate (Monad, Football.fun) fell less. Low hype and accurate predictions appear to be bullish signals.

Trading Signals

Based on the analysis, we can extract actionable signals for evaluating future token sales. These are not absolutely precise, but they represent patterns that appeared repeatedly in our dataset.

Bearish Signals

  • PM Trading Volume > $50 Million

  • FDV Excessive Optimism > 50%

  • All FDV thresholds likely won't be met

  • Promise Amount Excessive Optimism > 30%

Bullish Signals (Relatively)

  • PM Trading Volume < $5 Million

  • FDV Prediction Error within 20%

  • Multiple FDV thresholds will be met

  • Crowd expectations are conservative

This asymmetry is crucial. Bearish signals are strong indicators of poor outcomes, while bullish signals are relatively weaker—only suggesting that a token might "fall less" than its hyped counterparts. In a market where token prices have generally fallen from their highs, "falling less" is already the best-case scenario.

Ultimately: Polymarket's token sale markets are essentially hype gauges. The true signal lies not in the prediction itself, but in the deviation between the predicted outcome and the actual performance. When public money floods in, betting that valuations will continue to climb, it is wise to be cautious.

History repeatedly proves: when market consensus peaks, it is often the moment when investors experience the most pain.

Data sources in the article: Polymarket CLOB API, CoinGecko, CMC (cross-verified), price data as of January 27, 2026.


Twitter:https://twitter.com/BitpushNewsCN

Bitpush TG Discussion Group:https://t.me/BitPushCommunity

Bitpush TG Subscription: https://t.me/bitpush

Original article link:https://www.bitpush.news/articles/7607105

Preguntas relacionadas

QWhat is the main finding regarding the accuracy of prediction markets for ICOs one week before closing?

AThe true prediction accuracy of commitment markets one week before closing is only 66.7%, meaning the crowd was wrong one out of every three times during critical periods of uncertainty.

QWhat systematic bias did the analysis discover in the prediction markets?

AThe analysis found a systematic bias of excessive optimism, where participants consistently predicted higher fundraising amounts and higher valuations than what actually occurred.

QAccording to the article, what does high trading volume on Polymarket indicate for an ICO?

AHigh Polymarket trading volume (e.g., over $50 million) is a bearish signal and acts as a reverse indicator, suggesting that the more money the crowd invests, the more confidently wrong they tend to be.

QWhat percentage of tokens in the dataset traded below their ICO valuation at listing?

A40% of the tokens with ICO data in the dataset listed at a price below their ICO valuation.

QWhat is the key takeaway about the relationship between prediction market forecasts and actual ICO performance?

AThe key takeaway is that prediction markets are not reliable forecasting tools but rather gauges of hype. The true signal lies not in the predictions themselves, but in the deviation between those predictions and actual performance.

Lecturas Relacionadas

Macroeconomic Origins of the African Payments Market Structure

Africa’s payment landscape exhibits the world’s highest mobile money penetration and fastest cryptocurrency adoption. This is not a market anomaly but a macroeconomic inevitability driven by deep structural factors: a vast, young population, heavy reliance on commodity exports and remittances generating massive cross‑border payment needs, and a chronically underdeveloped formal banking system plagued by de‑risking, high inflation, and currency instability. This vacuum has allowed mobile money (e.g., M‑Pesa) to become the primary payment channel domestically, while cryptocurrencies—particularly stablecoins—serve as a store of value against local‑currency depreciation and a lower‑cost cross‑border medium. The key divide is the Sahara: North Africa integrates with the MENA oil‑centric financial system, while Sub‑Saharan Africa, facing acute dollar shortages and fragmented currencies, is the epicenter of this fintech surge. Structural reliance on dollars, driven by trade deficits and weak local currency credibility, creates persistent dollar scarcity, which crypto and mobile payments effectively address. Efforts like the Pan‑African Payment and Settlement System (PAPSS) aim at de‑dollarization, but these alternatives will remain essential as long as underlying economic constraints—commodity dependence, limited industrialization, and financial exclusion—persist.

marsbitHace 3 min(s)

Macroeconomic Origins of the African Payments Market Structure

marsbitHace 3 min(s)

AAOI Defies Trend with Over 10% Surge, 'New Stock God' Serenity Predicts Potential to Double Again

On June 4th, despite a significant sell-off in the broader AI and semiconductor sector triggered by Broadcom's disappointing guidance, Applied Optoelectronics (AAOI) surged over 11%, showcasing a sharp divergence in market sentiment. Broadcom's warning about potential supply chain diversification by key customer Google and a weaker-than-expected outlook punctured the high-flying AI valuation narrative. This led to heavy selling in names like Broadcom (-12.6%) and Micron (-7%), with funds rotating into traditional industrial stocks. AAOI defied this trend. The stock has experienced high volatility recently, driven by bullish analyst coverage, notably from Rosenblatt which raised its price target to $220. Key catalysts include initial 800G optical module revenue from Amazon, potential certification from Oracle, and strong demand across its product portfolio. The company has reported cumulative orders for 800G/1.6T modules exceeding $324 million and is aggressively expanding manufacturing capacity in Texas, targeting an annualized run-rate of $1.4 billion for its module business by Q3 2027. However, AAOI's fundamentals present a mixed picture. Its Q1 2026 results missed expectations, showing a GAAP net loss, and Q2 guidance points to merely breakeven adjusted EPS. Risks include a delayed 800G production ramp to the second half of the year and high dependence on a few key cloud customers. Recent stock sales by company executives near price highs also noted. The article suggests AAOI's rally reflects a market beginning to differentiate within the AI ecosystem. While Broadcom's issues prompted a reassessment of custom ASIC and customer concentration risks, funds flowing into AAOI indicate a belief that the "physical bottleneck" narrative for optical connectivity—where supply remains tight—remains intact and is somewhat decoupled from the current sector weakness. The sustainability of AAOI's premium valuation now hinges on the successful execution of its production plans and upcoming quarterly results.

marsbitHace 10 min(s)

AAOI Defies Trend with Over 10% Surge, 'New Stock God' Serenity Predicts Potential to Double Again

marsbitHace 10 min(s)

Worried about AI's Self-Evolution, Anthropic Intends to Stop Training?

In early 2026, Anthropic signaled a significant shift in its public narrative regarding AI development timelines and safety. In June, its Anthropic Institute published a detailed article, "When AI builds itself," presenting internal data suggesting accelerating AI self-improvement. Key figures included over 80% of merged code being written by Claude and a 52x speedup in certain optimization tasks. The article outlined three future scenarios, with the most speculative being full recursive self-improvement (RSI), where AI autonomously builds better successors. Anthropic stated RSI is "possible" and may arrive faster than most institutions are prepared for. This narrative pivot followed a series of strategic moves. In January, CEO Dario Amodei wrote about a powerful self-improvement feedback loop. In February, Anthropic revised its Responsible Scaling Policy, removing a core commitment to pause training if capabilities outstripped safety controls, citing the risk of falling behind competitors. This change coincided with reported pressure from the US Department of Defense. By May, Anthropic's valuation had soared to $965 billion. Anthropic's stance was mirrored by other industry leaders. DeepMind CEO Demis Hassabis adjusted his AGI timeline to "by 2029" and admitted to using provocative language like "foothills of the singularity" to create urgency. OpenAI also released a model claiming a key role in its own creation process. The article's carefully calibrated tone—presenting dramatic data alongside qualifying footnotes—exemplifies a balancing act between signaling technological acceleration and managing commercial, regulatory, and safety imperatives. External experts offered contrasting interpretations of the same data, from warnings of catastrophic risk akin to Chernobyl to skepticism that current automation merely handles "grunt work," not genius. The coordinated narrative shift among top labs highlights the complex interplay between perceived technical inflection points and strategic communication aimed at investors, regulators, and the public.

marsbitHace 12 min(s)

Worried about AI's Self-Evolution, Anthropic Intends to Stop Training?

marsbitHace 12 min(s)

Trading

Spot
Futuros
活动图片