A Bullish Pennant Just Appeared On The Dogecoin Monthly Chart, Here’s What To Expect

bitcoinistPublicado a 2026-03-10Actualizado a 2026-03-10

Resumen

A massive bullish pennant pattern is forming on the Dogecoin (DOGE/USD) monthly chart, a development that began after the cryptocurrency's historic rally in 2021. The pattern started with a sharp "flagpole" surge that took DOGE from under $0.01 to its all-time high of $0.73. Since that peak, the price has been compressing between two converging trendlines, creating a symmetrical triangle with a series of lower highs and higher lows. The price is currently testing a critical juncture, trading near the lower, rising support trendline around $0.09. Holding this support is crucial for the pattern's validity; a monthly close below it would weaken the bullish outlook. For the pattern to confirm and trigger a significant breakout, DOGE must first push above the upper, descending trendline, which requires closing consecutive months above the $0.32 level. If a breakout occurs, the measured move target—calculated from the height of the 2021 flagpole—projects a substantial upward move. Conservative estimates suggest a target well above $1, with more optimistic projections reaching the $3 to $4 range.

Most traders are watching Dogecoin on the daily or weekly chart, reacting to intraday price action. However, the monthly candlestick chart tells a different story, one that has been developing since the 2021 cycle and is now approaching an inflection point.

Technical analysis shows a massive bullish pennant is forming on the DOGE/USD monthly timeframe. Dogecoin is now at a lower high support in the pennant, and the technical implications are significant.

Giant Pennant Has Been Forming Since The 2021 Rally

The monthly chart shows Dogecoin’s price compressing between two converging trendlines, forming what appears to be a large bullish pennant. The structure begins with the flagpole: the near-vertical surge that launched Dogecoin from below $0.01 to its all-time high of $0.73 in May 2021.

Since that peak, DOGE’s price action has been forming a symmetrical triangle on the monthly chart, a series of lower highs and higher lows converging steadily toward an apex. The upper boundary slopes downward from the peak reached during the 2021 surge, creating a descending resistance line that has rejected several major rallies since then.
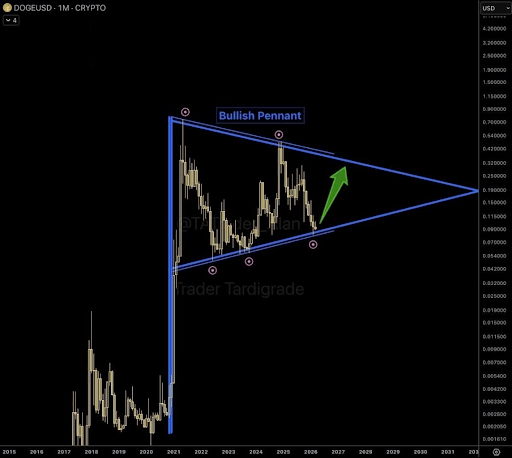
Source: Chart from TheMoonHailey on X

The lower boundary, on the other hand, rises gradually from the base that formed once the previous rally cooled to create a higher low. The lower trendline has provided consistent support, and critically, it held last month when the price tested the $0.08 zone.

As shown in the Dogecoin monthly candlestick chart below, these two lines have created a triangular formation that has continued to narrow since 2021. Multiple turning points on the chart show price reacting precisely at these boundaries, and the structure has been respected repeatedly over time.

Here’s What To Expect From The Bullish Pennant

One of the most important details in the chart is the most recent interaction with the lower trendline. Dogecoin dipped to the rising support boundary in February and bounced. That rebound occurred around the same area where Dogecoin has been trading recently, just below the $0.09 level.

At the time of writing, Dogecoin is trading at $0.094, still close to the support. Holding this support and closing above it in March is important for the structure because a bullish pennant depends on price remaining inside the converging boundaries. If DOGE were to close the month below the lower trendline, then the bullish outlook would weaken.

On the other hand, the bullish outlook depends on Dogecoin breaking above the upper end of the bullish pennant. The measured move target of a bullish pennant is calculated from the height of the flagpole, projected from the breakout point. Given the scale of Dogecoin’s 2021 flagpole, even conservative projections point well above $1, with upper-range targets in the $3 to $4 territory.

However, there is still much work to do for DOGE to return to the upper trendline before a breakout. Particularly, Dogecoin needs to push above $0.32 and close consecutive months above this level.

DOGE trading at $0.09 on the 1D chart | Source: DOGEUSDT on Tradingview.com

Preguntas relacionadas

QWhat pattern is forming on the Dogecoin monthly chart according to the article?

AA massive bullish pennant is forming on the DOGE/USD monthly timeframe.

QWhat was the starting point (flagpole) of this bullish pennant pattern?

AThe flagpole was the near-vertical surge that launched Dogecoin from below $0.01 to its all-time high of $0.73 in May 2021.

QWhat is the critical support level that Dogecoin recently tested and held?

ADogecoin recently tested and held the support at the lower trendline around the $0.08 zone in February.

QWhat is the significance of Dogecoin closing a month above the $0.32 level?

AClosing consecutive months above the $0.32 level is necessary for Dogecoin to push towards the upper trendline and attempt a breakout from the pennant.

QWhat is the potential price target if the bullish pennant pattern completes with a successful breakout?

AThe measured move target, based on the height of the 2021 flagpole, points well above $1, with upper-range targets in the $3 to $4 territory.

Lecturas Relacionadas

Within Strategy's Framework, STRC's Dividend Yield Remains at 12% as Share Price Stays Below Par Value

Michael Saylor, Executive Chairman of Strategy (MSTR), confirmed that the dividend rate for its STRC perpetual preferred shares will remain at 12.00% through August 2026. The rate has increased from 9% at its July 2025 launch to the current high via a "ratchet" mechanism, which permanently raises the rate by 0.5% whenever the share price falls below $95. This mechanism is intended to push the price back toward its $100 par value and support Strategy's "at-the-market" (ATM) program for issuing new shares to fund Bitcoin purchases. However, the mechanism has not worked as intended. STRC shares closed at $89.46 on July 31, remaining about 10-11% below par value despite the record-high dividend. Competition from rival Strive's higher-yielding SATA securities has pressured demand. The persistent discount has forced Strategy to suspend new STRC issuances via its ATM program, limiting this funding channel for Bitcoin acquisitions. STRC's struggles reflect Bitcoin's own volatility, as the preferred shares historically move in tandem. Analysts have warned the ratchet structure carries long-term, one-way risk. A law firm is investigating Strategy's ability to maintain dividend payments if Bitcoin's price stays low. Retail investors own roughly 83% of outstanding STRC shares, a group seen as prone to panic selling during downturns. In response, Strategy has established financial reserves, including a liquidity cushion covering about 26 months of dividend/interest obligations, and a $2 billion share buyback program alongside a Bitcoin monetization framework, though the company emphasized it is not obligated to sell any Bitcoin.

cryptonews.ruHace 12 min(s)

Within Strategy's Framework, STRC's Dividend Yield Remains at 12% as Share Price Stays Below Par Value

cryptonews.ruHace 12 min(s)

Analyst: Bitcoin's Price Will Drop to $60k in August, Then Rebound to $70k

Financial analyst Andrey Poroshin has provided a new forecast for Bitcoin's price dynamics in August. Poroshin, an analyst at the Bitbanker exchange, expects the cryptocurrency market to experience a downturn this month, with prices retesting the $60,000 level due to a lack of supportive macroeconomic catalysts. He noted that the recent US Federal Reserve decision to hold interest rates did not significantly impact the market, while inflation remains above the 2% target. Poroshin stated that Bitcoin is ending July under pressure from moderate volatility and a lack of new macroeconomic stimuli, leading to continued market caution. According to his base scenario, Bitcoin will drop to a range of $60,000 to $62,000 before recovering to $70,000. He pointed out that even $70,000 remains below the cost of mining in the US, which has prompted some miners to shift towards AI data center operations. Poroshin cited the winding down of BitMEX's operations as a potential catalyst for a price rebound, suggesting the exit of weaker players often coincides with market reversals and reduced short-term selling pressure. He believes Bitcoin is currently less susceptible to geopolitical shocks, such as the Iran-US conflict, and does not expect significant market changes in August related to the pending CLARITY Act. Looking ahead, Poroshin forecasts that September will bring more active price fluctuations driven by potential Fed rate decisions and possible discussions or approval of the CLARITY Act.

cryptonews.ruHace 12 min(s)

Analyst: Bitcoin's Price Will Drop to $60k in August, Then Rebound to $70k

cryptonews.ruHace 12 min(s)

Trading

Spot
活动图片





