A 25% Weekly Surge: Bitcoin Breaks $79,000 Amid Mass Short Liquidation

cryptonews.ruPublicado a 2026-08-21Actualizado a 2026-08-21

Resumen

Bitcoin surged above $79,000 on August 21, marking a 25% weekly gain. This rally was accompanied by massive liquidations of short positions exceeding $1.2 billion in 24 hours, catching bearish traders off guard. Several analysts provided technical perspectives. Crypto Candy noted Bitcoin quickly hit targets of $70,700 and $75,000 after breaking consolidation. While a short-term pullback is possible, maintaining momentum above $70,000 could drive prices toward $77,000 and $83,000. Trader Roman confirmed a prior forecast for a $75,000 move, citing bullish signals and a decade-long uptrend, though a minor correction is possible. Daan Crypto Trades highlighted Bitcoin's attempt to hold above key support and the weekly 200EMA. He emphasized the $73,000-$74,000 resistance zone; a sustained break above it would boost confidence for a move toward May's highs, pending a weekly close at or above current levels. Key levels identified are: $70,000 (bullish scenario support), $73,000-$74,000 (critical resistance), $79,000 (current peak), and $83,000 (next target). Analysts agree the $73K-$74K zone is crucial for further upside toward $80K-$83K, acknowledging potential for a short-term correction but noting the overall chart structure remains bullish. An AI-driven analysis compares the current surge to past events, suggesting such short-squeeze rallies can be short-lived impulses rather than definitive trend reversals. It questions whether the move reflects genuine spot demand or a cas...

Bitcoin climbed above the $79,000 mark on August 21, marking a 25% increase since the beginning of the week. This move was accompanied by a massive liquidation of short positions and has become a topic of discussion among several analysts and traders on the social network X.
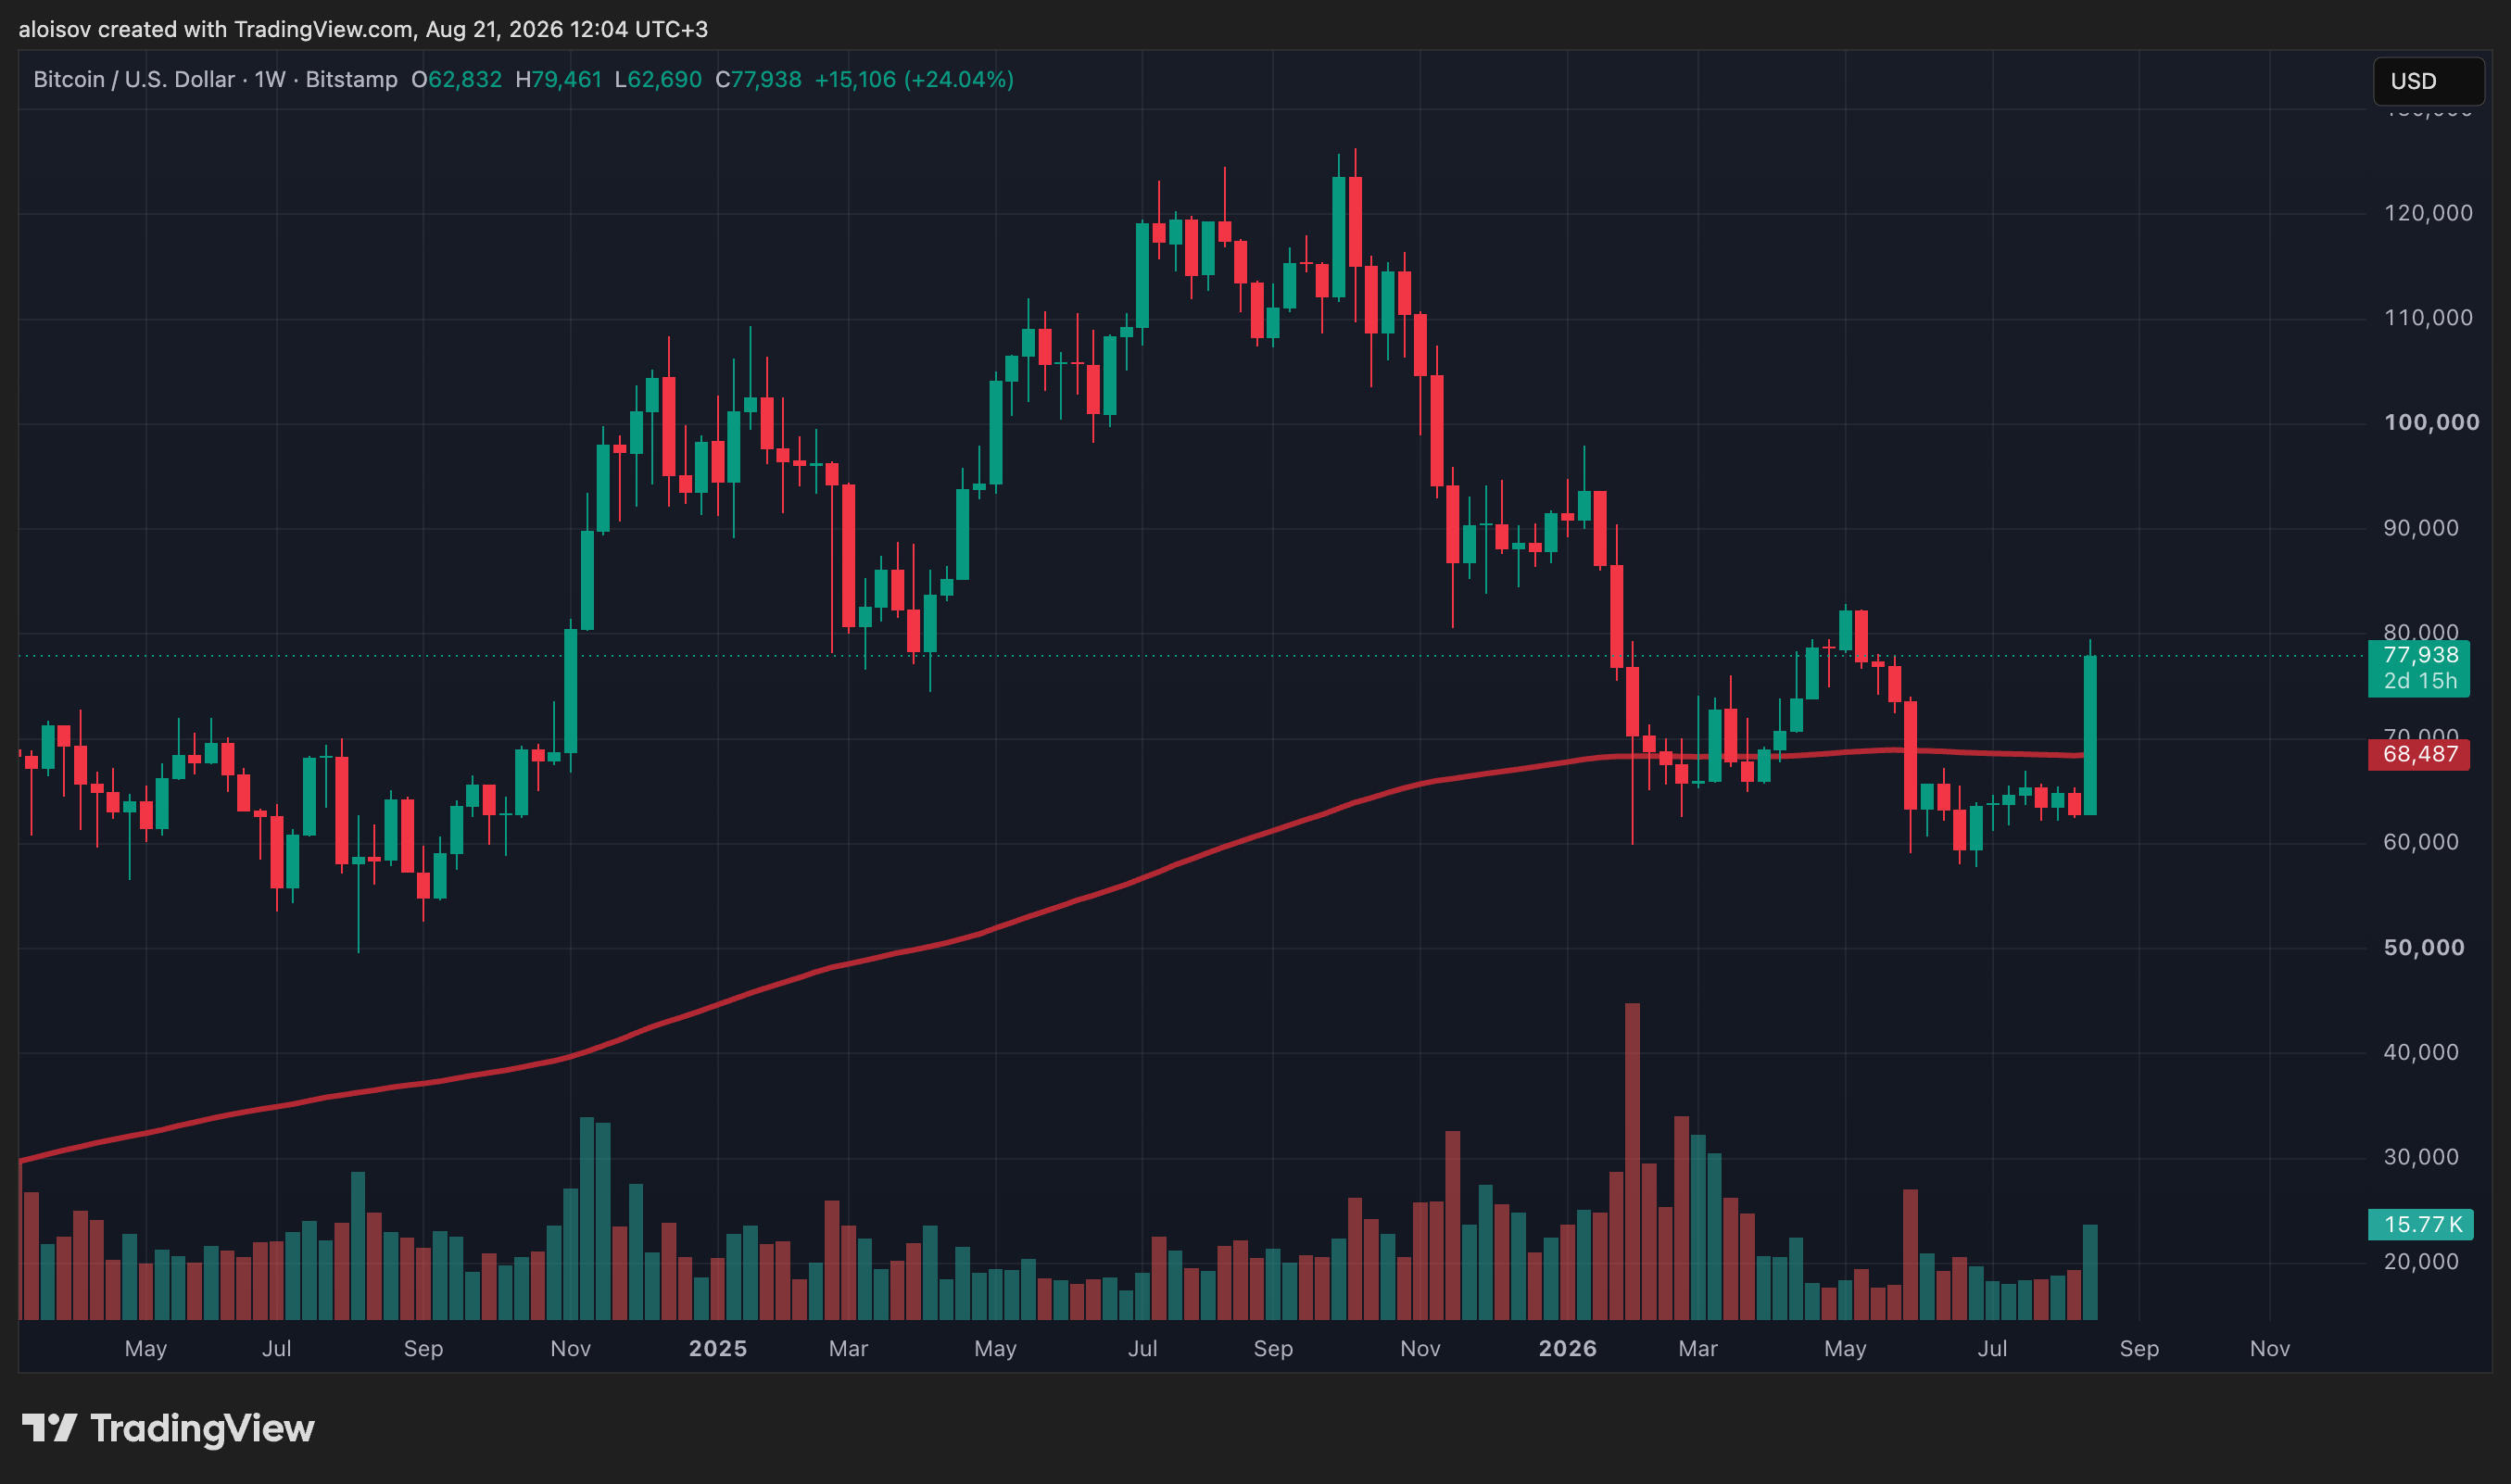
1-week chart of $BTC/USD and the 200EMA. Source: Bitstamp

Short Liquidations Amid the Rally

Crypto YouTuber Crypto Rover highlighted the volume of forcibly closed positions: according to CoinGlass, over the last 24 hours, more than $1.2 billion worth of short positions were liquidated. He characterized the candles on the Bitcoin chart as extremely aggressive against the bears—the sharp upward movement caught those betting on a price decline off guard.

Technical Targets and a Potential Correction

Trader and investor Crypto Candy noted that after breaking out of the consolidation zone, Bitcoin rapidly hit both previously identified targets—$70,700 and $75,000—in just one day. In his assessment, a short-term pullback is possible; however, if the current momentum is sustained, movements toward $77,000 and then $83,000 are not out of the question. He stated that this scenario remains relevant as long as the price holds above the $70,000 level.
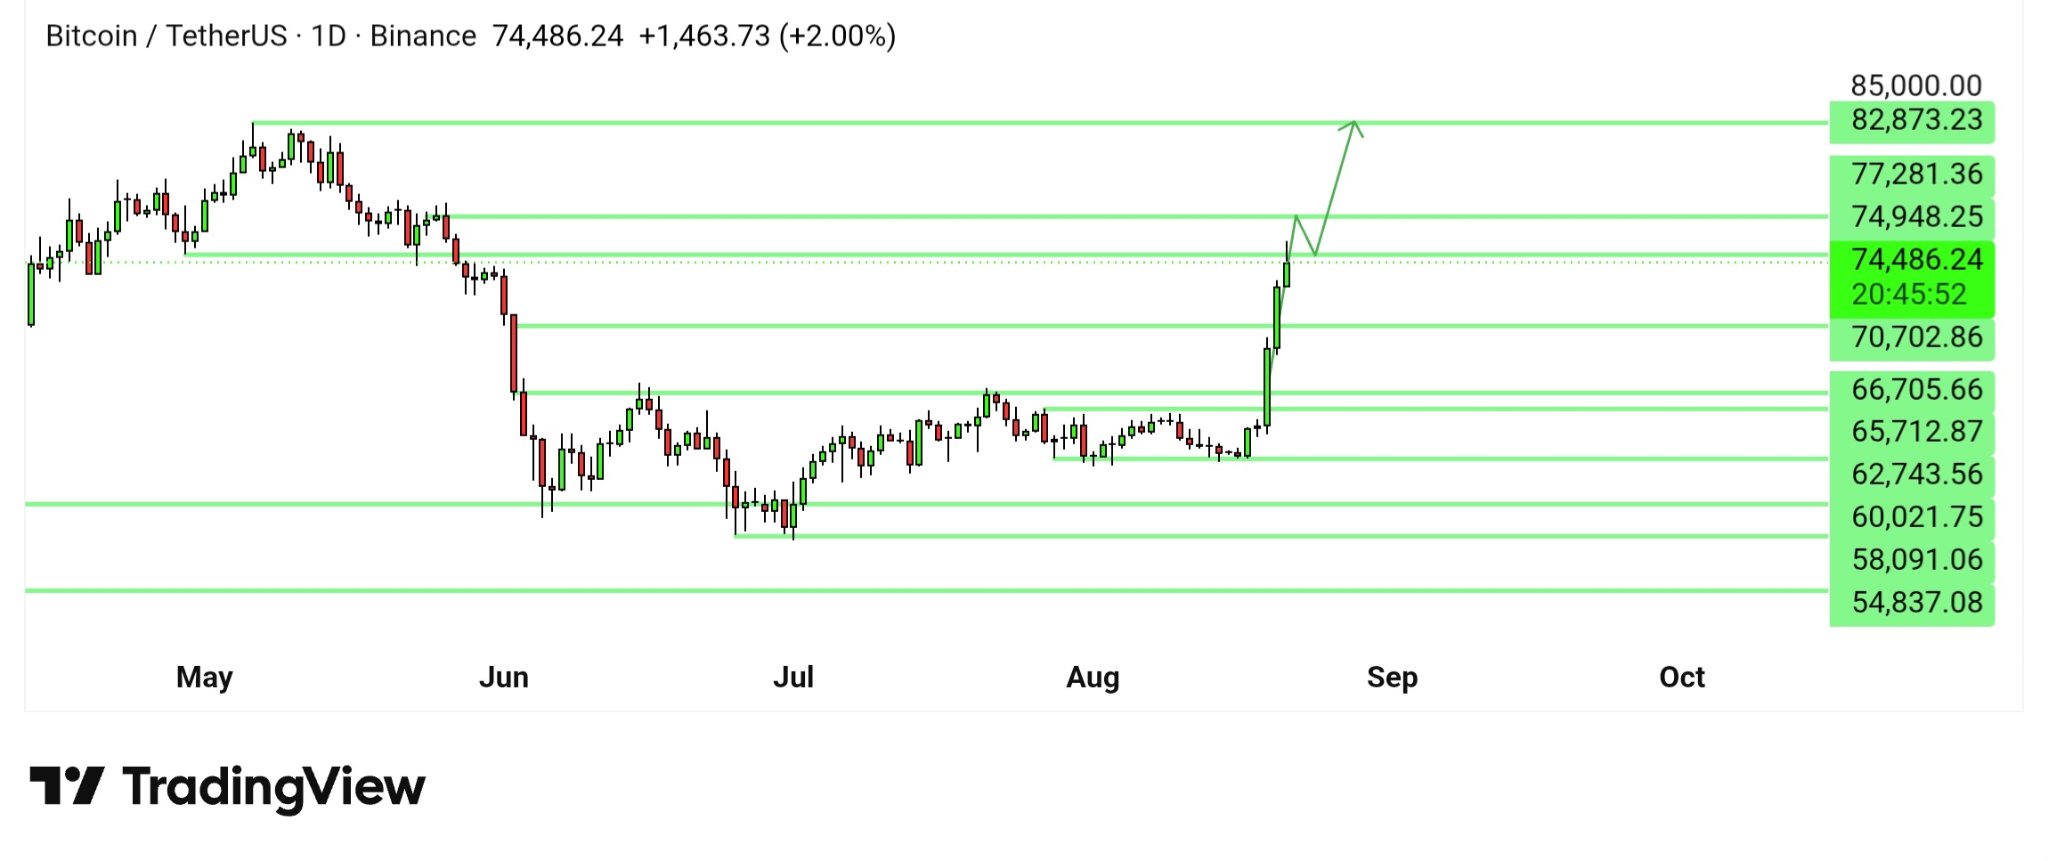
1-day chart of $BTC/USD. Analysis: Crypto Candy

Trader Roman holds a similar view. He reminded his audience that as recently as August 19 during a live stream, he spoke about the potential for a move to $75,000 in the coming days—a forecast that has now materialized. His assessment was based on a bullish deviation, a reversal indicated by a divergence indicator, and the overall price behavior structure. According to him, a sustained uptrend has been observed for over ten months, and a slight pullback at current levels cannot be ruled out.
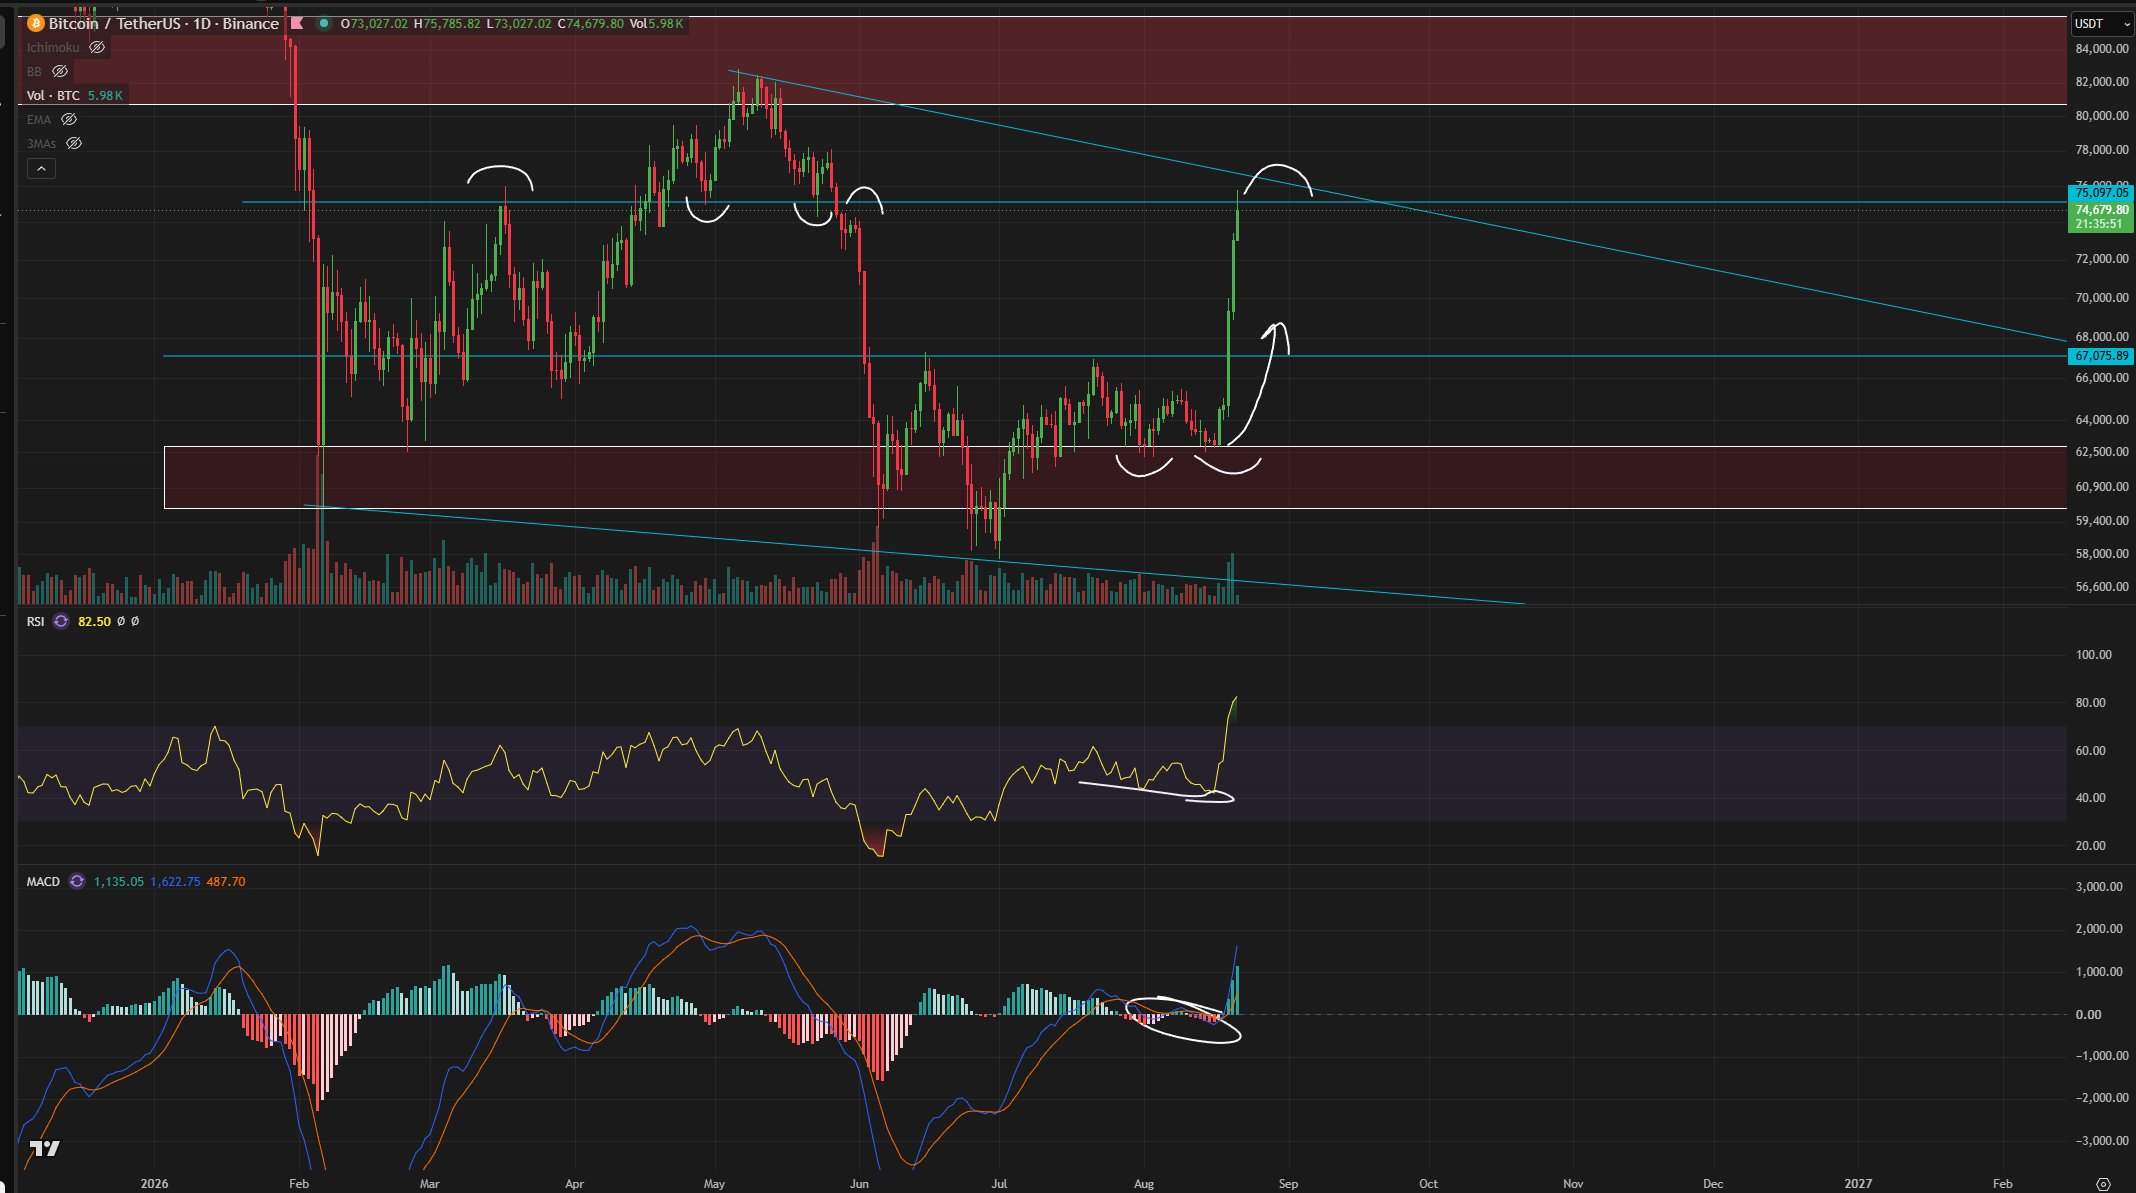
1-day chart of $BTC/USD. Analysis: Roman

The Weekly Candle and Moving Averages

Trader Daan Crypto Trades drew attention to Bitcoin's attempt to establish itself above the bull market support band and the weekly 200-period exponential moving average (EMA). He emphasized the significance of the horizontal $73,000–$74,000 level: closing above this zone, in his opinion, would increase confidence in a move toward the May highs. However, he suggested waiting for the closure of the current weekly candle at or above the achieved levels—this in itself would already be a positive signal.
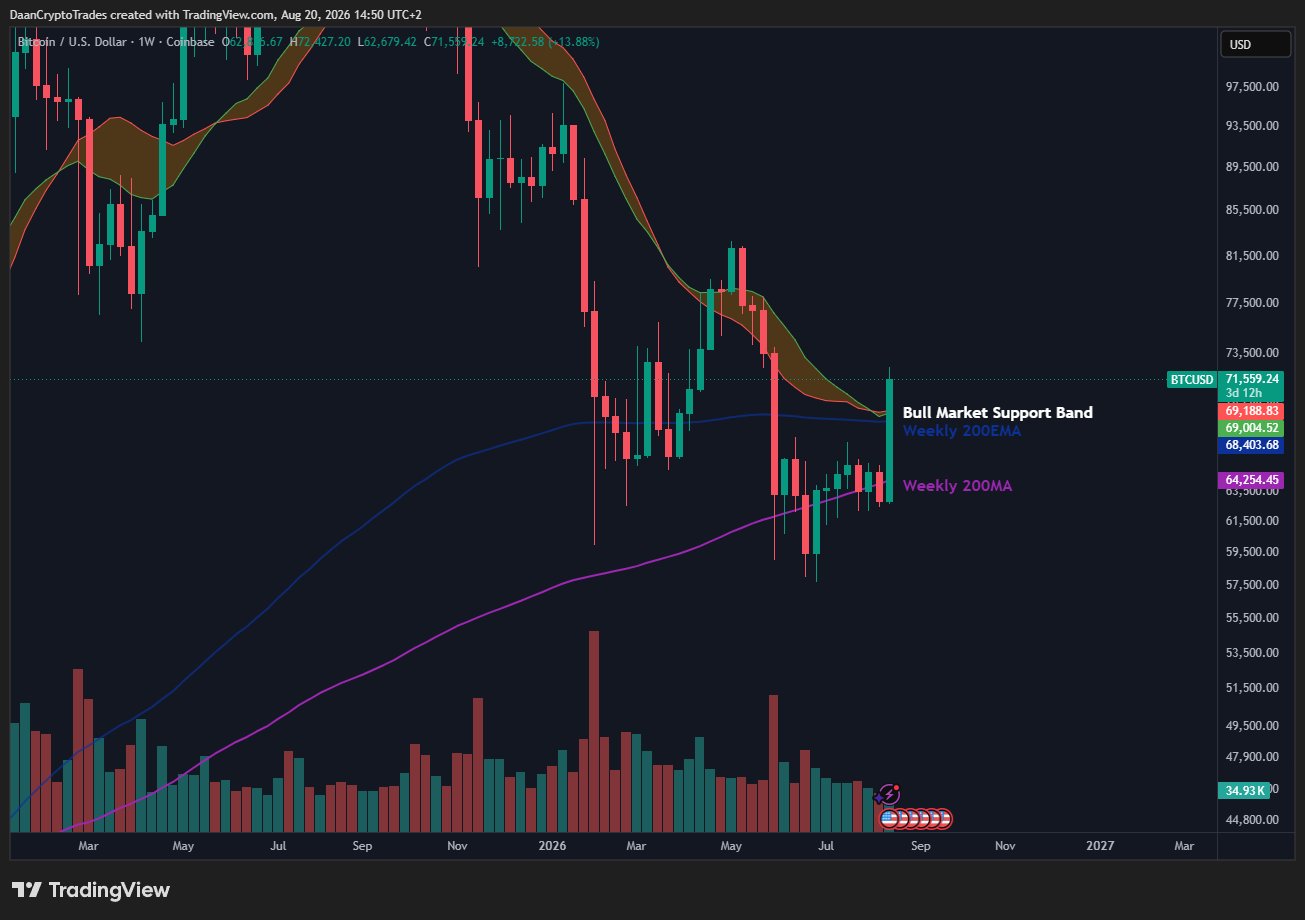
1-week chart of $BTC/USD. Analysis: Daan Crypto Trades

Key Levels

  • $70,000 — the level above which, according to analysts, the bullish scenario remains intact.

  • $73,000–$74,000 — the horizontal resistance level noted by Daan Crypto Trades.

  • $79,000 — the mark reached on August 21.

  • $83,000 — the next potential target according to Crypto Candy's assessment.

Thus, several traders agree that the key reference point for further movement remains the $73,000–$74,000 zone, with further targets along the current trend lying in the $80,000–$83,000 range.

Analysts also allow for a short-term correction after such a sharp move, while noting that the overall chart structure—from the weekly close above the 200 EMA to the bullish divergence—continues to point to the preservation of the upward trend.

The AI Perspective

From a machine data analysis perspective, Bitcoin's current jump to $79,000 resembles the structure of events from a year ago. The asset already breached the $70,000 mark on the back of a similar short squeeze on August 20, and the parallel with the summer of 2021 shows that short liquidations back then also exceeded $1 billion in a day, after which the price corrected by almost 20% from the local peak. Such episodes often represent a short-term impulse rather than a definitive trend reversal.

A technical aspect not addressed in the article is the derivative nature of such rallies. Analysts at Hash Telegraph have previously noted that sharp spikes amid mass liquidations often reflect the effect of cascading position closures rather than a real breakout of a level by spot market demand. Will the current momentum persist after the weekly candle closes, or will the market return to testing the $73,000–$74,000 zone?

end-content

Preguntas relacionadas

QWhat key price level did Bitcoin surpass on August 21st according to the article?

AAccording to the article, Bitcoin surpassed the price level of $79,000 on August 21st.

QWhat was the main catalyst mentioned for the sharp price increase, and what was the approximate value of liquidated positions in the last 24 hours?

AThe main catalyst mentioned was massive short liquidations. Over the last 24 hours, more than $1.2 billion worth of short positions were liquidated, forcing a sharp upward price movement.

QWhat are the two key technical price levels that analysts suggest are crucial for maintaining the bullish scenario and confirming further upward momentum?

AAnalysts suggest that holding above $70,000 is crucial for the bullish scenario. Furthermore, a decisive break and hold above the $73,000–$74,000 horizontal resistance zone would increase confidence in a move towards the May highs.

QWhat potential price targets were mentioned by the trader Crypto Candy after Bitcoin broke out of consolidation, and what caution did they advise?

ATrader Crypto Candy mentioned potential price targets of $77,000 and then $83,000 after Bitcoin broke out. However, they also cautioned that a short-term pullback is possible in the near term, despite the strong current momentum.

QBased on historical parallels and machine analysis presented in the article, what skepticism is raised about the sustainability of such rapid price rallies driven by liquidations?

ABased on historical parallels (e.g., Summer 2021) and machine analysis, the article raises skepticism that such rapid rallies driven by massive short liquidations are often short-lived impulses rather than definitive trend reversals. It questions whether the move reflects real spot market demand or is primarily a derivative-driven, cascading liquidation effect that may be followed by a significant price correction.

Lecturas Relacionadas

The End of APK Freedom? No, Google's Restrictions Will Not Affect Everyone or Everywhere

Google is introducing new rules for installing third-party APK files, but the restrictions will only affect some users and won't completely block app installation from unofficial sources. The company is implementing an "Advanced Flow" mechanism to combat fraud. However, its application is limited geographically, technically, and in timing. The new requirements will first take effect in Brazil, Indonesia, Singapore, and Thailand starting September 30, 2026, with a global rollout planned for 2027. The Advanced Flow system only works on Google-certified devices with pre-installed Google Mobile Services (GMS). Chinese versions of Android, which legally lack full GMS, are unaffected. Even on global devices with GMS, custom ROMs and ADB installations remain unrestricted. For affected users, a specific protocol is established. This involves enabling Developer Options, confirming no external pressure, rebooting, and then waiting a 24-hour protection period before a biometric/PIN confirmation grants installation permission for 7 days or indefinitely. Google states this creates friction for mass users while preserving technical capabilities for informed choice. A data-driven perspective notes that Advanced Flow is delivered via Google Play Services, not the core Android OS, meaning Google could modify or disable it remotely. Critics, including F-Droid and the EFF, warn this could follow a historical pattern where initial "trusted installer" mechanisms gradually expanded platform control over user choice. The long-term impact will depend on practical application beyond the stated policy.

cryptonews.ruHace 18 min(s)

The End of APK Freedom? No, Google's Restrictions Will Not Affect Everyone or Everywhere

cryptonews.ruHace 18 min(s)

Trading

Spot
活动图片