The $XRP price forecast relies on a signal that has only triggered twice before, each time preceding four-digit rallies. Analyst Ali Charts noted the Tom Demark Sequential buy signal on the monthly $XRP chart—the same pattern that preceded the 1,074% and 973% moves in 2020 and 2022.
$XRP Price Analysis: Bollinger Band Lower Band is the Last Line Before $1
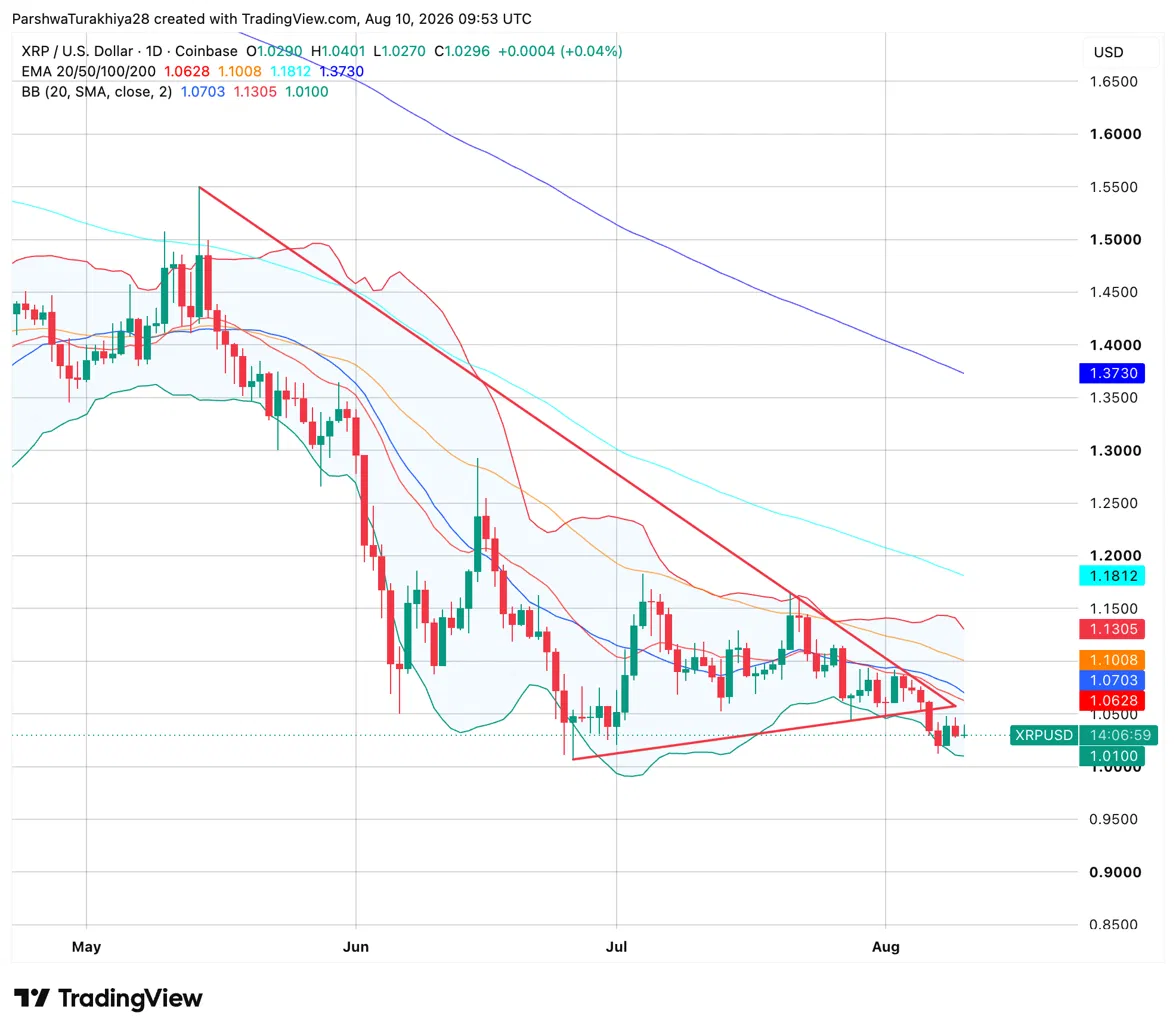
The daily chart shows $XRP compressed near the lower part of its range, with the Bollinger Band lower band at $1.01 being the last significant technical floor before the round $1. Today's session opened at $1.029, reached $1.04, and is holding at $1.0296. The descending wedge, which broke last week, left the price in a tight range between $1.01 and $1.06, with the Bollinger Band squeeze signaling an approaching directional move.
Related: Ethereum Price Forecast: Is ETH Quietly Preparing for Its Biggest Move of the Year?
All four EMAs remain above the price and are sloping downward. The 20-day line at $1.0628 is the immediate resistance, followed by the Bollinger Band middle line at $1.0703, the 50-day at $1.1008, the 100-day at $1.1812, and the 200-day at $1.3730. Analyst Ali Charts identified $1.06 as a key level to watch, noting that nearly 3 billion $XRP changed hands on-chain at that price, making it a real resistance cluster that requires a monthly close above to open the path to $1.35, then $1.64.
$XRP Support and Resistance Levels, August 10, 2026
| Type | Price | Level |
| Resistance | $1.0628 | 20-day EMA, key level per Ali Charts |
| Resistance | $1.0703 | Bollinger Band Middle Line |
| Resistance | $1.1008 | 50-day EMA |
| Resistance | $1.1305 | Bollinger Band Upper Band |
| Support | $1.0100 | Bollinger Band Lower Band, last floor |
| Support | $1 | Round number and psychological low |
$XRP Analysis: Monthly Tom DeMark Buy Signal and Whale Accumulation
$XRP READY FOR A BULL RALLY
— Ali Charts (@alicharts) August 9, 2026
1/5 🧵👇
Analyst Ali Charts posted a five-part thread on August 9th, laying out the case for a $XRP bull rally. The main signal is the Tom DeMark Sequential buy on the monthly $XRP chart. Over the past six years, this indicator has triggered three notable signals on $XRP: a buy in April 2020 preceding a 1,074% surge, a buy in August 2022 preceding a 973% surge, and a sell signal in April 2025 followed by a 57% decline. The current signal is a buy, and if the prior pattern holds, it would mark a macro-shift from bearish to bullish momentum.
Whale behavior adds weight to the signal. On-chain data cited by Ali Charts shows that large holders have accumulated over 380 million $XRP in the past week—a level of confidence at current prices that historically precedes, not follows, significant price moves. The key level remains $1.06. A monthly close above it, where nearly 3 billion $XRP changed hands on-chain, would open the path for the next targets of $1.35 and $1.64 as the continuation move.
$XRP ETF Flows: Inflow Pace Slows
$XRP spot ETFs maintained a positive weekly inflow streak for most of the summer, but the scale has sharply declined. Weekly inflows peaked at $60.50 million for the week of May 15th, then gradually fell to $22.04 million, $15.20 million, $10.68 million, and $10.66 million through June, then declined further to $17.19 million, -$7.18 million, $6.78 million, $8.15 million, and $14.86 million in July. The latest completed week on August 7th brought just $1.01 million—the lowest positive reading since the inflow streak began.
Related: Cardano Price Forecast: Grayscale Drops Cardano ETF Plan as ADA Struggles at $0.20
Cumulative net inflows stand at $1.51 billion, and total net assets at $953.19 million, but the slowdown in weekly pace suggests institutional interest in $XRP via ETFs is waning, despite the rise in on-chain whale accumulation—a divergence to watch ahead of the new week.
| Week | Weekly Net Inflow |
| May 15, 2026 | $60.50M |
| June 26, 2026 | $22.99M |
| July 2, 2026 | $17.19M |
| July 31, 2026 | $14.86M |
| August 7, 2026 | $1.01M |
$XRP Derivatives: Longs Take a Larger Share of the Pain
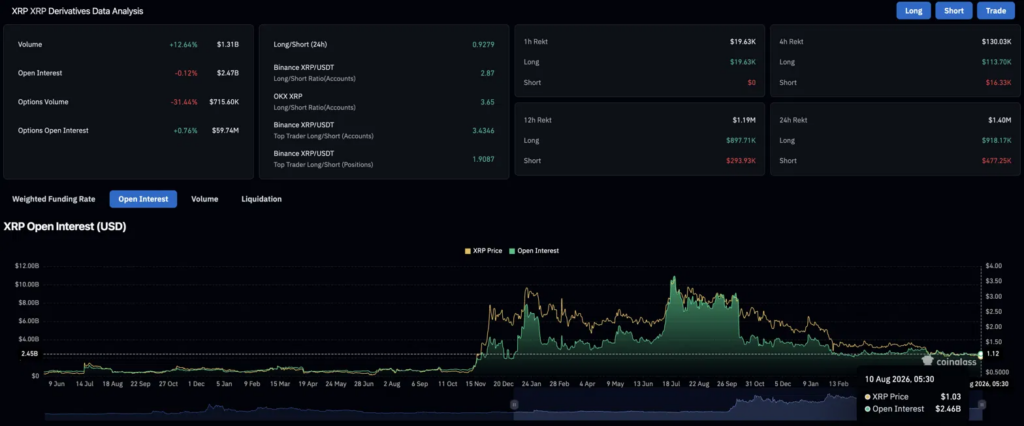
Volume increased by 12.64% to $1.31B, while open interest decreased by 0.12% to $2.47B. The decline in open interest alongside rising volume suggests existing positions are being closed, not new ones built.
Over 24 hours, longs absorbed $918.17K in liquidations versus $477.25K for shorts, meaning buyers betting on a recovery are currently taking more pain than those betting against it. Top trader accounts at 3.4346 and position sizes at 1.9087 remain firmly net long on both metrics, supporting the divergence between bullish positioning and bearish price action.
| Metric | Value | Interpretation |
| 24h Volume | $1.31B (+12.64%) | Moderate activity, positions closing |
| Open Interest | $2.47B (-0.12%) | Minor reduction in open positions |
| Top Trader L/S (Accounts) | 3.4346 | Large accounts heavily net long |
| Top Trader L/S (Positions) | 1.9087 | Position size also firmly net long |
| 24h Liquidations | $1.40M | Longs absorbed the majority |
Related: Bitcoin Price Forecast: Will CLARITY Act Delay Give Institutions Time to Load Up Before $73,000
$XRP Price Forecast: Upside Targets and Downside Risks
Bull Case, Target: $1.35 (Ali Charts Target)
The Bollinger Band lower band holds at $1.01, and $XRP stabilizes above $1.03. The monthly Tom DeMark buy signal is confirmed: August closes above $1.06, breaking the on-chain resistance cluster where 3 billion $XRP transacted. Whale accumulation continues to absorb available supply, and top trader long positioning is rewarded as price breaks through the 20-day EMA at $1.0628 and heads towards $1.35.
Bear Case, Risk Level: $1 (Round Number Low)
The Bollinger Band lower band at $1.01 fails on a daily close, and $XRP loses the $1 round, invalidating the Tom DeMark signal before it can confirm. Weekly ETF inflows continue to slow, removing a key layer of demand, and long liquidations accelerate as price slides below the psychological low, into territory not seen since the 2026 recovery.
Conclusion
The current $XRP setup boils down to whether rare signal and quiet accumulation can outweigh an evidently weakening ETF trend. The Tom DeMark buy signal has appeared only twice before, and both times it held true, but confirmation still requires a monthly close above $1.06—a level $XRP has not yet threatened from its current range around $1.03.
Whale accumulation does support the case, even as ETF inflows shrink to the lowest of the year. Hold $1.01—the path to $1.35 remains alive; lose the round $1, and the entire thesis must wait until the next monthly close to try again.