Bitcoin Price Forecast: Is Bitcoin's Resistance Band About to Break Through or Be Rejected for the Sixth Time?

cryptonews.ruPublicado a 2026-07-27Actualizado a 2026-07-27

Resumen

Bitcoin is trading around $65,457, consolidating between a key bear market resistance line (rejecting price since February) and its cluster of EMAs around $64,475-$65,045. Key resistance is at the upper Bollinger Band at $66,578, with further resistance at the 100-day EMA ($67,717). Support lies at the EMAs and the lower Bollinger Band at $62,243. A potential bullish catalyst is Iran's signal for a ceasefire, which could reduce geopolitical risk. Analyst Benjamin Cowen draws parallels to 2018, warning of a potential rejection and August-September decline if the resistance isn't broken. Anthony Scaramucci remains long-term bullish, citing Bitcoin's advantages over gold. The outlook hinges on whether BTC can close above the $66,578 resistance or faces another rejection.

Bitcoin is trading at $65,457 on July 27, up 0.18%, following Iran signaling a willingness to halt hostilities, simultaneously putting pressure on the bearish market resistance band that has capped all upside attempts since February.

$BTC is squeezed between the bear market resistance band and its EMA cluster.
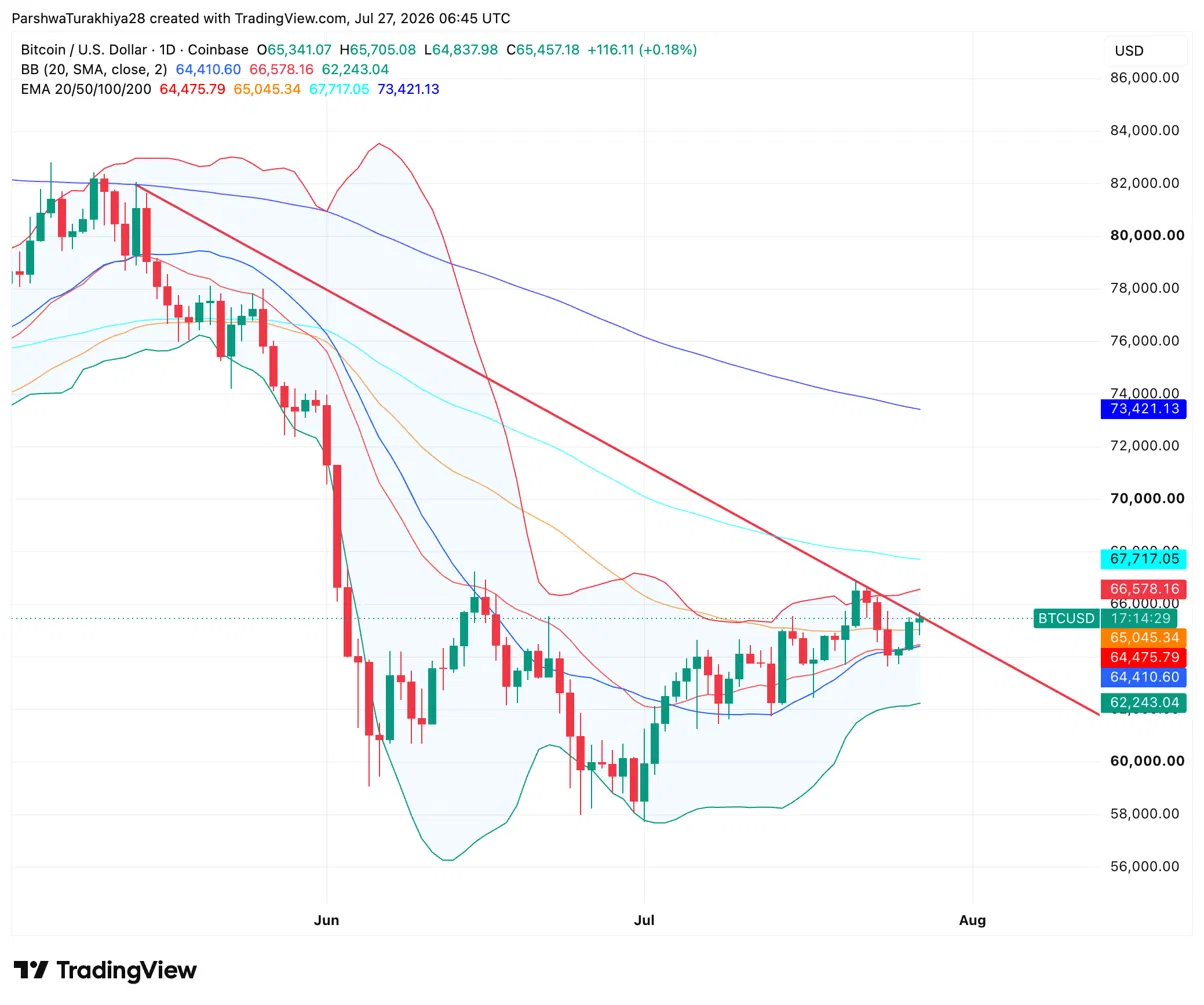
$BTC price chart 1D (Source: TradingView)

The daily chart shows $BTC consolidating between the 20-day EMA at $64,475 and the upper Bollinger Band at $66,578, with a descending red trendline from the May peak passing through the same zone. This trendline is Benjamin Cowen's bear market resistance band, and it has rejected the price on every approach since February. The 50-day EMA at $65,045 aligns almost exactly with the current price, making the EMA cluster an immediate support test.

Related: Cardano Price Forecast: Can ADA Break $0.20 Amid Ark Invest vs. Hoskinson Clash Over Its Significance?

The Bollinger Middle Line at $64,410 and the 20-day EMA at $64,475 form a narrow support zone just below. A close above the upper Bollinger Band at $66,578 and the descending trendline would be the first real signal of a breakout recovery. Above that, the next target is the 100-day EMA at $67,717, with the 200-day EMA at $73,421 as the long-term ceiling. The lower Bollinger Band at $62,243 defines the lower floor if support gives way.

What are the key support and resistance levels for $BTC today?

  • Support at $65,045 on the 50-day EMA and $64,475 on the 20-day EMA
  • Resistance at $66,578 on the upper Bollinger Band and the descending bear market resistance band
  • Extended resistance at $67,717 on the 100-day EMA
  • Key low at $62,243 on the lower Bollinger Band

Iran's ceasefire signal could be the needed macro-market unlock

Analyst Michaël van de Poppe reported on July 26 that Iran has indicated it will halt attacks provided the US suspends military operations.

Van de Poppe characterized this as a great sign for Bitcoin and crypto markets and called for a green week. Geopolitical tensions since June have been a persistent headwind for risk assets, with spikes in oil prices and uncertainty in the Strait of Hormuz repeatedly unsettling sentiment at key technical levels.

Benjamin Cowen sees a replay of 2018 with August declines

Cowen's latest video shows Bitcoin's 2026 structure relative to 2018: a February low, a high low in late March, the June low range in early July, and the current rally back to the bear market resistance band.

In 2018, this rally lasted until late July before giving back all gains in August and September. His base case is the same outcome: Q4 forms the market cycle bottom where on-chain indicators historically reset. His turnaround condition remains unchanged: if $BTC doesn't break out by year-end, he calls the bull market back on.

Anthony Scaramucci says $10 trillion is Bitcoin's next stop

Speaking on The Wolf of All Streets podcast, Scaramucci noted that Bitcoin's $1.2 trillion market cap is roughly the size of Micron Technology, arguing that a $10 trillion valuation still wouldn't be proportionate to global capital markets. He used gold's $28 trillion market cap as a benchmark, calling Bitcoin more scarce, more portable, and easier to move than the metal it increasingly competes with. He characterized the current environment as apathy, not a structural breakdown, drawing a parallel to Uber, where technologies that truly serve people eventually win, regardless of who tries to block them.

Related: Espresso Price Forecast: Bullish Momentum Builds as ESP Aims for $0.1208 Following 42% Weekly Rally

Regarding the clarity bill, Scaramucci flatly stated he does not see it passing, not out of pessimism but due to how Washington actually works. He argued Democrats have every incentive to block the bill simply to deny Trump a victory, irrespective of the bill's merits. He cited former SEC Chairman Paul Atkins as a steady hand but warned that without legislation, crypto regulation remains a pendulum swinging at the whim of those in power.

Bitcoin Price Forecast: Upside and downside targets

  • Upside case: Iran's ceasefire signal holds, $BTC closes above the upper Bollinger Band at $66,578 and the bear market resistance zone, the FOMC confirms a hold on rates on July 29, and van de Poppe's green week pushes towards the 100-day EMA at $67,717 amid a declining geopolitical risk premium.
  • Downside case: Cowen's 2018 analog plays out on the chart, $BTC is rejected at the bear market resistance zone, the 50-day EMA at $65,045 fails to hold support, and price drops towards the Bollinger Middle Line at $64,410 and the 20-day EMA at $64,475 as August seasonal weakness sets in.
end-content

Criptos en tendencia

Preguntas relacionadas

QWhat are the key support and resistance levels for Bitcoin mentioned in the article, based on the daily chart?

AKey support levels are at the 50-day EMA of $65,045 and the 20-day EMA of $64,475. Key resistance is at the upper Bollinger Band and the bear market resistance band around $66,578. Extended resistance is at the 100-day EMA of $67,717. The key floor is the lower Bollinger Band at $62,243.

QWhat geopolitical event does the article suggest could act as a positive catalyst for Bitcoin's price?

AThe article suggests that Iran signaling a readiness to suspend attacks, conditional on the US halting military operations, could be a positive macro catalyst for Bitcoin and crypto markets, potentially reducing geopolitical risk premiums.

QAccording to Benjamin Cowen's analysis, what historical pattern is Bitcoin's 2026 structure mirroring, and what is his base case outcome?

ABenjamin Cowen's analysis shows Bitcoin's 2026 structure mirroring 2018: a February low, a high low in late March, June lows retested in early July, and a rally back to the bear market resistance band. His base case is a similar outcome where the rally lasts until late July, followed by a pullback in August and September, with Q4 forming the market cycle bottom.

QWhat is Anthony Scaramucci's long-term outlook for Bitcoin's market capitalization, and what asset does he use as a benchmark?

AAnthony Scaramucci's long-term outlook is that Bitcoin's market cap could reach $10 trillion. He uses gold's market cap of $28 trillion as a benchmark, arguing Bitcoin is scarcer, more portable, and easier to move than the precious metal it increasingly competes with.

QWhat are the article's outlined 'Upside Case' and 'Downside Case' scenarios for Bitcoin's price movement?

AUpside Case: The Iran ceasefire signal holds, BTC closes above the $66,578 resistance (upper Bollinger Band & bear market band), the Fed holds rates on July 29, and a 'green week' propels price toward the 100-day EMA at $67,717. Downside Case: Cowen's 2018 analog plays out, BTC is rejected at the bear market band, support at the 50-day EMA ($65,045) fails, and price descends toward the $64,410-64,475 support zone (Bollinger midline & 20-day EMA) amid August seasonal weakness.

Lecturas Relacionadas

A Serious Threat is Looming for Bitcoin (BTC) and Cryptocurrencies: They Could Be the First Target!

The rapid advancement of quantum computing poses a serious threat not only to cryptocurrencies but to the entire encryption system, including banking. However, experts warn that the cryptocurrency market might be the first sector to suffer from this transformation. As predictions of a 'Q-Day' approach, the slow governance processes of cryptocurrencies, rather than their cryptography, could become the biggest obstacle to defending against quantum attacks. Quantum Xchange CEO Eddy Zervigon has compared cryptocurrencies to "canaries in the coal mine," stating that the first successful quantum-powered cyberattack is likely to target decentralized blockchain networks. While a cryptographically relevant quantum computer capable of breaking the elliptic curve cryptography underlying Bitcoin's signatures and banking security does not yet exist, work by giants like Microsoft, IBM, and Google suggests the threat is nearer than previously thought. The industry consensus estimates such a computer could emerge around 2029. Supporting this view, recent Google research indicates the number of physical qubits needed to break the cryptographic systems protecting Bitcoin and Ethereum has decreased by about 20 times compared to prior estimates, highlighting the accelerated danger. Zervigon concludes that Bitcoin's greatest risk lies not in its current cryptographic system, but in the slow pace of implementing major network upgrades.

cryptonews.ruHace 30 min(s)

A Serious Threat is Looming for Bitcoin (BTC) and Cryptocurrencies: They Could Be the First Target!

cryptonews.ruHace 30 min(s)

Crypto Outperforming Stocks: How Digital Assets Are Withstanding Macroeconomic Pressure

Crypto Outperforms Stocks Amid Macro Pressure Trading firm QCP Capital's report analyzes the divergent performance of crypto and stock markets ahead of the July 29 FOMC meeting. While major US stock indexes showed mixed results, with tech weakness pressuring the Nasdaq, crypto assets like Bitcoin (up ~11.6% in July) and Ethereum (up ~24.6%) have outperformed despite a challenging macro backdrop, including rising Treasury yields and risk-off sentiment. Key focus points include the upcoming Fed decision and commentary from Chair Kevin Warsh, which could signal the regulator's stance on inflation and growth. Spot Bitcoin and Ethereum ETFs saw a net outflow of ~$311 million on July 24, ending a seven-day inflow streak, highlighting shifting institutional sentiment. Option market data reveals increased demand for downside protection, indicating caution, though constructive long-term positioning remains. Implied volatility for Ethereum trades at a premium to Bitcoin, and perpetual funding rates stay positive. The week's key events are the FOMC decision, Treasury yield movements, ETF flow trends, and US regulatory developments like the CLARITY Act. The market balances crypto's resilience against growing option market caution, with the Fed's decision poised to tip the scales. Analysis compares the current Fed pause to historical rate-cutting cycles, questioning whether crypto's strength can persist if monetary policy tightening persists.

cryptonews.ruHace 40 min(s)

Crypto Outperforming Stocks: How Digital Assets Are Withstanding Macroeconomic Pressure

cryptonews.ruHace 40 min(s)

Trading

Spot

Artículos destacados

Cómo comprar BAND

¡Bienvenido a HTX.com! Hemos hecho que comprar Band Protocol (BAND) sea simple y conveniente. Sigue nuestra guía paso a paso para iniciar tu viaje de criptos.Paso 1: crea tu cuenta HTXUtiliza tu correo electrónico o número de teléfono para registrarte y obtener una cuenta gratuita en HTX. Experimenta un proceso de registro sin complicaciones y desbloquea todas las funciones.Obtener mi cuentaPaso 2: ve a Comprar cripto y elige tu método de pagoTarjeta de crédito/débito: usa tu Visa o Mastercard para comprar Band Protocol (BAND) al instante.Saldo: utiliza fondos del saldo de tu cuenta HTX para tradear sin problemas.Terceros: hemos agregado métodos de pago populares como Google Pay y Apple Pay para mejorar la comodidad.P2P: tradear directamente con otros usuarios en HTX.Over-the-Counter (OTC): ofrecemos servicios personalizados y tipos de cambio competitivos para los traders.Paso 3: guarda tu Band Protocol (BAND)Después de comprar tu Band Protocol (BAND), guárdalo en tu cuenta HTX. Alternativamente, puedes enviarlo a otro lugar mediante transferencia blockchain o utilizarlo para tradear otras criptomonedas.Paso 4: tradear Band Protocol (BAND)Tradear fácilmente con Band Protocol (BAND) en HTX's mercado spot. Simplemente accede a tu cuenta, selecciona tu par de trading, ejecuta tus trades y monitorea en tiempo real. Ofrecemos una experiencia fácil de usar tanto para principiantes como para traders experimentados.

106 Vistas totalesPublicado en 2024.12.12Actualizado en 2026.06.02

Cómo comprar BAND

Discusiones

Bienvenido a la comunidad de HTX. Aquí puedes mantenerte informado sobre los últimos desarrollos de la plataforma y acceder a análisis profesionales del mercado. A continuación se presentan las opiniones de los usuarios sobre el precio de BAND (BAND).

活动图片