2026 Mid-Year Report On-Chain RWA: Tokenized Stock Market Cap Doubles in a Year, But 90% of Rights Are Hollow Shells

marsbitPublicado a 2026-08-01Actualizado a 2026-08-01

Resumen

The 2026 Mid-Year Report on On-Chain RWA highlights a significant growth in tokenized stock market capitalization, which nearly doubled from $951 million in March to $1.89 billion by July. However, the report reveals a fundamental contradiction in this "layer 2.5" ecosystem: products with the strongest legal foundation (like regulated U.S. infrastructure) lack liquidity and distribution, while freely tradable offshored wrapper products often lack substantive ownership rights. The increase is driven largely by a few products (SECZ, FGRS, STRCx) and platforms (Ondo, xStocks, Securitize collectively hold over 85% share). While distributed value across networks like Ethereum, Solana, and BNB Chain has grown, the market remains fragmented. Products referencing the same underlying asset (e.g., Apple stock) are distinct legal liabilities with different intermediaries and jurisdictional rules, offering varying degrees of legal claim. The report cautions that headline numbers are misleading, as they reflect changes in distributed token value—driven by issuance, conversions, and price movements—not pure investor inflows. True "canonical shares" with legal ownership, wide wallet distribution, institutional liquidity, and independent on-chain price discovery do not yet exist at scale. Tokenized treasuries show stronger product-market fit, and ETFs may be easier to scale than single stocks. The core takeaway is a trade-off: legal certainty versus liquidity and composability.

Author: insights4vc

Translation: Deep Chao TechFlow

Deep Chao Introduction: The headline figure for the scale of on-chain tokenized assets looks good, but behind it lies a fundamental contradiction—products that can be freely circulated often lack real ownership rights, while products with genuine legal effect lack liquidity. This report uses specific data to dissect just how much of this "$1.89 billion market" is real money, serving as a necessary dose of sobriety for any investor considering deploying capital in on-chain securities.

The stock market hasn't moved on-chain. What has truly emerged is a set of more credible infrastructure layers—for distributing securities, recording ownership claims, and settling trades through blockchain-based systems.

Data from RWA.xyz shows that the value of distributed tokenized stocks grew from $951 million in March 2026 to $1.89 billion in July, almost doubling. However, this growth primarily came from a handful of products and platforms.

The most significant progress has come from regulated market infrastructure, notably Nasdaq's Same CUSIP Settlement model and the planned commercial rollout by DTC. Liquidity, investor distribution, and independent on-chain price discovery remain very limited. Tokenized treasuries continue to demonstrate stronger product-market fit, and equity ETFs may be easier to scale than single stocks.

Therefore, this market is best understood as a fragmented "Layer 2.5" system: products with the most robust legal foundations often have the weakest liquidity and distribution capabilities; while the most actively traded wrapped products typically have the thinnest ownership rights.

This report is an update to insights4vc's March 2026 analysis "The State of On-Chain Real Assets," focusing on what has substantively changed since its release.

The State of On-Chain Real Assets

What Has Substantively Changed Since March

The March report distinguished between two types of assets: those recorded on a blockchain, and those transferable to external wallets. This distinction remains important today. Under RWA.xyz's framework, a "represented asset" stays within the issuer's or platform's own environment; a "distributed asset" can be transferred externally, though transfers may still be limited to approved or whitelisted wallets.

But transferability alone is no longer sufficient to gauge a product's maturity.

Since March, offshore products have become more accessible for cross-chain movement and use in decentralized markets. Ondo expanded to Ethereum, BNB Chain, and Solana, introduced decentralized routing, and added continuous minting and redemption features for some products. xStocks also broadened its distribution channels and collateral integrations.

Meanwhile, regulated US infrastructure has taken a different path: the focus is not on unrestricted portability, but on legal certainty, controlled wallets, compliant custody, transfer agent records, and integration with DTC.
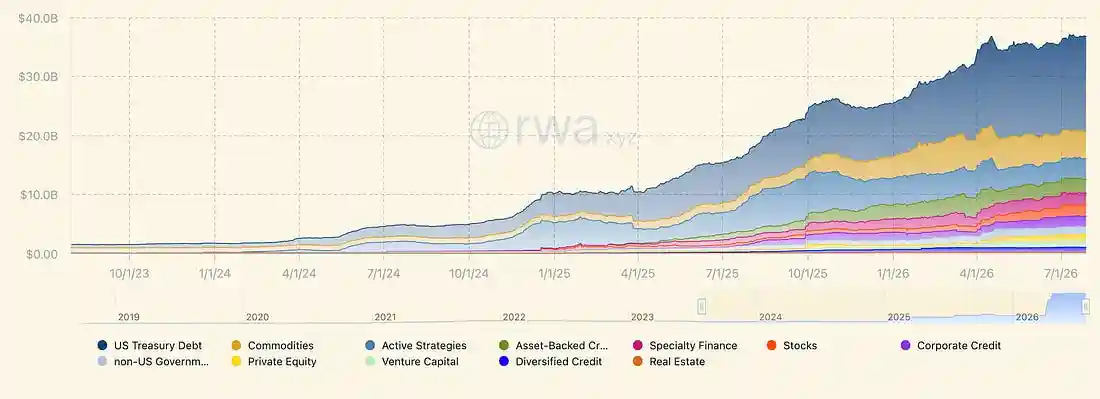
Chart: Market Cap Evolution of Various RWA Asset Types (2019–2026) (Including Tokenized Stocks, Treasuries, etc.)

These two paths solve different problems: offshore wrapped products improve accessibility and composability; regulated infrastructure strengthens the link between the token and the legal ownership claim.

A "canonical share" is the authorized form of the underlying security issued, whose transfer is recognized in the official ownership system. It is fundamentally different from third-party instruments that merely track a stock's price or performance.

Currently, no product achieves all four elements at scale: canonical ownership, broad wallet distribution, institutional liquidity, and independent on-chain price discovery.
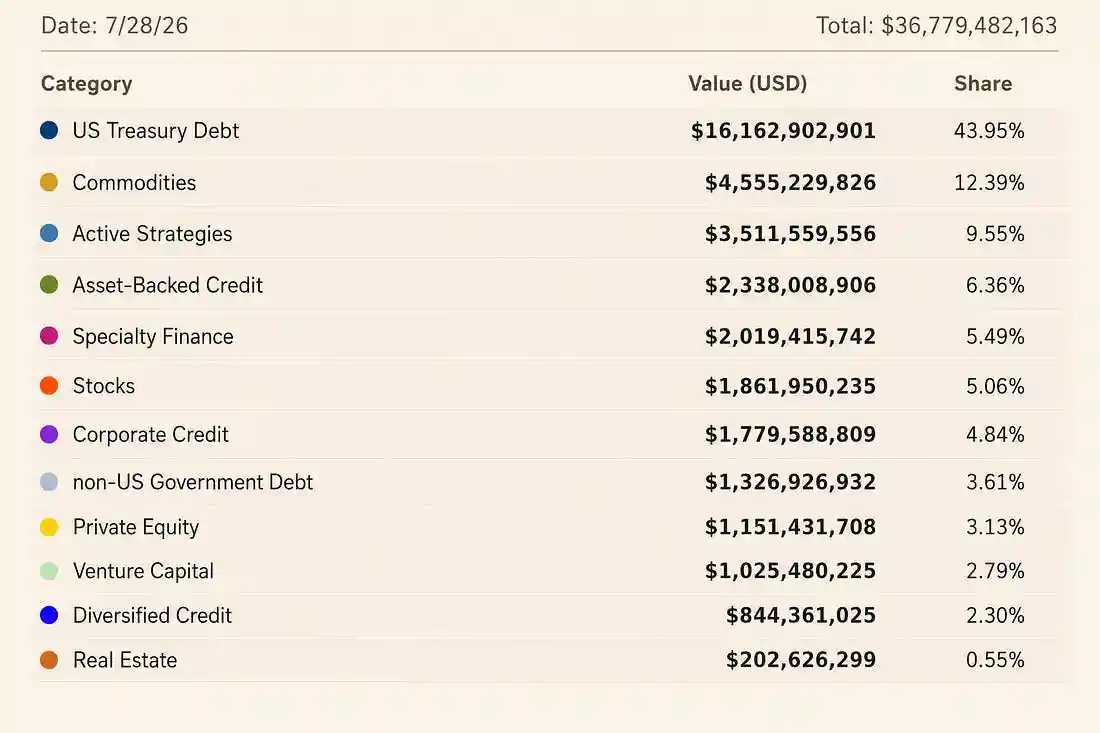
Chart: On-Chain Real Assets Summary Statistics (As of July 28, Total ~$36.78 Billion, US Treasuries Account for 43.95%)

Broader RWA total figures also require careful interpretation. Data reported by RWA.xyz on July 29: distributed value $36.81 billion, represented value $218.27 billion. The apparent $124.33 billion decrease in represented value should not be interpreted as capital outflow or a redemption wave. Between the two observation dates, numerous datasets were added, removed, reclassified, or revalued.

These numbers describe the value of interests covered by the platform's methodology at a specific point in time, not a measure of investor fund flows.

The tokenized stock series is more instructive, as the same "bridged token value" methodology can be applied across both periods. Even so, the reported 98.5% increase cannot be clearly decomposed into new issuance, price appreciation, and classification changes.

FGRS provides a useful example. Figure completed a fundraising offering 4.375 million blockchain shares at $32 per share, but subsequently reported value fluctuates with market prices. Without daily mint, burn, and net asset value data for each product, it's impossible to reliably reconstruct the net market-wide issuance.

Why the $1.888 Billion Headline Number Is Misleading

RWA.xyz uses "Bridged Token Value" to measure tokenized stocks, calculated as: Bridged circulating supply multiplied by Net Asset Value.

Circulating supply excludes balances identified as treasury holdings or pre-minted inventory. The bridged figure also removes tokens locked in known bridge contracts to avoid double-counting when an asset is locked on one network and issued on another.

This is a valid measure of distributed value, but it differs from free float. Free float refers to the portion of securities genuinely available for public trading after excluding restricted, strategic, and concentrated holdings.

The timing of the data also matters. The provided asset-level export shows a distributed total value of $1.8879 billion on July 27, consistent with the ~$1.888 billion shown on the dashboard. A snapshot across platforms and networks on July 29 sums to approximately $1.872 billion.

The difference is $15.8 million, or 0.84%, consistent with price and token supply changes between the two observation dates. Therefore, this report's growth calculations for specific instruments use July 27 data, while platform and network market share uses the July 29 snapshot, and the two datasets are not mixed in the same calculation.
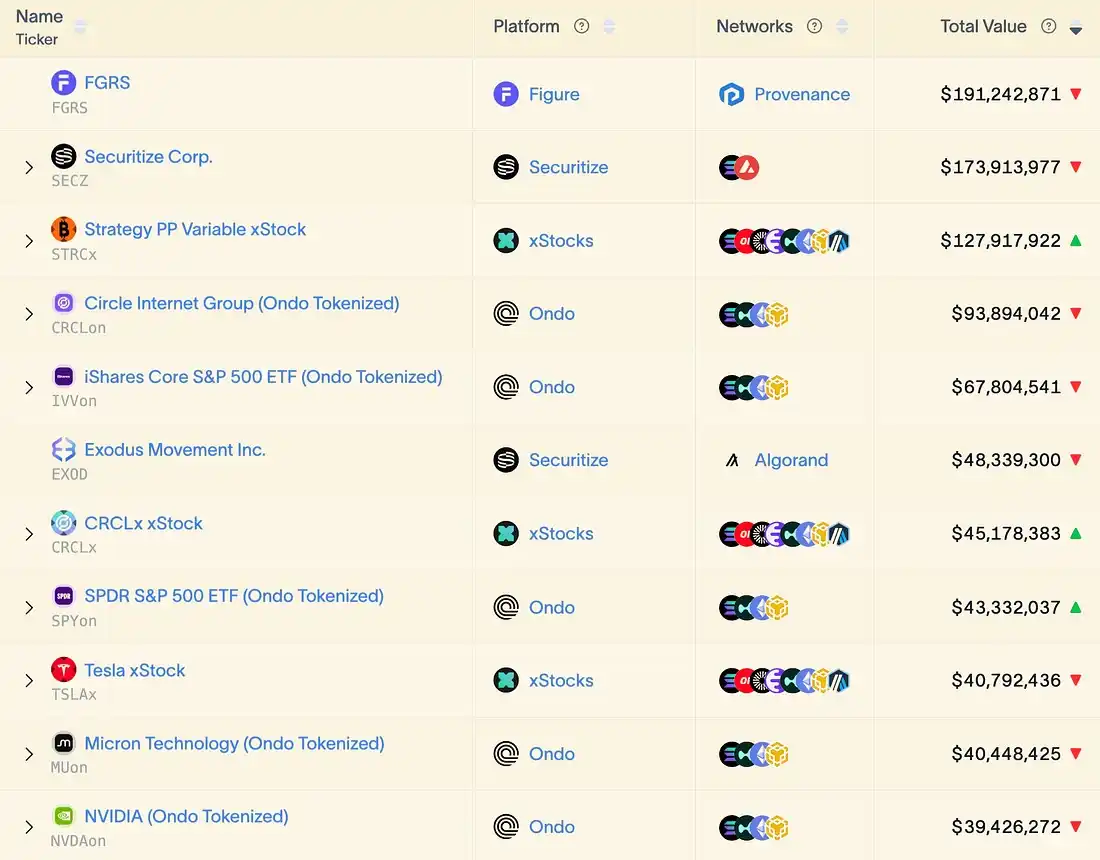
Chart: Tokenized Stock Details (10 Underlyings, Classified by Issuing Platform & Network, FGRS highest at ~$191 million)

Three named instruments contributed roughly half the increment: SECZ added $169 million post-listing, FGRS added $162.9 million, STRCx added $126.6 million. Together they contributed $458.6 million, 49% of the total $936.8 million increase. Long-tail products collectively contributed another $150.5 million, 16.1% of the increment.

These figures reflect changes in distributed value, not investor subscriptions.

SECZ is affected by both the number of represented shares and Securitize's NYSE stock price. FGRS reflects a combination of issuance, conversion activity, and market price changes. STRCx depends on the circulating supply and value of receipts tied to Strategy Floating Rate Preferred Stock.

Calling the above three increases "tokenized stock capital inflows" would merge several economically distinct events into a single, potentially misleading number.

Concentration is more evident at the platform level. In the July 29 snapshot, Ondo and xStocks together accounted for 72.7% of distributed value. Adding Securitize raises the top three platforms' share to 85.1%.
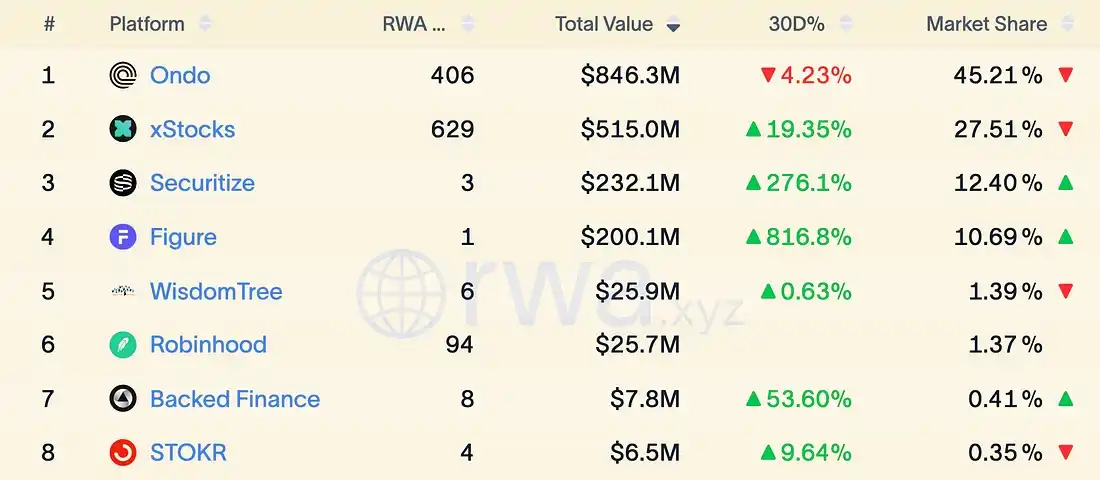
Chart: RWA.xyz Platform Rankings — Ondo (45.21%), xStocks (27.51%), Securitize (12.40%) are Top Three

Distribution across blockchain networks is more decentralized, but this doesn't eliminate underlying common dependencies. Ethereum leads with a 36.2% value share, followed by Solana (19.6%) and BNB Chain (15.8%). Provenance and Avalanche are primarily driven by Figure and Securitize, respectively.

Products issued on different networks may still rely on the same wrapping issuer, broker, custodian, transfer agent, or reference price provider.
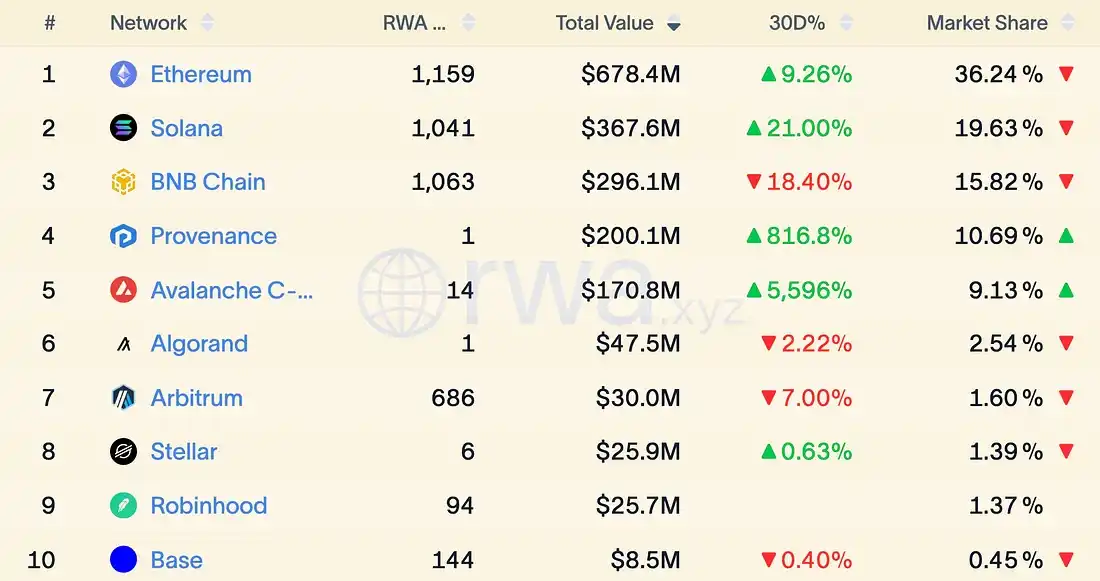
Chart: RWA.xyz Network Rankings — Ethereum (36.24%), Solana (19.63%), BNB Chain (15.82%) are Top Three

This market has broadened in scope but remains legally fragmented. Multiple tokens can simultaneously reference Apple stock or the S&P 500 ETF, but each is a separate legal liability, subject to different jurisdictions, and reliant on different intermediaries.

Bridge adjustments prevent double-counting the same token on different networks, but they cannot—and should not—consolidate products that reference similar assets but offer substantively different legal rights.


Criptos en tendencia

Preguntas relacionadas

QAccording to the article, what is the core contradiction within the current tokenized stock market?

AThe core contradiction is that products with free tradability often lack genuine legal ownership rights, while products with solid legal ownership rights suffer from poor liquidity.

QWhat were the two main categories of assets defined in the March 2026 report, and why does the article say transferability alone is no longer sufficient to judge a product's maturity?

AThe two categories were 'represented assets' (recorded but kept within the issuer's environment) and 'distributed assets' (transferable to external wallets). The article states transferability alone is insufficient because the market has evolved into two distinct paths: offshore products focus on accessibility/composability, while regulated US infrastructure focuses on legal certainty, controlled wallets, and integration with traditional systems like the DTC.

QWhich three specific tokenized stock instruments contributed nearly half of the reported growth in distributed value from March to July 2026?

AThe three instruments were SECZ (which added ~$169M), FGRS (~$162.9M), and STRCx (~$126.6M). Together, they contributed about 49% of the total $936.8M increase in distributed value.

QHow concentrated is the tokenized stock market at the platform level as of late July 2026, based on the data presented?

AThe market is highly concentrated. The top three platforms—Ondo, xStocks, and Securitize—collectively accounted for 85.1% of the total distributed value as of July 29th.

QWhat are the four key elements that, according to the article, no tokenized stock product has managed to achieve at scale simultaneously?

AThe four elements are: 1) Canonical ownership (legal recognition), 2) Broad wallet distribution, 3) Institutional liquidity, and 4) Independent on-chain price discovery.

Lecturas Relacionadas

Interview with Robinhood Executive: Meme + Tokenized US Stocks as "Barbell" Customer Acquisition Strategy, All Business Lines Achieve Hundreds of Millions in Revenue

Interview with Robinhood executive Johann Kerbrat reveals the company's "barbell" customer acquisition strategy for its new Robinhood Chain, combining meme tokens with tokenized stocks. Three weeks after mainnet launch, the chain has seen over $3B in weekly DEX volume and 105M transactions. Kerbrat explains the logic behind the permissionless chain: meme tokens attract DeFi users, while tokenized real-world assets (RWA), currently over 90 US stocks and ETFs accessible in 120+ countries, serve global users. The goal is to bring Robinhood's 27 million funded accounts on-chain by simplifying DeFi with a user-friendly interface, exemplified by features like Robinhood Earn which offers yield without requiring wallet management. Built on Arbitrum's technology stack for its speed, low cost, and Ethereum's security, the chain focuses on financial products like Earn, spot trading, and perpetuals. Kerbrat downplays direct competition with platforms like Base, emphasizing the goal of expanding the overall market for on-chain assets. He details selective partnerships (e.g., Morpho, Lighter) based on compliance, unique UX, and differentiation. While regulatory clarity is pending for US perpetuals, the expansion continues via Bitstamp in Europe. Finally, Kerbrat positions Robinhood as a "super app" integrating stocks, options, crypto, banking, and AI trading, with all major business lines generating hundreds of millions in revenue. For the chain, current priority is driving adoption over maximizing gas fee revenue.

marsbitHace 39 min(s)

Interview with Robinhood Executive: Meme + Tokenized US Stocks as "Barbell" Customer Acquisition Strategy, All Business Lines Achieve Hundreds of Millions in Revenue

marsbitHace 39 min(s)

Fidelity Q3 Report: BTC, ETH, and SOL Continue to Build Bottoms; How Much Further Will This Crypto Bear Market Go?

Fidelity's Q3 Crypto Signal Report analyzes the current bear market, noting Bitcoin (BTC), Ethereum (ETH), and Solana (SOL) are in a prolonged bottoming phase. Key indicators like the weighted Net Unrealized Profit/Loss (NUPL) have turned negative (-0.01), signaling the market is slightly below its aggregate cost basis, with BTC acting as the primary stabilizing asset. BTC's dominance has risen to 68%, indicating a lack of capital rotation to other digital assets. Performance has been weak across the board, with BTC, ETH, and SOL down significantly year-to-date. Market sentiment is depressed, exacerbated by substantial outflows from spot ETPs and a challenging macro environment. The report compares the current ~203-day downtrend to historical ~300-day bottoming cycles, suggesting the process may be two-thirds complete, with late 2026 as a potential timeframe to monitor. For Bitcoin, NUPL at 0.09 indicates cautious sentiment, while momentum signals remain negative. The Yardstick metric points to potential undervaluation relative to network security (hashrate). Ethereum's NUPL is deep in the "capitulation" zone at -0.43, a historically positive signal for future returns, though its momentum and network fee revenue are negative. Solana shows the deepest NUPL at -0.72 but demonstrates relative resilience in on-chain activity and stablecoin transfer volume. The report concludes that while several metrics are near historical capitulation levels, a definitive market bottom has not yet been established. The path forward likely involves continued consolidation, with BTC's relative strength and fundamental on-chain usage for ETH and SOL providing key areas for investor observation.

marsbitHace 54 min(s)

Fidelity Q3 Report: BTC, ETH, and SOL Continue to Build Bottoms; How Much Further Will This Crypto Bear Market Go?

marsbitHace 54 min(s)

Trading

Spot

Artículos destacados

Cómo comprar CAP

¡Bienvenido a HTX.com! Hemos hecho que comprar Cap (CAP) sea simple y conveniente. Sigue nuestra guía paso a paso para iniciar tu viaje de criptos.Paso 1: crea tu cuenta HTXUtiliza tu correo electrónico o número de teléfono para registrarte y obtener una cuenta gratuita en HTX. Experimenta un proceso de registro sin complicaciones y desbloquea todas las funciones.Obtener mi cuentaPaso 2: ve a Comprar cripto y elige tu método de pagoTarjeta de crédito/débito: usa tu Visa o Mastercard para comprar Cap (CAP) al instante.Saldo: utiliza fondos del saldo de tu cuenta HTX para tradear sin problemas.Terceros: hemos agregado métodos de pago populares como Google Pay y Apple Pay para mejorar la comodidad.P2P: tradear directamente con otros usuarios en HTX.Over-the-Counter (OTC): ofrecemos servicios personalizados y tipos de cambio competitivos para los traders.Paso 3: guarda tu Cap (CAP)Después de comprar tu Cap (CAP), guárdalo en tu cuenta HTX. Alternativamente, puedes enviarlo a otro lugar mediante transferencia blockchain o utilizarlo para tradear otras criptomonedas.Paso 4: tradear Cap (CAP)Tradear fácilmente con Cap (CAP) en HTX's mercado spot. Simplemente accede a tu cuenta, selecciona tu par de trading, ejecuta tus trades y monitorea en tiempo real. Ofrecemos una experiencia fácil de usar tanto para principiantes como para traders experimentados.

253 Vistas totalesPublicado en 2026.06.26Actualizado en 2026.06.26

Cómo comprar CAP

Discusiones

Bienvenido a la comunidad de HTX. Aquí puedes mantenerte informado sobre los últimos desarrollos de la plataforma y acceder a análisis profesionales del mercado. A continuación se presentan las opiniones de los usuarios sobre el precio de CAP (CAP).

活动图片