An AI Version of the 'Subprime Crisis'? A Hidden Debt of $1.8 Trillion is Accumulating in the Shadows Amid the Frenzy

marsbitPublicado a 2026-06-15Actualizado a 2026-06-15

Resumen

Amidst the AI infrastructure construction boom, a massive debt expansion is forming, with the most dangerous portion remaining off-balance sheets. Morgan Stanley research reveals approximately $1.8 trillion in off-balance-sheet exposures, including nearly $1 trillion in purchase commitments and over $800 billion in non-active lease contracts. These future cash outflows are not recorded as liabilities. The leverage of hyperscale cloud companies has surged from 0.9x to 1.8x in just two quarters. Private credit firms like Apollo and Blackstone are shifting leverage into the supply chain through complex, opaque SPV (Special Purpose Vehicle) financing structures. Global AI-related bond issuance has skyrocketed, with annual volume projected to exceed $570 billion. However, capital expenditure growth is outpacing revenue and free cash flow. Major cloud providers may see free cash flow approach zero or turn negative in 2026. A significant 'depreciation cliff' looms as vast amounts of current capital spending, recorded as 'construction in progress,' have yet to begin depreciating, artificially inflating current profit margins. Future depreciation could severely pressure earnings. The core risk is identified as a series of timing mismatches, not an immediate solvency crisis. Investment is racing ahead of monetization, leverage is being obscured, and accounting classifications hinder comparability. The entire financing structure faces a fundamental stress test if AI commercialization ...

Amid the frenzy of AI infrastructure construction, an unprecedented debt expansion is quietly taking shape—with its most dangerous portion never appearing on any balance sheet.

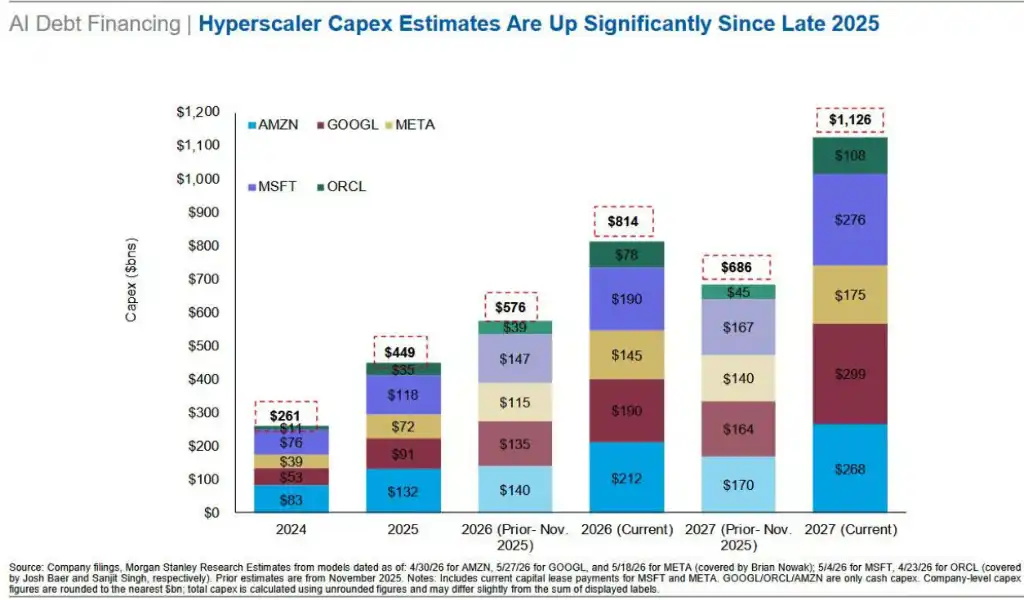
Goldman Sachs's latest report predicts that capital expenditures for hyperscale cloud companies will reach $1.1 trillion to $1.4 trillion by 2027, far exceeding market consensus. However, according to an in-depth study by Morgan Stanley, this already staggering figure is just the tip of the iceberg.

Nearly $1 trillion in purchase commitments, over $800 billion in unactivated lease contracts, and tens of billions of dollars in supplier financing arrangements collectively constitute an off-balance-sheet exposure of approximately $1.8 trillion—these liabilities exist outside the balance sheet but genuinely lock in future cash outflows.

The market has not yet fully priced in these risks.

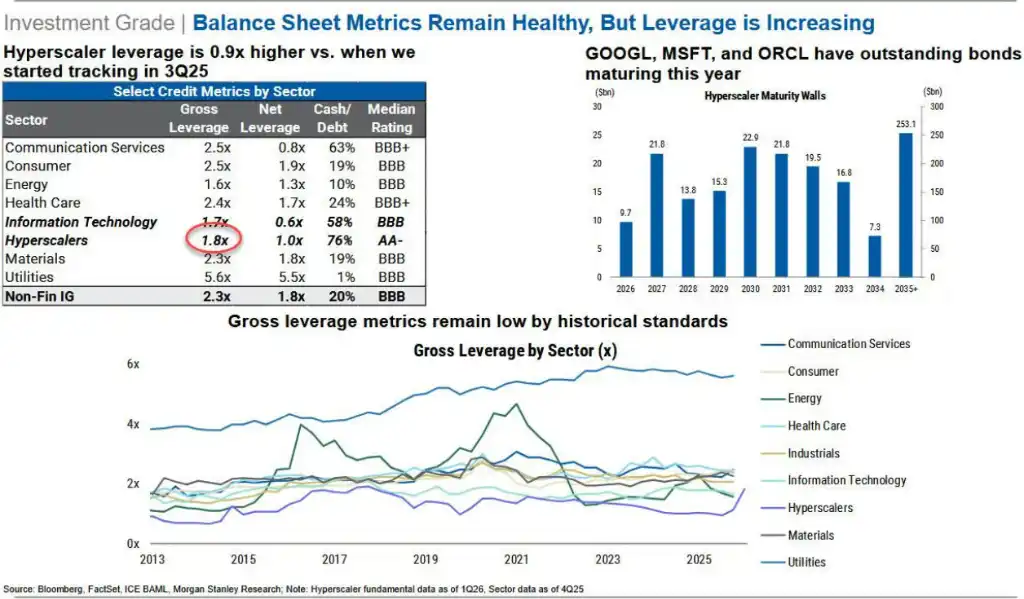
Morgan Stanley warns that the leverage ratio of hyperscale cloud companies has surged from 0.9x to 1.8x in just two quarters, with capital expenditure growth continuing to outpace revenue and free cash flow growth, while the real impact of depreciation pressure has yet to arrive.

Meanwhile, private credit firms represented by Apollo and Blackstone are transferring leverage to the supply chain level through SPVs (Special Purpose Vehicles), creating a highly circular and difficult-to-penetrate financing structure. If AI commercialization falls short of expectations or enterprise customers shift en masse to cheaper alternatives, the fragility of the entire financing chain will be exposed.

Debt Issuance Frenzy: AI Has Become the Biggest Variable in Public Markets

According to Morgan Stanley's latest "AI Debt Financing Tracker Report," as of the end of May 2026, the scale of global AI-related bond issuance has reached $236 billion, a surge of 357% compared to the same period in 2025.

Morgan Stanley expects the total issuance of AI debt to exceed $570 billion for the full year, with the pace accelerating further in the second half of the year as capital expenditure financing needs are concentrated.

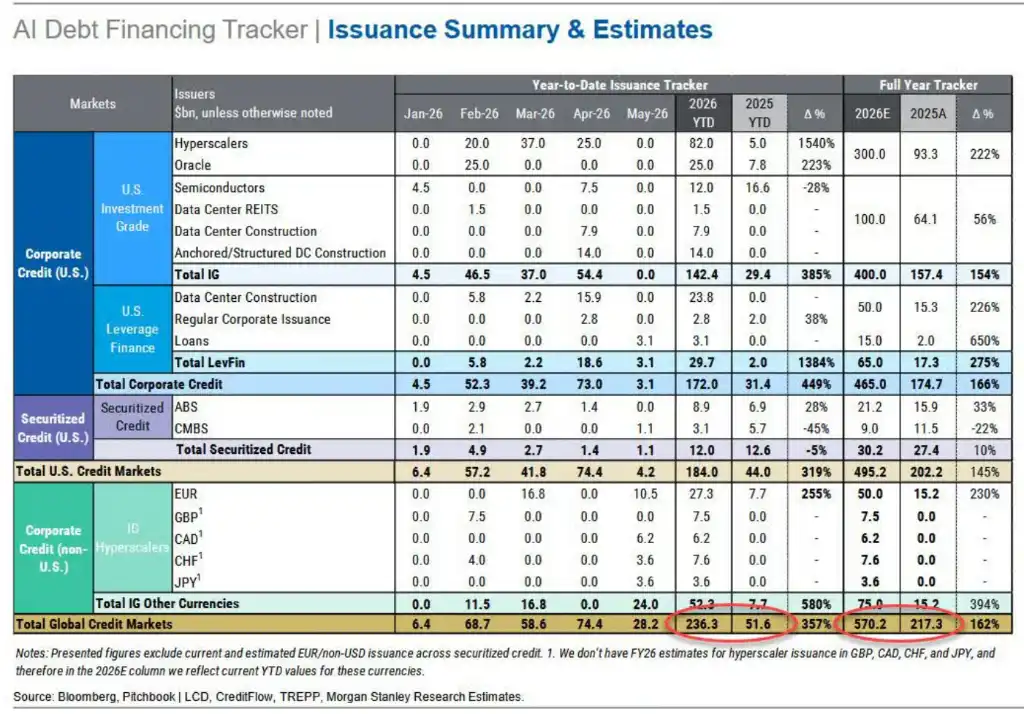
In April alone, AI-related bond issuance exceeded $74 billion, hitting a new high for the year, with project financing structures (for data center construction) accounting for 85% of high-yield bond supply and 40% of investment-grade bond supply. Meanwhile, the five hyperscale cloud companies—Amazon, Meta, Google, Microsoft, and Oracle—now account for 4% of the entire investment-grade bond index.

In terms of leverage, the gross leverage ratio for hyperscale cloud companies has risen from 0.9x in the third quarter of 2025 to the current 1.8x, increasing by approximately 0.3x per quarter, already surpassing the leverage level of the entire energy industry.

Morgan Stanley points out that, affected by supply pressure, related credit spreads have drifted from the AA range to the A range and may widen further. Meta's credit spread is currently wider than the CDX IG benchmark.

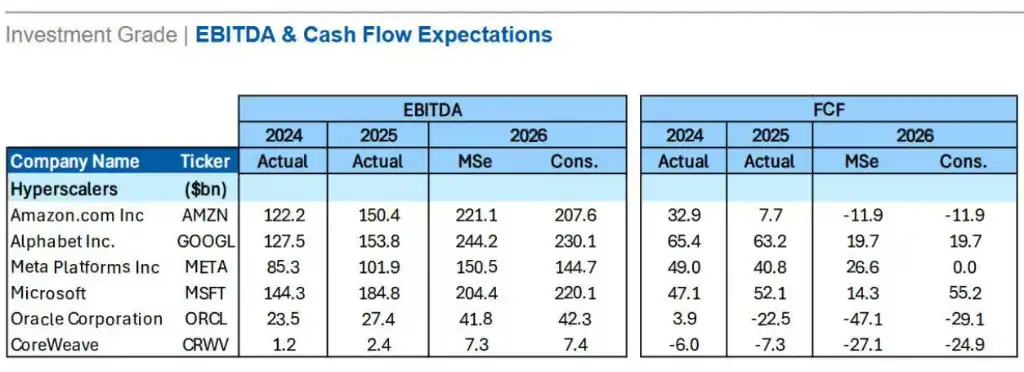
Regarding free cash flow, Morgan Stanley predicts that Amazon and Meta's free cash flow in 2026 will approach zero or even turn negative, at which point incremental financing will almost entirely rely on new debt.

$1.8 Trillion Off-Balance-Sheet Exposure: Invisible Liabilities, Locked-in Cash Outflows

Todd Castagno from Morgan Stanley's Global Valuation, Accounting & Tax team notes in the report that focusing solely on capital expenditure numbers would severely underestimate the true financial commitments of the AI construction cycle. Beyond the disclosed capital expenditures, there are three key types of off-balance-sheet exposure:

Purchase commitments of approximately $982 billion. The total value of long-term purchase contracts by hyperscale cloud companies and Nvidia is close to $1 trillion. Under accounting standards, these obligations are not recorded as liabilities until goods are delivered, unless the company expects a contract loss. Therefore, nearly $1 trillion in future cash outflows currently do not appear as liabilities on any balance sheet.

Notably, Nvidia's own inventory and purchase obligations have risen to about 32% of consensus revenue forecasts for fiscal year 2027, far above the historical range of 15% to 20%, indicating that supply chain commitment risks are extending to chip suppliers.

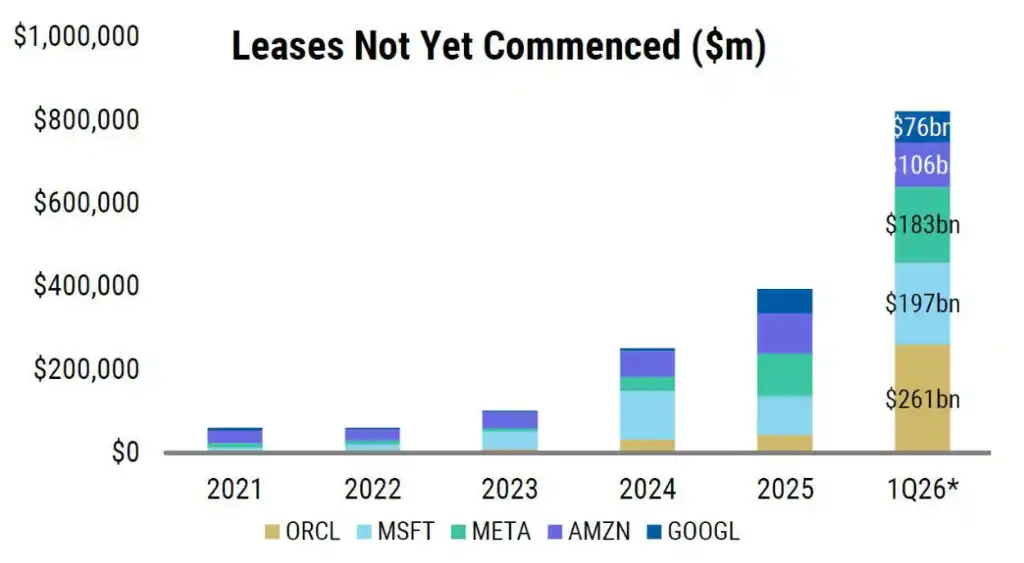
Unactivated lease commitments of approximately $822 billion. Over $800 billion in lease contracts have been signed but not yet activated and are not included in current lease liabilities. Additionally, arrangements such as variable lease payments, renewal options, and residual value guarantees also exist outside the balance sheet.

Morgan Stanley estimates that if finance leases were included in the calculation, Microsoft's capital expenditure-to-sales ratio would jump from 33%/50% (fiscal 2026/2027) to 44%/64%, while Oracle's could rise from 76%/115% to 101%/189%.

Unpaid capital expenditures in accounts payable of approximately $110 billion. The days payable outstanding (DPO) of hyperscale cloud companies have significantly lengthened—Oracle's increased by 370% year-on-year, Meta's by 73%, Microsoft's by 69%—meaning the entire supply chain is effectively financing AI construction, with suppliers bearing the liquidity pressure that should be carried by the buyers.

SPVs and Circular Financing: Leverage Moves to the Shadows

Another core dimension of off-balance-sheet risk is the circular financing structure built through SPVs.

A $35 billion "chip-collateralized" private credit deal completed this week by Apollo and Blackstone for Anthropic vividly illustrates the logic of this model:

Broadcom provides backing for this SPV; Anthropic uses the raised funds to purchase Google chips manufactured by Broadcom, with Google holding a 14% stake in Anthropic; Morgan Stanley, which arranged the deal, simultaneously provides loans to the investors participating in the transaction.

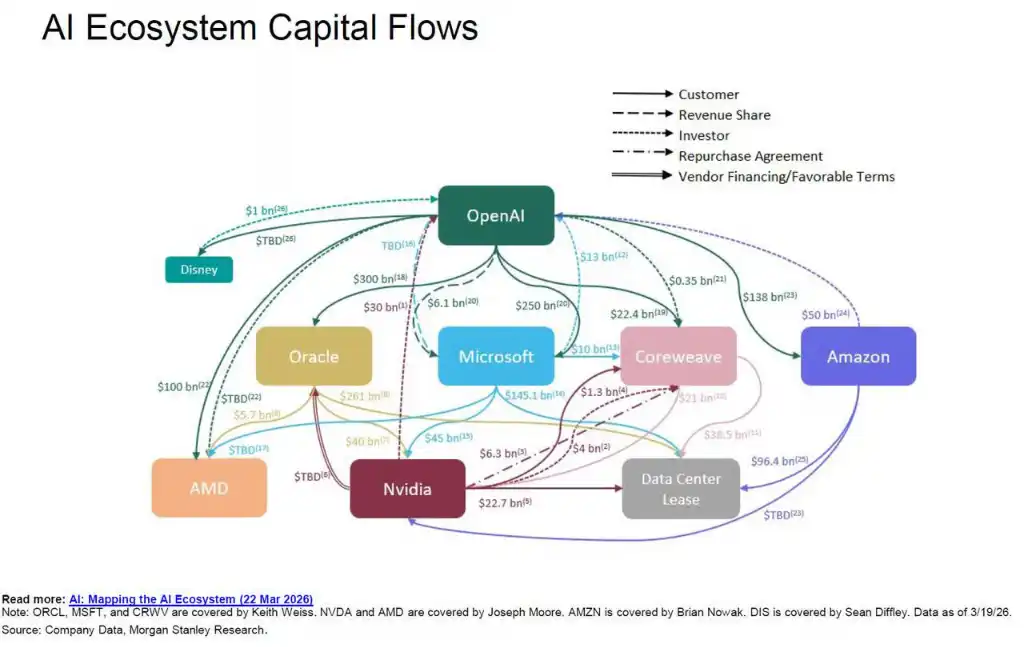
Morgan Stanley's AI ecosystem financing correlation map shows multiple circular relationships—customer, investor, supplier financing, and repurchase—among OpenAI, Oracle, Nvidia, Microsoft, CoreWeave, AMD, and Amazon. The same funds circulate repeatedly among a few key entities, with SPVs being the core tool enabling this circulation.

It is reported that Athene, the insurance subsidiary of Apollo, is particularly active in this structure—raising funds by selling annuities to retirees and then injecting the capital into SPVs to participate in AI infrastructure financing.

This model shifts leverage from the visible balance sheets of hyperscale cloud companies to suppliers and the private credit ecosystem, making the true systemic risk exposure difficult for external observers to identify and aggregate.

Depreciation Cliff and Monetization Gap: The Delayed Shock

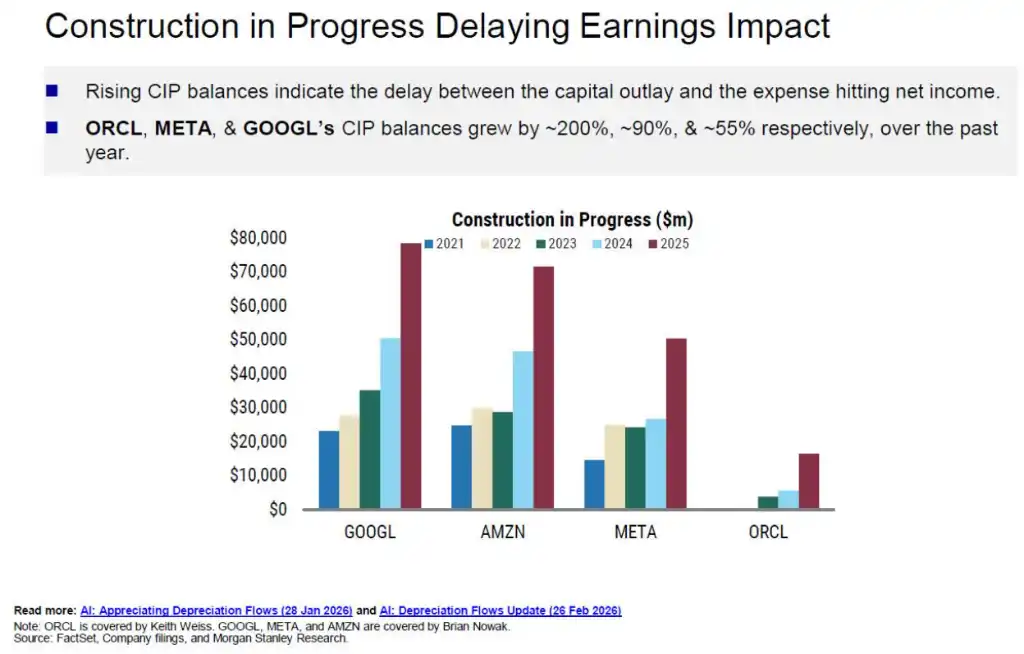
Current financial data exhibits systematic optimism bias. A large amount of capital expenditure is currently booked as "construction in progress" (CIP) and has not yet begun to depreciate, artificially inflating reported profit margins and underestimating future expense pressure.

The CIP balances of Oracle, Meta, and Google have grown by approximately 200%, 90%, and 55% year-on-year, respectively.

Once these assets gradually transition to depreciation, the impact will be concentrated.

Morgan Stanley predicts that the cumulative depreciation for Microsoft, Oracle, Meta, and Google over the next three years will exceed $520 billion. Taking Oracle as an example, depreciation as a percentage of revenue could rise from the current 7% to 28% in fiscal year 2028; Meta's could rise from 9% to 19%.

In this context, the only path to maintaining profit margins is for revenue to grow significantly in sync—yet the upward revisions to revenue forecasts currently lag far behind the upward revisions to capital expenditure forecasts.

Data shows that consensus capital expenditure forecasts for Google for 2026 have been raised by 139% compared to a year ago, while Meta's and Amazon's were raised by 85% and 81%, respectively. Oracle saw the largest increase, at 175%.

Meanwhile, revisions to revenue forecasts are noticeably lagging, revealing a clear structural mismatch where capital expenditure is outpacing commercialization.

Furthermore, over $2 trillion in remaining performance obligations (RPO) is highly concentrated in a few large, long-term contracts, presenting significant counterparty concentration risk—if any major participant in this circular system encounters problems, it could trigger a chain reaction.

Timing Mismatch Rather Than an Immediate Solvency Crisis

Morgan Stanley concludes that these risks do not currently constitute an imminent solvency crisis but rather a series of overlapping timing mismatches and information disclosure gaps: depreciation pressure is deferred, capital expenditure outpaces monetization, leverage shifts to suppliers and the private credit layer, and the comparability of capital intensity between different companies is significantly undermined by accounting classification differences.

Hyperscale cloud companies are clearly aware of the limited window of current market sentiment and are seizing the opportunity to maximize financing scale.

Goldman Sachs analyst Ryan Hammond points out that if AI infrastructure investment scales to 2% to 3% of GDP, analogous to historical construction cycles of railways and the automotive industry, capital expenditures could reach $1.1 trillion by 2027. In an extreme scenario, considering the cash flow of hyperscale cloud companies and the capacity of the investment-grade credit market, the upper limit might reach $1.4 trillion.

However, all of this hinges on the ability of large language models (LLMs) to continue increasing token pricing and maintain sufficient enterprise customer stickiness. A growing number of enterprises are turning their attention to AI products with comparable performance but significantly lower prices.

Should a structural shift occur on the demand side, the meticulously constructed financing system of today will face a fundamental stress test.

Preguntas relacionadas

QWhat is the estimated scale of the off-balance-sheet exposure that is building up in the AI infrastructure boom, according to the article?

AThe total off-balance-sheet exposure is approximately $1.8 trillion, comprising nearly $1 trillion in purchase commitments, over $800 billion in non-activated lease contracts, and over $100 billion in supplier financing arrangements.

QHow has the leverage ratio of hyper-scale cloud companies changed recently, and what is it compared to?

AThe gross leverage ratio of hyper-scale cloud companies has surged from 0.9x in Q3 2025 to the current 1.8x, increasing by approximately 0.3x per quarter. This level has already exceeded the leverage of the entire energy sector.

QWhat are the three main types of off-balance-sheet commitments identified in the Morgan Stanley report?

AThe three main types are: 1) Purchase commitments of approximately $982 billion, 2) Non-activated lease commitments of about $822 billion, and 3) Unpaid capital expenditures within accounts payable, estimated at $110 billion.

QWhat is the core mechanism described for shifting leverage into the shadows of the AI ecosystem?

AThe core mechanism is the use of Special Purpose Vehicles (SPVs) to build circular financing structures. This transfers leverage from the visible balance sheets of hyper-scale cloud companies to suppliers and the private credit ecosystem, making systemic risk exposure difficult to observe.

QWhat is the primary nature of the financial risk highlighted by Morgan Stanley regarding the AI investment cycle?

AThe primary risk is not an imminent solvency crisis, but a series of timing mismatches and information gaps. These include deferred depreciation pressure, capital expenditures outpacing monetization progress, leverage shifting to suppliers and private credit, and a lack of comparability in capital intensity due to accounting differences.

Lecturas Relacionadas

Gate Research Institute: Analysis of Chart Patterns and Breakout Trading Strategies

Gate Research Institute: Chart Pattern Analysis and Breakout Trading Strategies Chart patterns are crucial tools in technical analysis for observing market supply and demand shifts, trend continuations, and reversals. This analysis involves a comprehensive evaluation of trend, volume, support/resistance, time cycles, and breakout validity, not just rote pattern recognition. Patterns are broadly categorized into reversal patterns (e.g., Double Tops/Bottoms, Head and Shoulders) and continuation patterns (e.g., Flags, Triangles, Rectangles). An effective breakout, key for trading, requires clear support/resistance, prolonged consolidation, a prevailing trend backdrop, and volume confirmation. However, breakouts are not guaranteed, as false breakouts are common. Risk must be managed through position sizing, stop-loss orders, pullback confirmations, and profit-taking in stages. Key pattern types discussed include: * **Rectangle Patterns:** Indicate market indecision within parallel support and resistance, with breakouts projecting a move equal to the pattern's width. * **Flag & Pennant Patterns:** Short-term continuation patterns following sharp price moves ("flagpoles"). * **Triangle Patterns:** Symmetrical, Ascending (bullish bias), and Descending (bearish bias) triangles, representing consolidation before a directional move. * **Head and Shoulders Patterns:** Major reversal patterns signaling trend exhaustion. The article details breakout trading strategies, defining valid breakouts by price closing beyond a key level with increased volume and minimal immediate re-entry into the prior range. It contrasts range trading with breakout trading and outlines entry methods (immediate entry, pullback entry, scaling in), stop-loss placement (based on pattern failure), and profit-taking techniques (target-based, structure-based, trend-following). It further classifies breakout outcomes: 1. **Valid Breakouts:** Strong, sustained moves in the breakout direction. 2. **Pullback Breakouts:** Price breaks out, retests the breakout level as support/resistance, then resumes the trend—offering a lower-risk entry. 3. **False Breakouts:** Price briefly breaches a level but quickly reverses back into the prior range, a common risk managed by strict stop-losses. Key validation tools for breakouts include volume analysis, the principle of support/resistance role reversal, and momentum indicators like ATR, Moving Averages, Bollinger Bands, and RSI. In conclusion, while chart patterns and breakout analysis provide a structured framework, their effectiveness relies on multiple confirming factors—trend context, volume, and proper risk management. They should be integrated into a broader trading system rather than used as standalone signals.

marsbitHace 28 min(s)

Gate Research Institute: Analysis of Chart Patterns and Breakout Trading Strategies

marsbitHace 28 min(s)

Joseph Chalom: Ethereum is Becoming the "Settlement Layer of Trust" for Global Finance

In a speech titled "The Industrialization of Trust," Sharplink CEO Joseph Chalom (former BlackRock digital assets head) discussed the future transformation of global finance. Drawing from 20 years at BlackRock, where he led the launch of Bitcoin/ETH ETFs and tokenized funds, Chalom highlighted the immense hidden costs of establishing trust in traditional finance—estimated at over $9.3 trillion annually in the US alone due to fragmented systems, multi-day settlements, and countless reconciliations. He argued that Ethereum is emerging as the global financial "settlement layer for trust," with its robust, decentralized infrastructure securing over $300 billion in on-chain assets and most stablecoins and tokenized assets. The future, he stated, will be driven by three accelerating pillars: stablecoins (evolving beyond crypto gateways to become efficient cross-border payment rails), tokenized assets (enabling 24/7 trading and reshaping capital markets), and DeFi (providing automated, accessible financial services). A potential game-changer, Chalom added, is the fourth pillar: "Agentic Finance," where AI agents autonomously execute programmable financial transactions via smart contracts and stablecoins. He envisions individuals soon having AI-powered "CFOs in their pockets" to optimize idle capital and manage tokenized portfolios. This shift, facilitated by Ethereum's trustless settlement, could multiply on-chain transaction volume 1000x within a year, moving finance toward a seamless, digitized future.

marsbitHace 28 min(s)

Joseph Chalom: Ethereum is Becoming the "Settlement Layer of Trust" for Global Finance

marsbitHace 28 min(s)

STRC Severely Unpegged, What Risks Is the Market Pricing In?

The article analyzes the recent significant de-pegging of Strategy's perpetual preferred stock, STRC, whose price fell to approximately $89, far below its $100 face value. This discount has pushed its simple yield to around 12.9%, creating a paradox. The stock was designed as a high-yield instrument trading near par, and Strategy maintains an 11.5% annual dividend, even recently switching to semi-monthly payments to support the price. The author explores several reasons why the high yield hasn't attracted enough buying pressure to restore the par value. A key factor is potential reverse deleveraging from carry trades, where leveraged investors may be forced to sell due to margin calls as the price falls, creating a self-reinforcing downward spiral. Additionally, the tokenization and integration of STRC into DeFi protocols (like Apyx, Saturn, Pendle) have introduced faster, more transparent, and potentially more volatile price adjustment mechanisms through leverage and yield-splitting products. The emergence of a competing product, Strive's SATA, offering a 13% yield with daily dividends, has also changed the yield benchmark, challenging STRC's unique high-yield narrative. Furthermore, the market is questioning the distinction between Strategy's substantial Bitcoin reserves, which provide long-term balance sheet coverage, and the certainty of stable near-term cash flow for dividends. Ultimately, the price dip represents a stress test for this type of BTC-backed, high-yield financing tool. The future path of STRC depends on whether Strategy acts to reinforce the $100 peg (e.g., by adjusting dividends), whether DeFi-related leverage unwinds further, and how investors ultimately price the risks of leverage, competition, and cash flow uncertainty against the offered yield.

marsbitHace 40 min(s)

STRC Severely Unpegged, What Risks Is the Market Pricing In?

marsbitHace 40 min(s)

LIT Token Hits Six-Month High: How Long Can the Buyback Flywheel Keep Burning Fuel?

The LIT token of decentralized perpetual exchange Lighter surged to a six-month high above $1.90 on June 18th, with a market cap of $425 million. After a price correction earlier this year, the recent rebound is attributed to its core "buyback flywheel" mechanism. All protocol fee revenue is used for programmatic, hourly market buybacks of LIT. Since its TGE in December 2025, approximately 15 million LIT (6% of circulating supply) has been repurchased for around $21 million. Additional price support comes from the LLP (Lighter Liquidity Pool), where providers must stake LIT worth 10% of their deposited USDC, locking significant token supply. However, challenges persist. Trading volume has declined amidst a sluggish market, with total volume at $1.68 trillion, significantly lower than leading competitor Hyperliquid's $4.37 trillion. While Lighter focuses on perpetual contracts, RWA, and Pre-IPO markets, Hyperliquid has expanded into prediction markets and boasts a U.S. spot ETF, attracting institutional investment and influencer endorsements like from Arthur Hayes. In contrast, LIT currently lacks similar high-profile backing. With 75% of LIT's total 1 billion supply still locked (team and investor tokens begin a 3-year linear unlock in December 2026), there is no immediate unlock selling pressure. The token's future performance hinges on sustaining trading volume growth, successful product iteration, and executing its transparent buyback strategy against a dominant competitor.

Foresight NewsHace 59 min(s)

LIT Token Hits Six-Month High: How Long Can the Buyback Flywheel Keep Burning Fuel?

Foresight NewsHace 59 min(s)

Trading

Spot
Futuros
活动图片